May 3, 2023 – Fed Wednesday
I purposely wrote my report yesterday to show that I was extremely bullish, but since we got the Pop and Drop with the Bank failure and JPM Buyout, I took a loss on a leveraged trade (GDXU). I jumped into Miners and GDXU, because when the banks failed in March, the Precious Metals sector just took off and did not look back. This set up looked ready to go. I had a stop, so that cut my GDXU with the uncertainty of a reversal Pre-Fed. I did hold on to my miners, because we were due for a dcl and had a low in the 33 day area. Now let me say that Tuesdays price action was Premo! I loved it, and even though the Fed Days can be volatile, I love the set up that we have for Gold & Silver heading into the Fed Wednesday. So with that said…Let’s get to the charts!
.
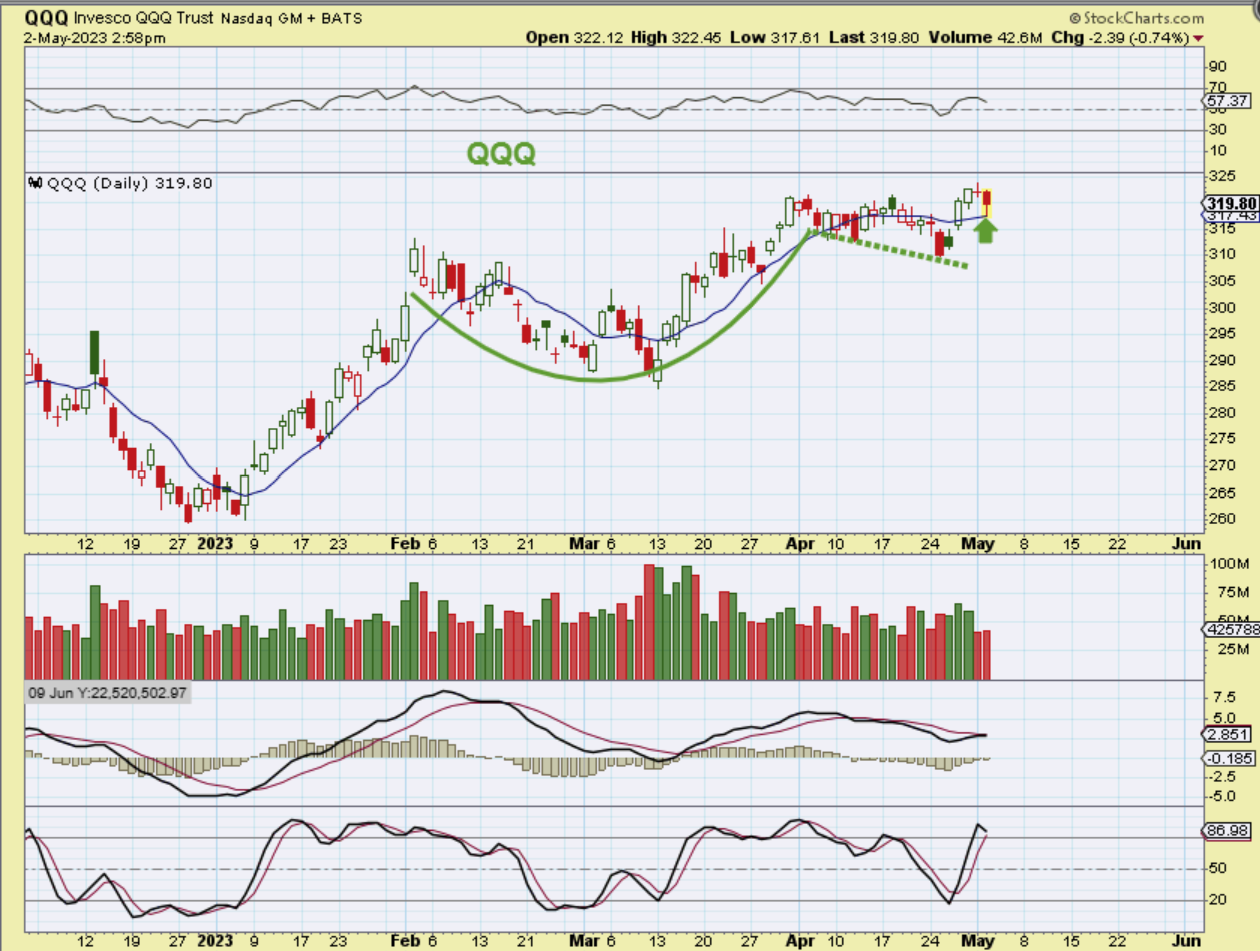
QQQ – I captured this as we approached the final hour of trading, because the markets were selling off earlier, but here they were now trying to come back. Do you see a perfect Cup & handle? I do.
.
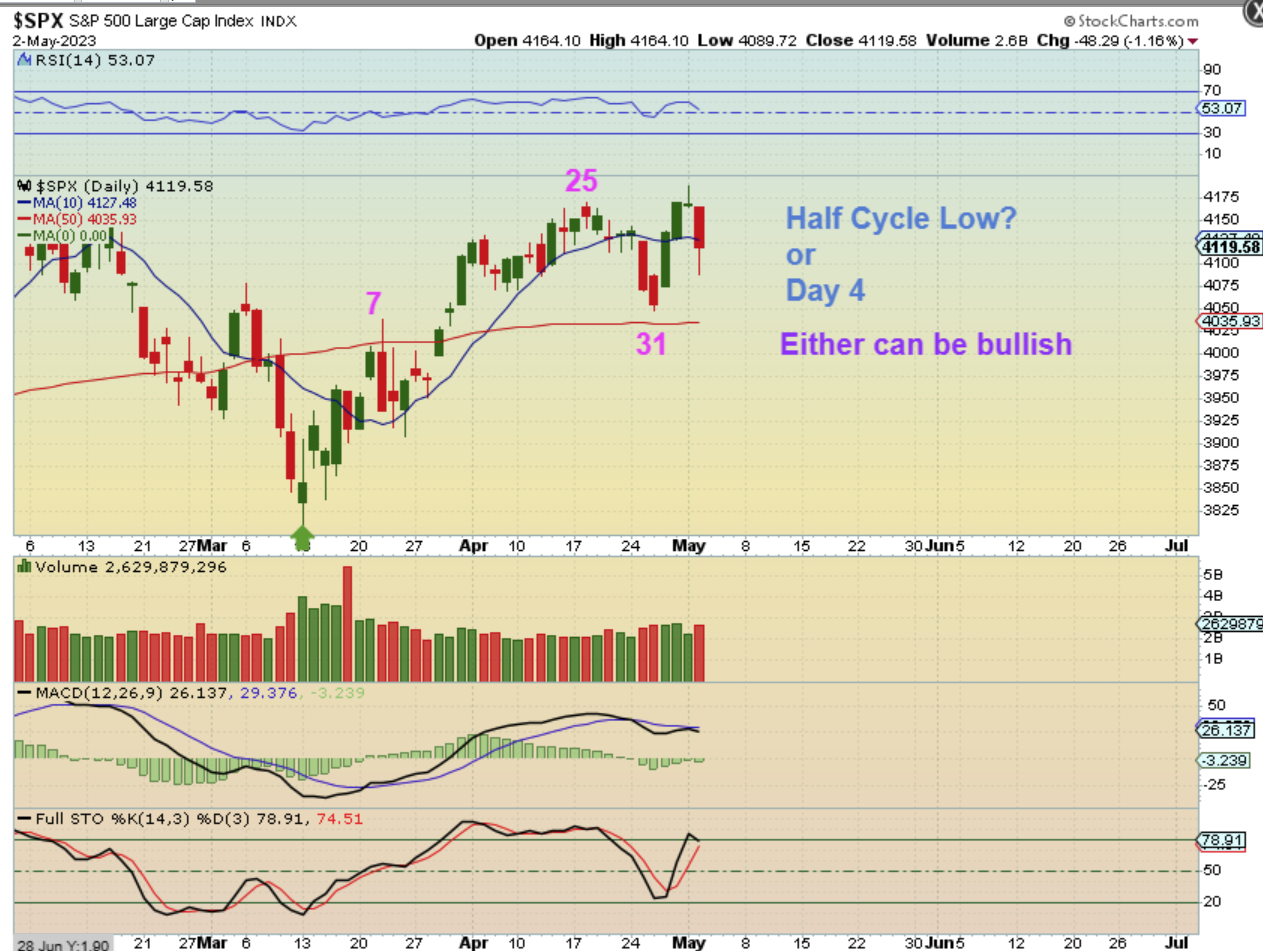
SPX at the close: We still have the question about that day 31 low. We had 2 50 day daily cycles out of the ICL, so is this a short daily cycle with a dcl at day 31? Or is this a half cycle low? Guess what? It doesn’t really matter, since either one can rally higher if the USD drops.
.
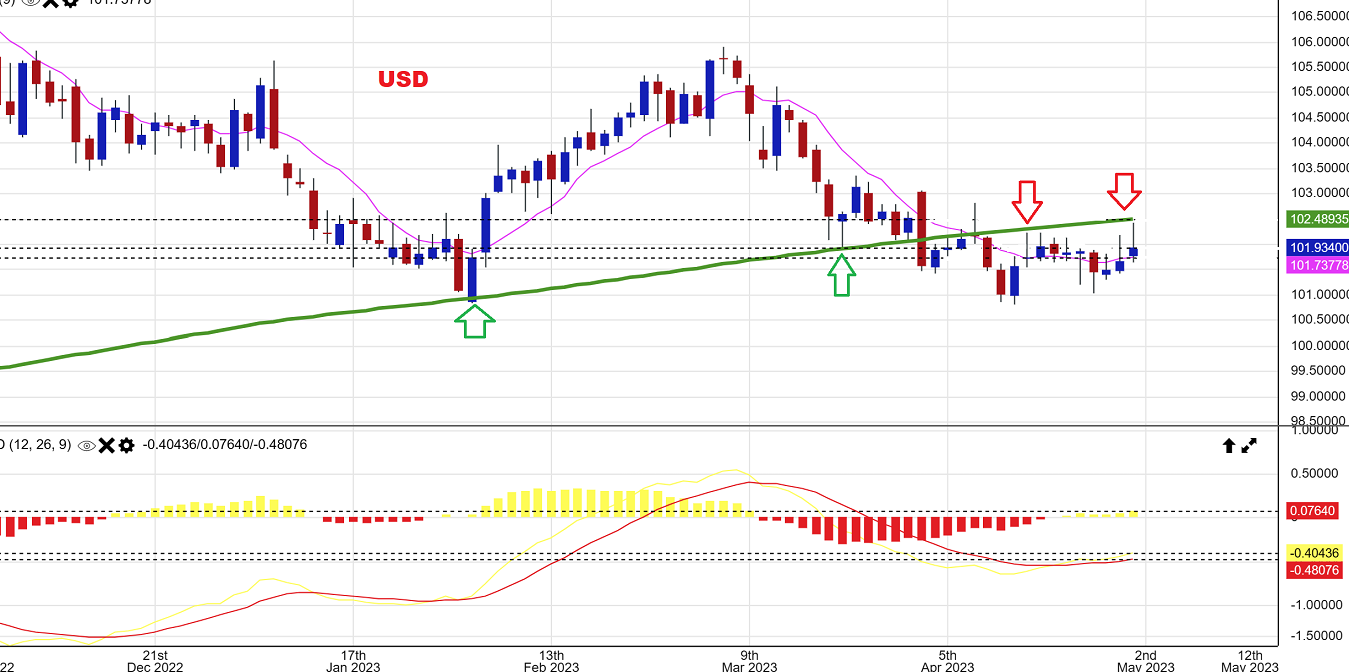
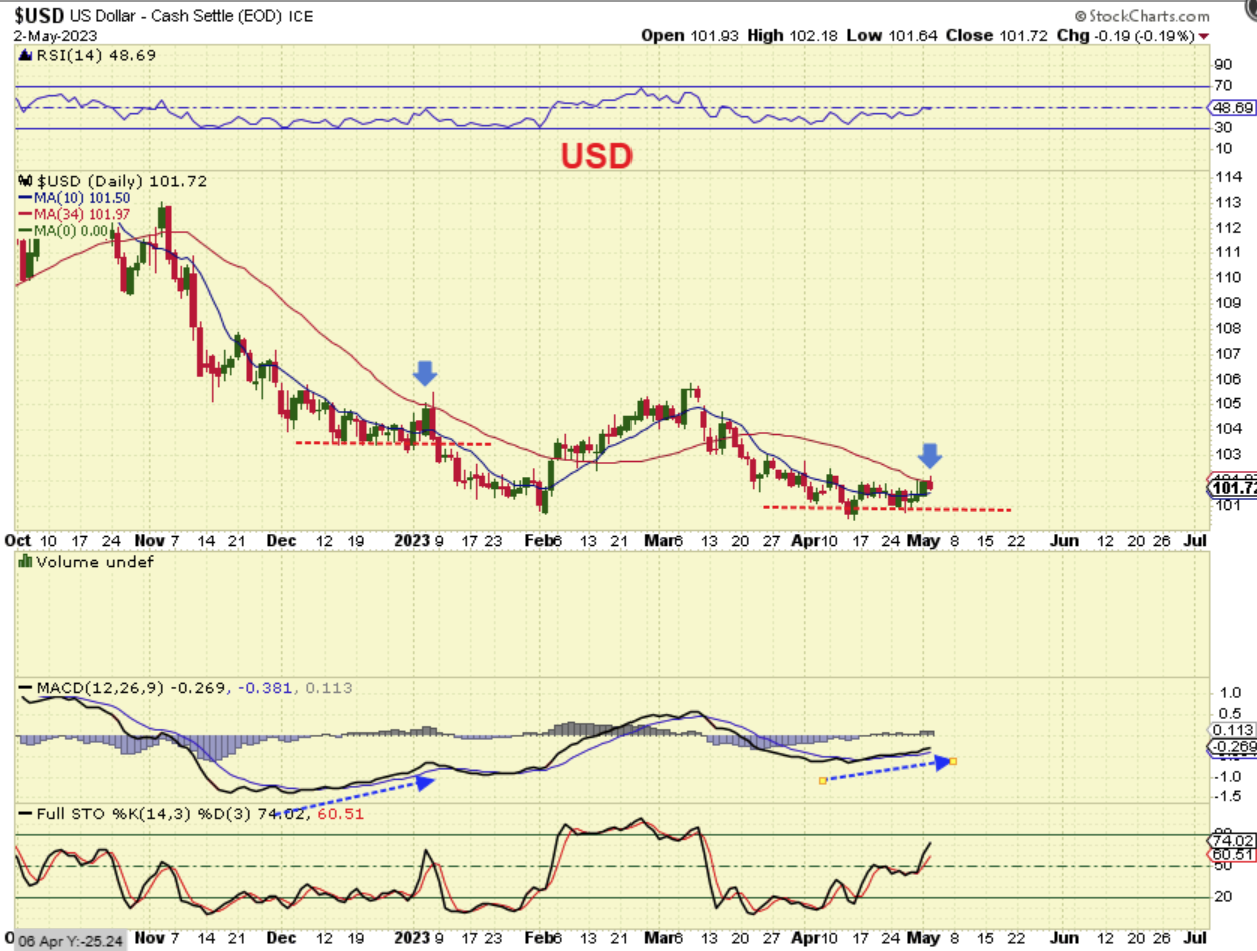
I captured this chart of the USD Tuesday Morning as the USD tagged an area that I have been marking as resistance (former support) and it reversed very nicely there. I was hoping for this, because as the USD dropped, Gold and Silver Popped!
.
And the 34 sma is resistance at this point too. This is STILL similar tot he false rally in January that rolled over.
.
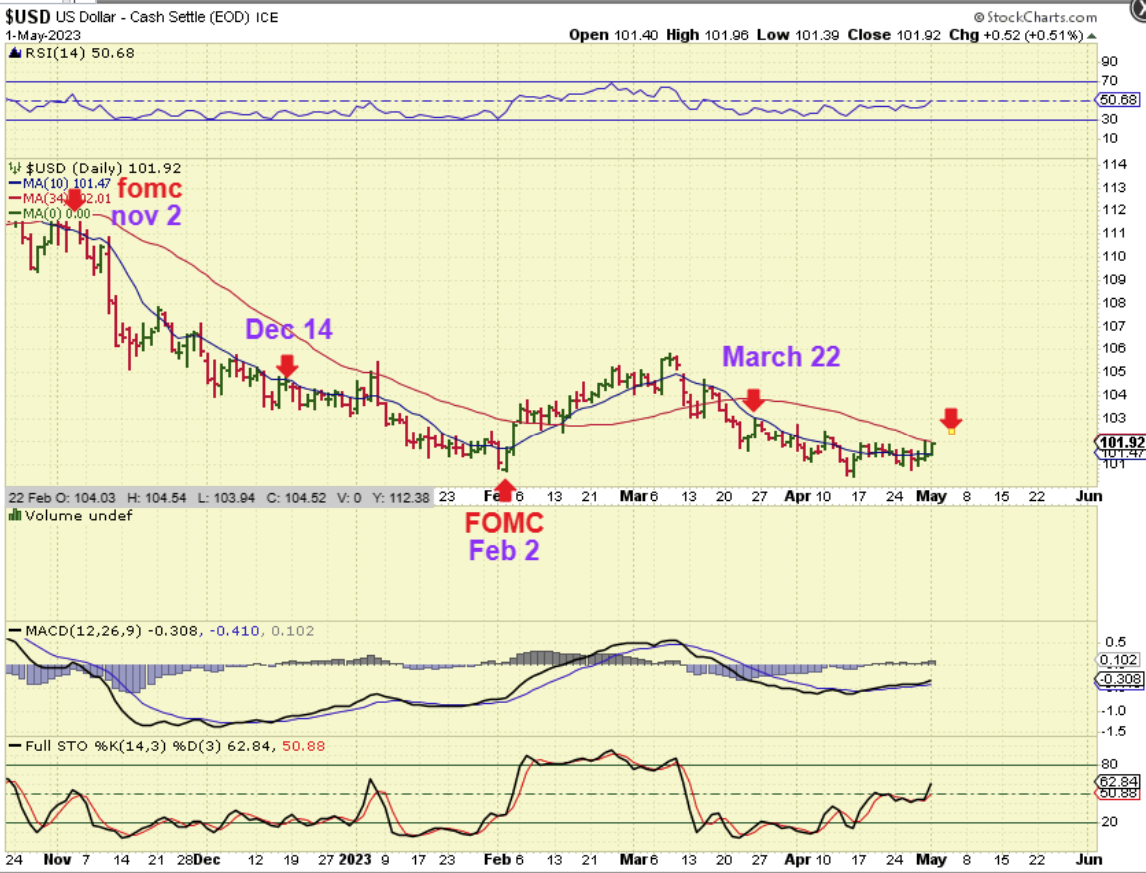
Yesterday I showed that 3 out of 4 Fed Days caused the USD to drop and Gold to rally.
.
THE USD popped and dropped on Tuesday, and Gold and Silver reacted as expected = Rally. You will see as we go through the report that I think that THIS IS THE REAL MOVE. This is how Gold acted with the last Bank failure, but now we have a low in the day 33 area and we are due for a move higher too? That is a bullish set up heading into the Fed. So let’s go to the charts!
.
Let’s do ourselves a favor: Let’s take a look at the Gold chart and ignore Bank Failures, Rate Hikes, Fed Meetings, Debt Ceiling, etc. All of those things might actually be Bullish for Gold, right?, But let’s just look at the Gold chart as though nothing is going on economically and see if it looks bullish.
.
GOLD –
1. After each ‘consolidation’ Gold gets oversold and Pops.
2. Each low has a small double bottom and this one does too (the low was days ago).
3. Price danced around the 34 sma and after it Popped, it rallied. Therefore, this looks ready to rally after the Fed meeting.
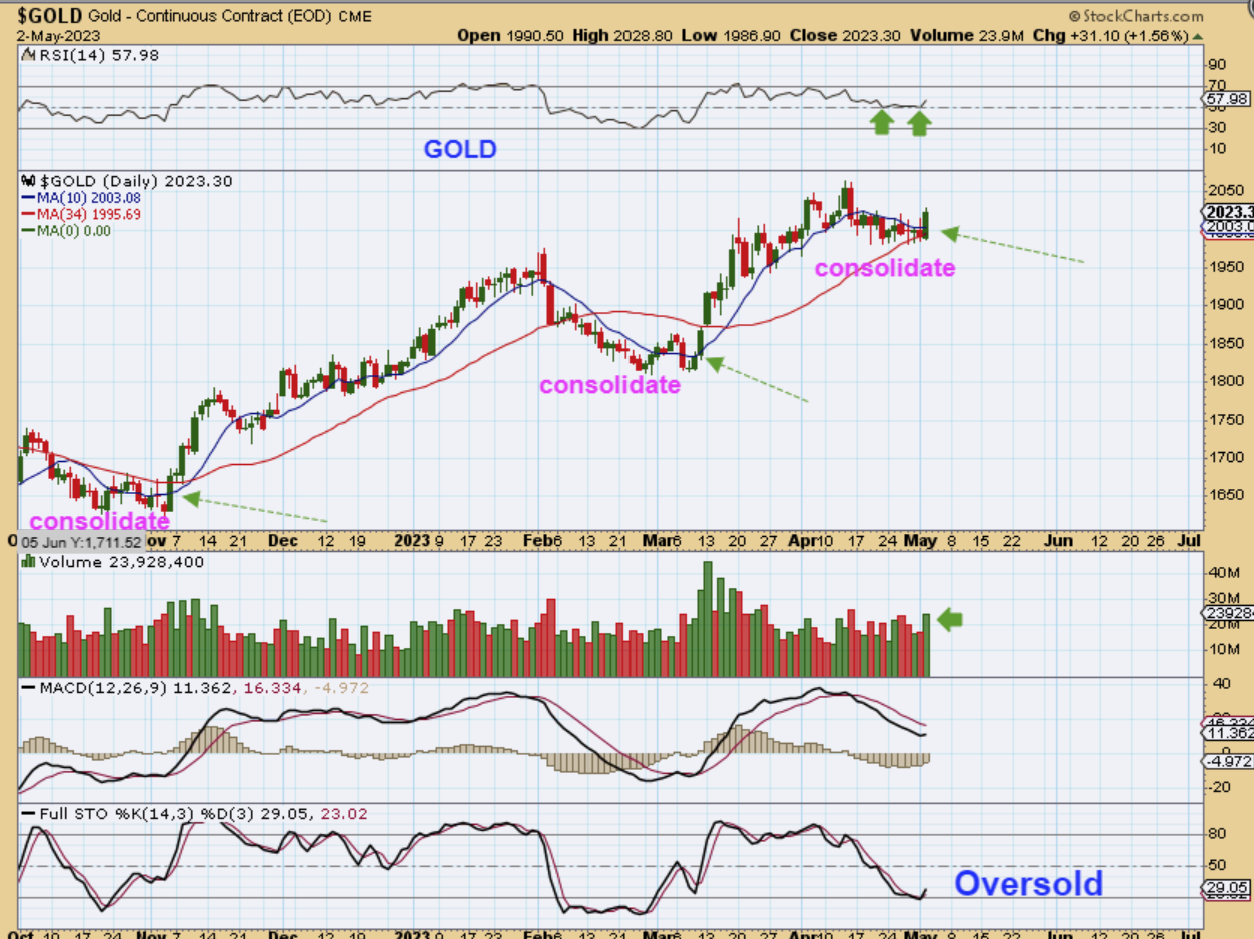
4. P.s. Now I can mention that a bank failed, rates are being hiked, there is a fear of the Debt Ceiling limit being reached by June now. These can be bullish catalysts for Gold & Silver.
.
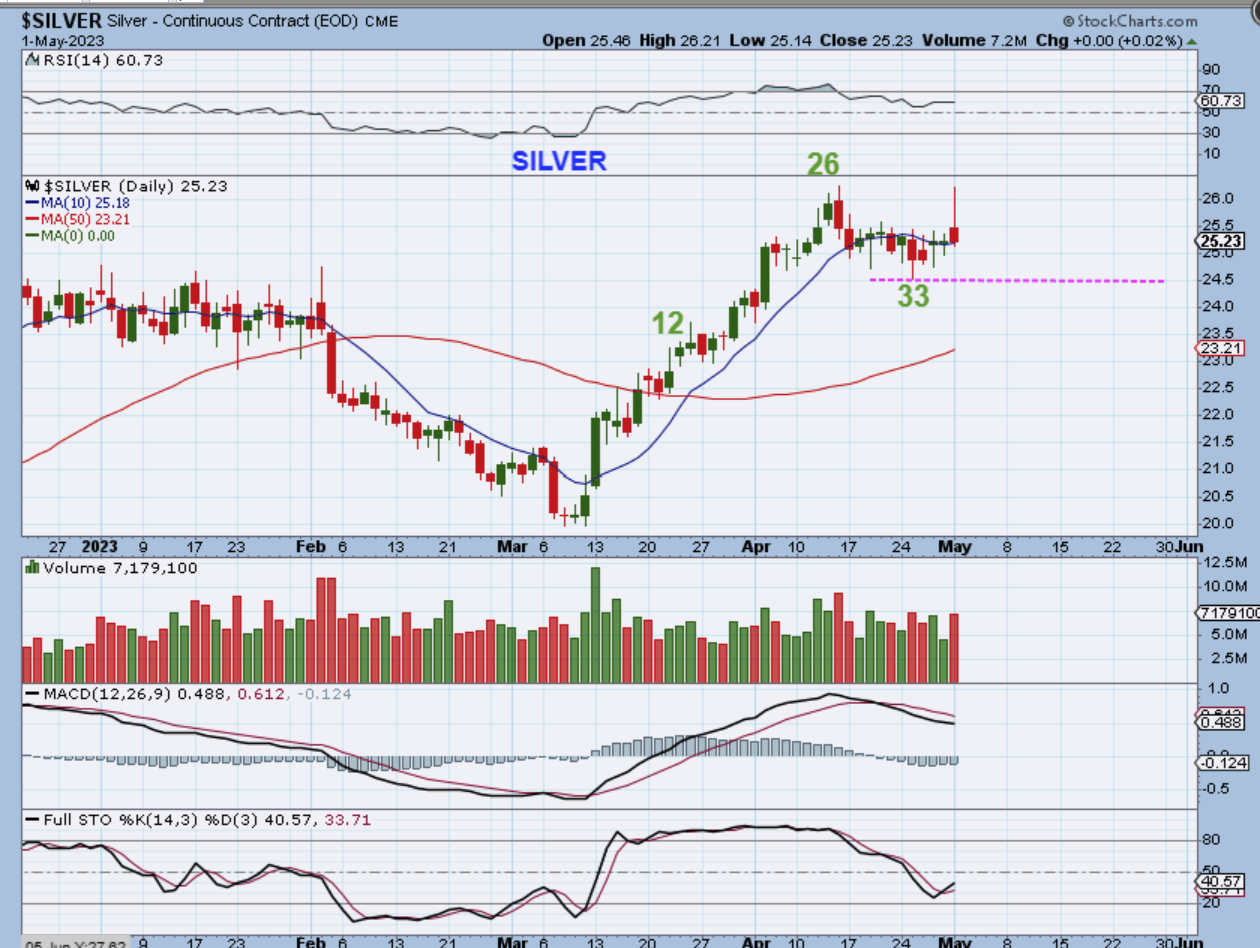
Yesterday with this chart of Silver I showed that we had a day 33 low, likely a dcl, but also a reversal candle on what would be day 4. HOWEVER…
.
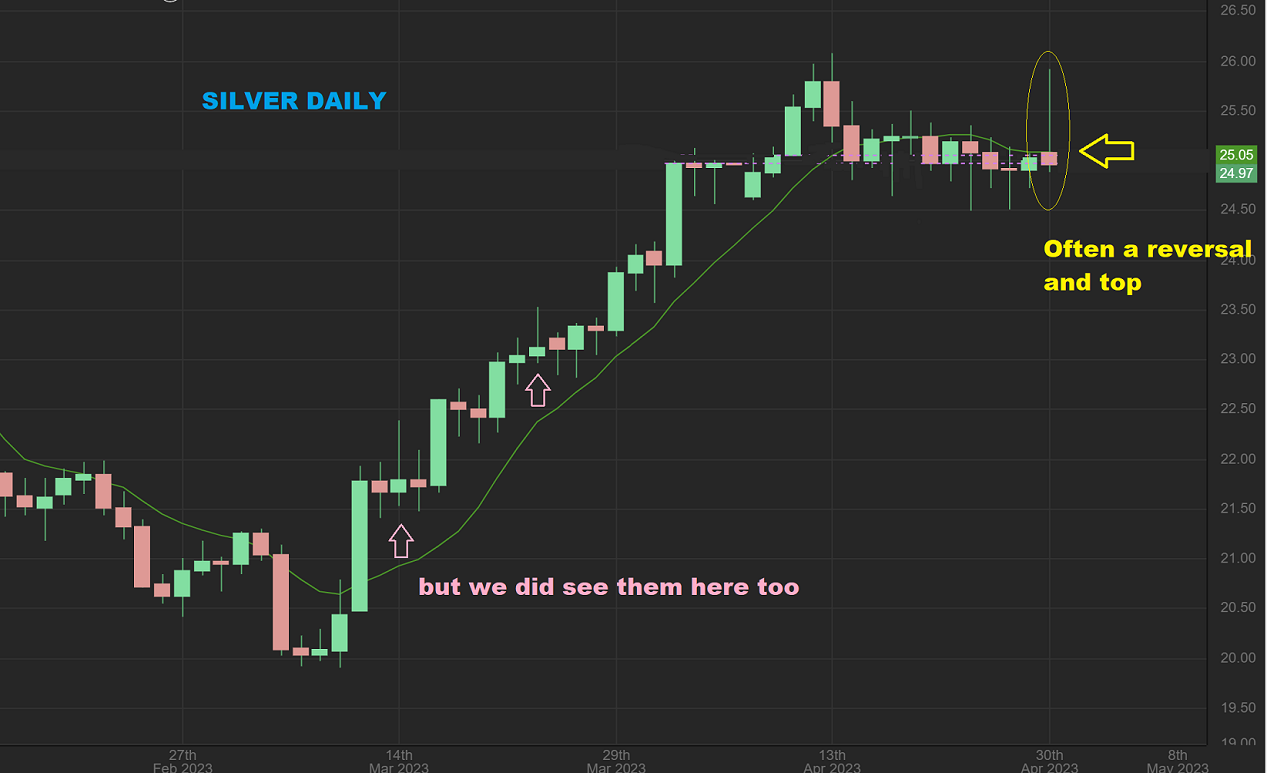
I also pointed out this:
.
My pink arrows are pointing to similar reversal candles, but it didn’t lead to a lasting sell off. Silver simply paused. Silver still could have that day 33 dcl in place heading into the Fed.
.
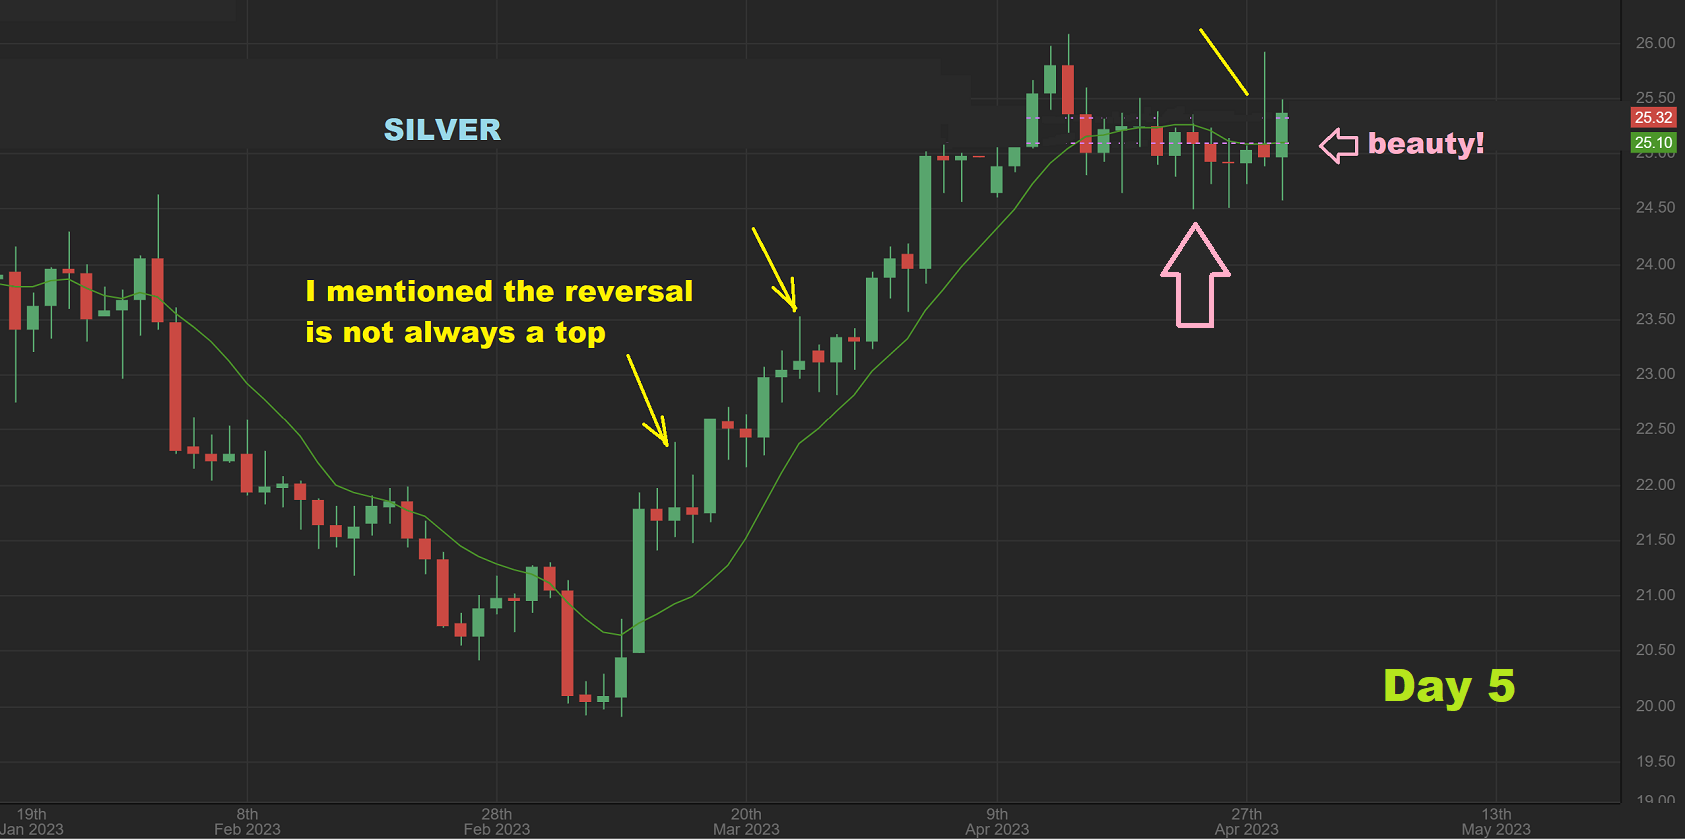
And on Tuesday SILVER was a Beauty, the day after that reversal candle. That day 33 low remains in tact and the set up is bullish heading into the Fed mtg. A stop under day 33 would still have you in the game.
.
And in yesterdays report, I pointed out that I had to sell my leveraged GDXU, Just in case this sells off, but I then said:
.
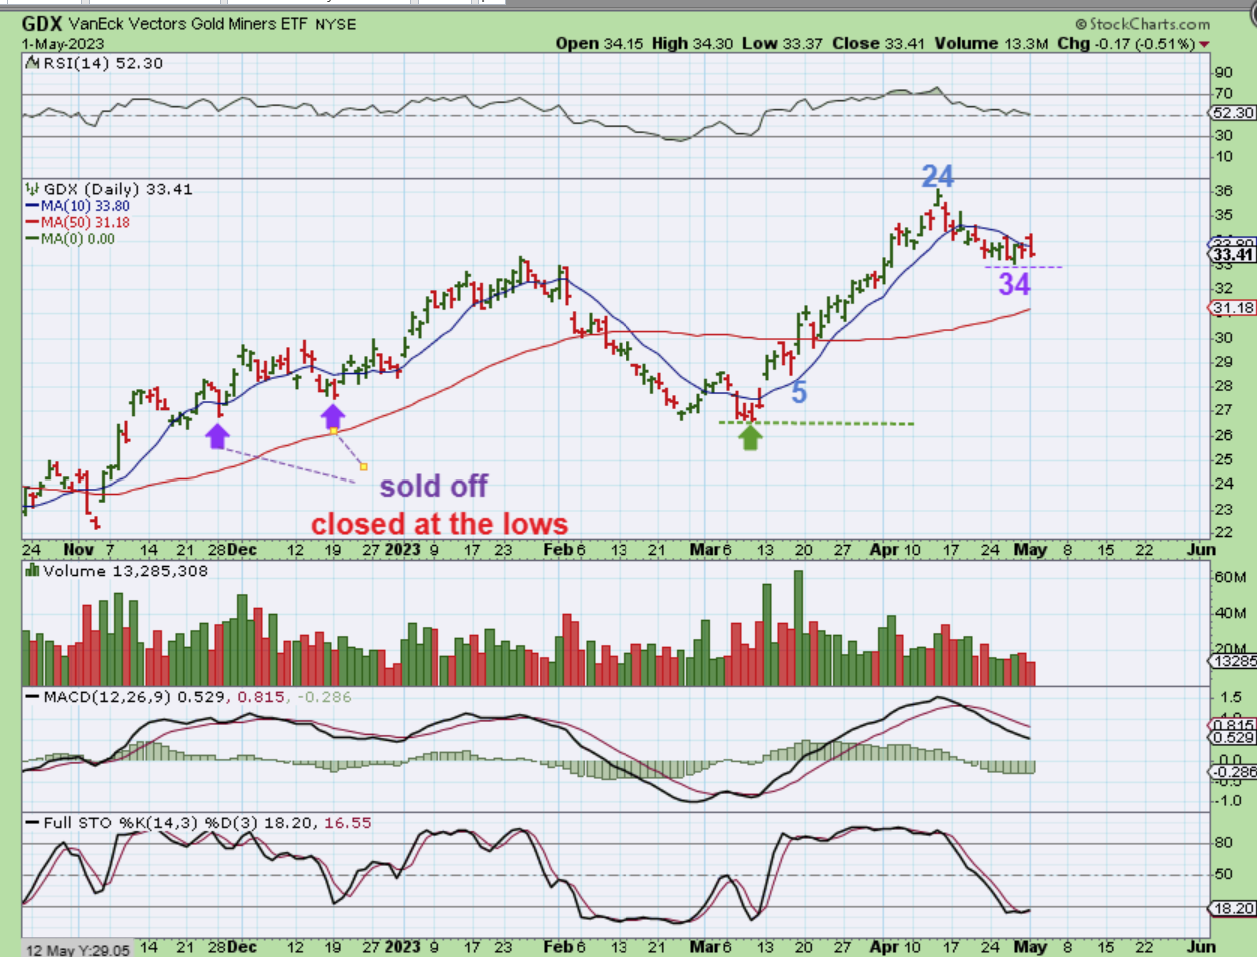
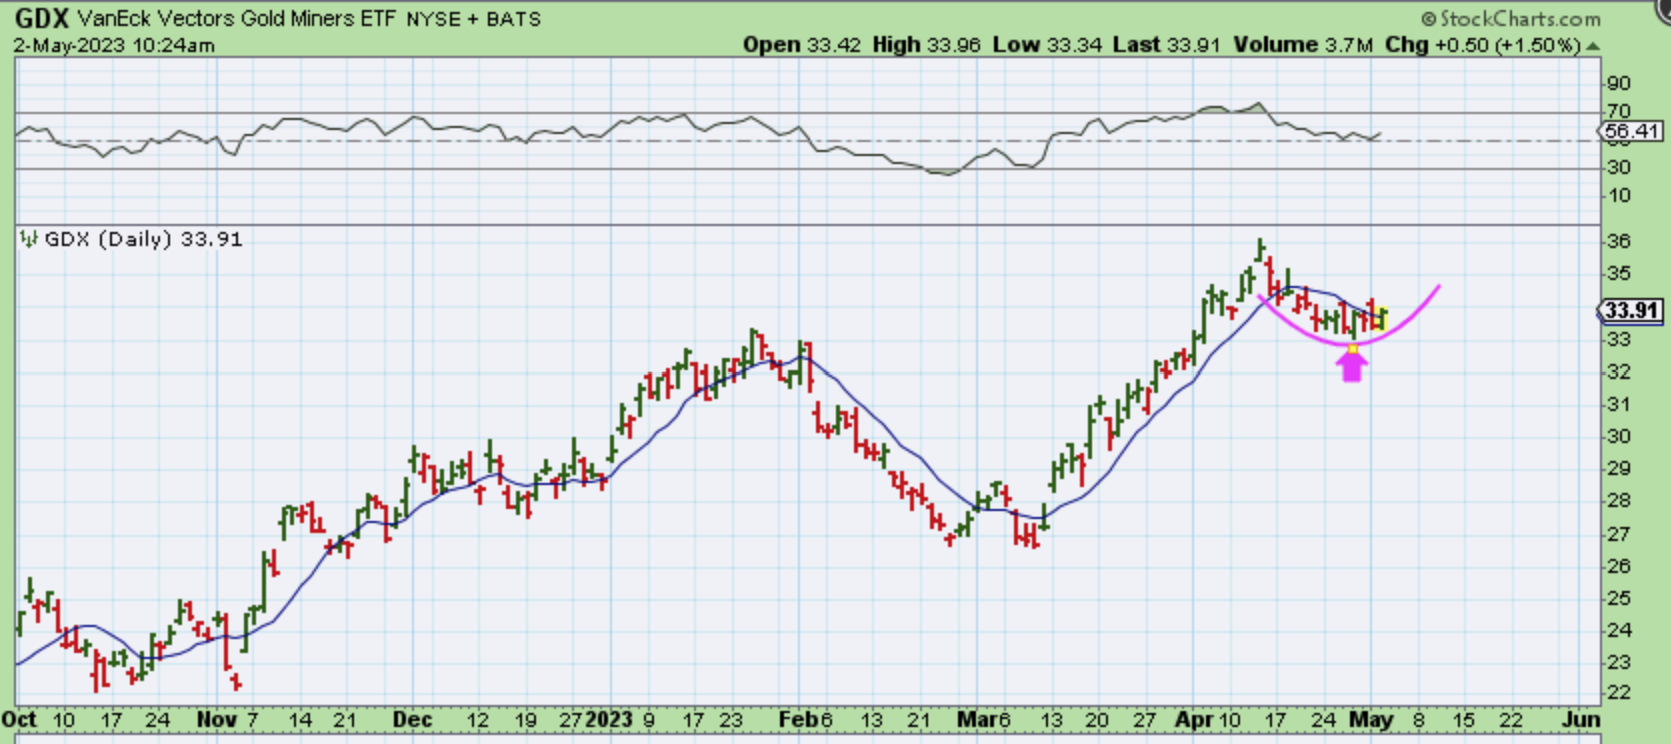
“This GDX chart remains bullish, and I would expect it to rally higher soon (after the Fed mtg?). It is oversold.” I pointed out that we’ve seen how past drops (purple arrows) did not have follow through.
.
10:24 a.m.: Well, within 1 hr of trading, that drop in The GDX did NOT have follow through. It was breaking back over the 10sma and again, this set up is bullish. We have a rounding bottom forming…
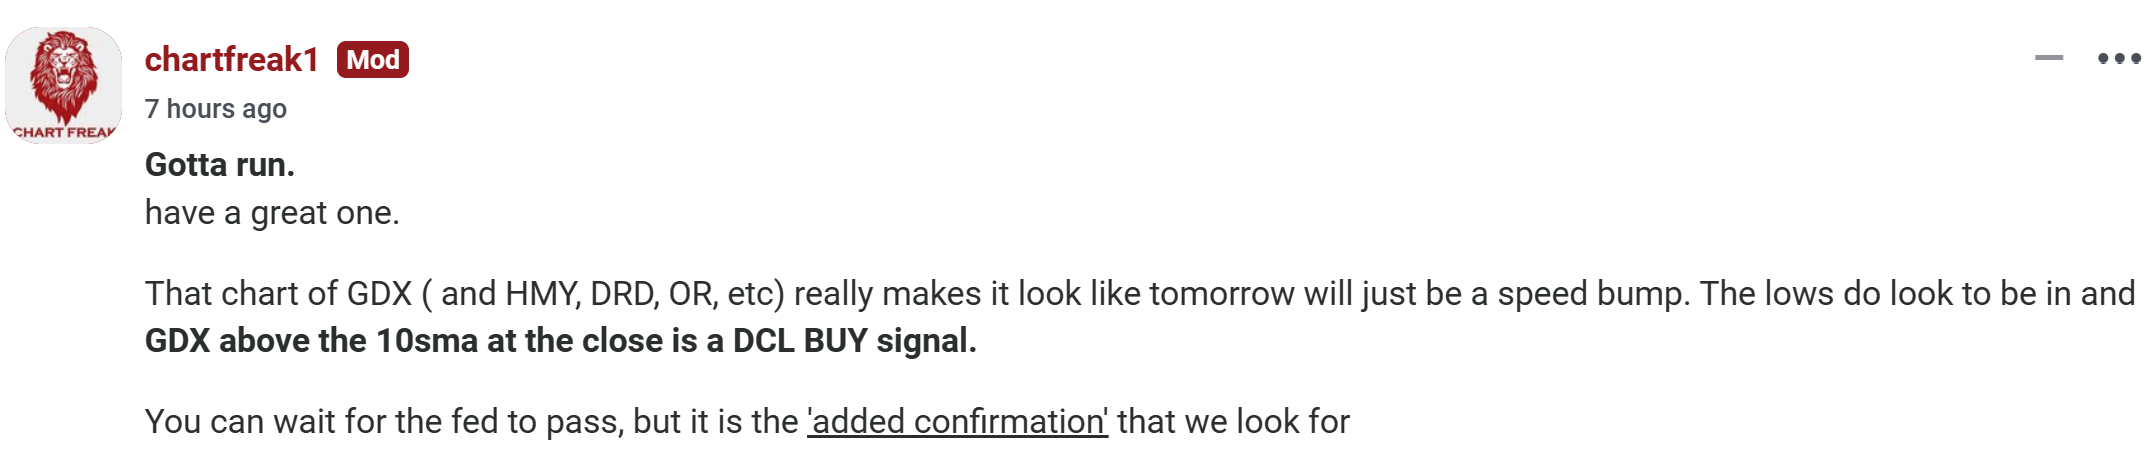
And I posted this in the comments at the end of the day for GDX : This is a BUY closing over that 10sma.
.
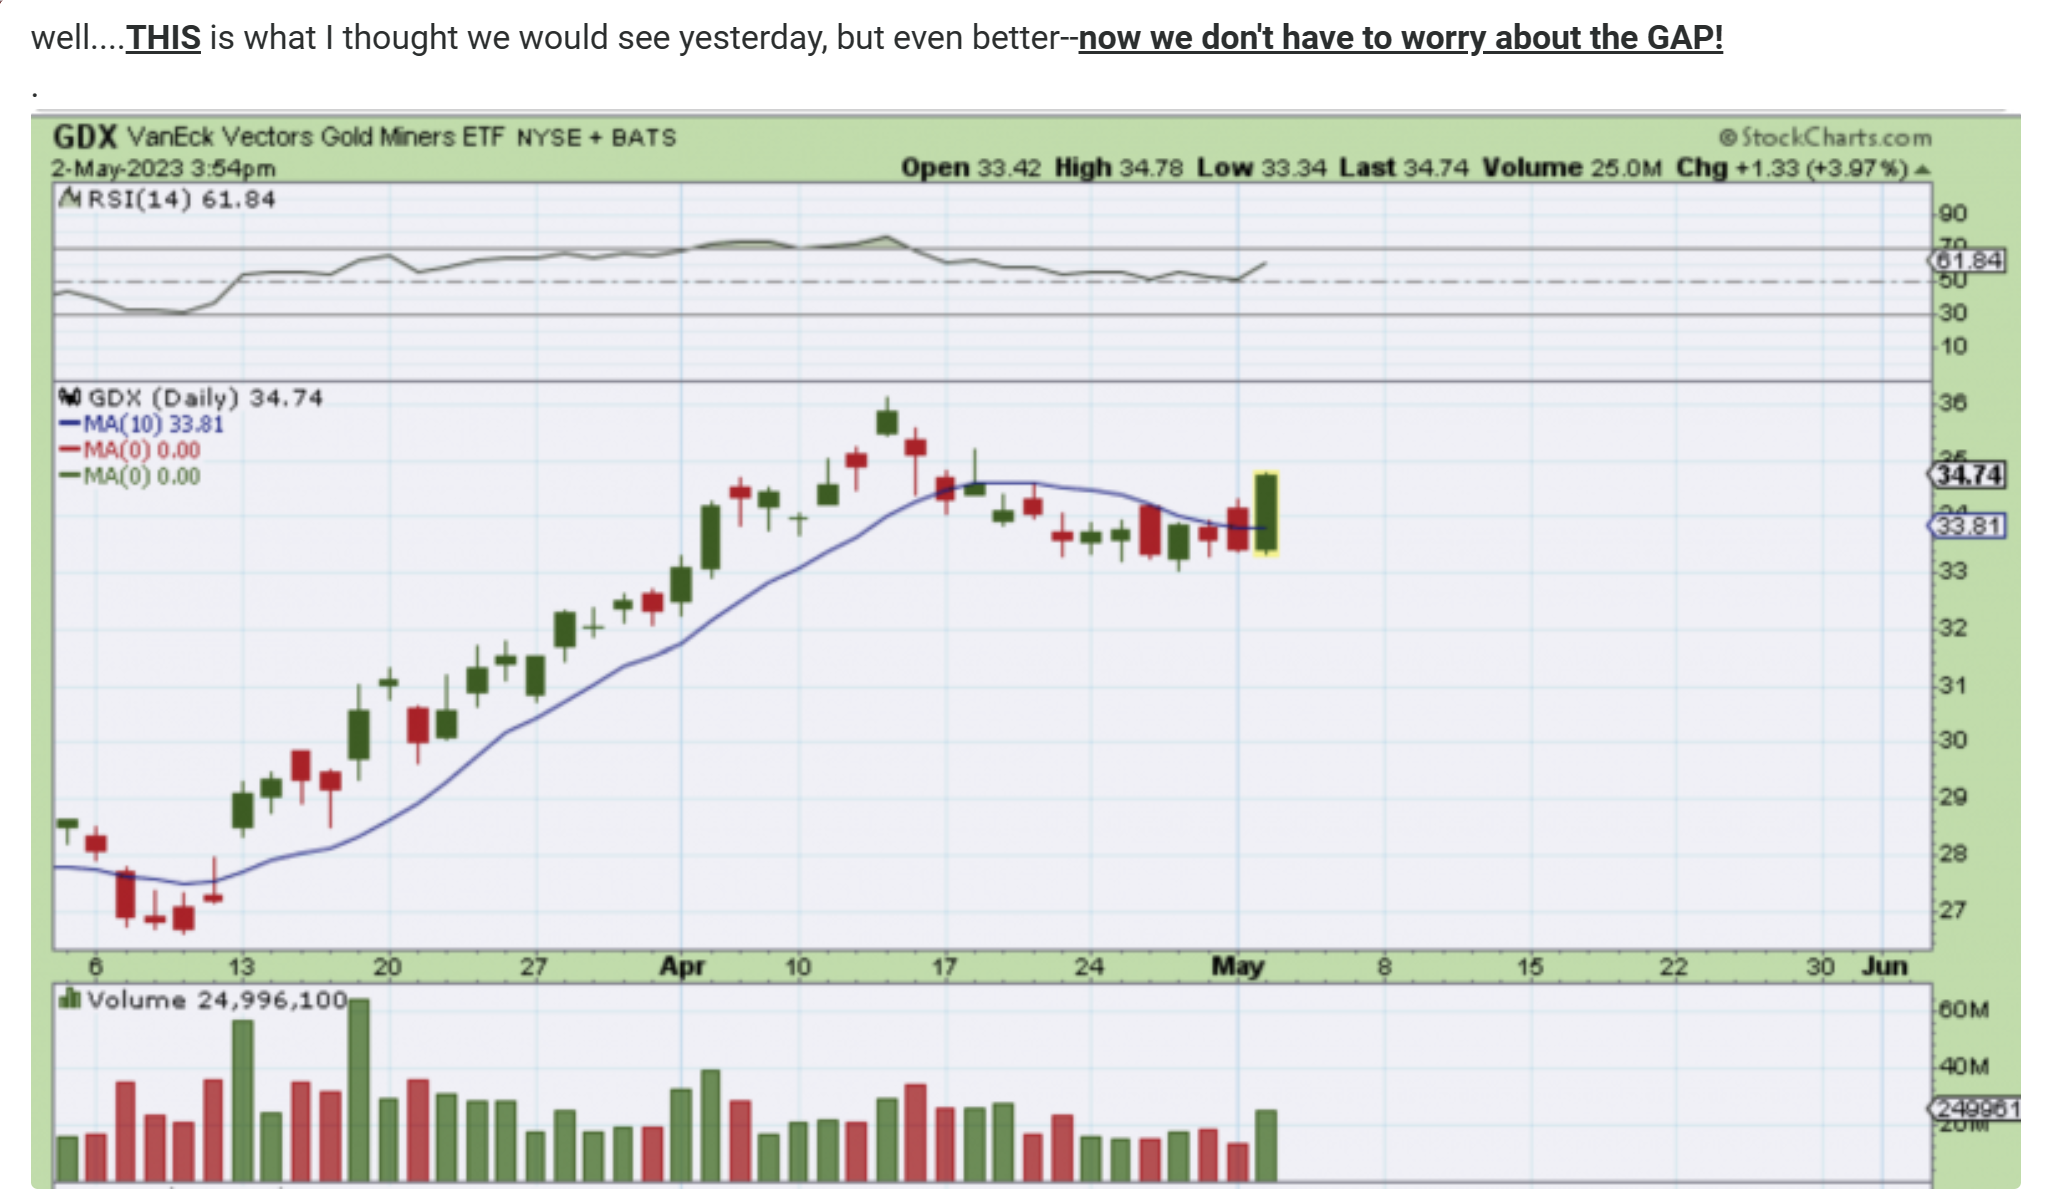
That was the confirmation that we look for to give us added confidence in a dcl. I wrote before I left for the day that we have a dcl ‘buy’.
.
So you can wait until the Fed day passes, since they can be very volatile, but we do look to be set up bullishly with a close over the 10sma. These lows should hold up despite any volatility. I mentioned some ‘Miners’ that looked really bullish too. Let’s take a look…
.
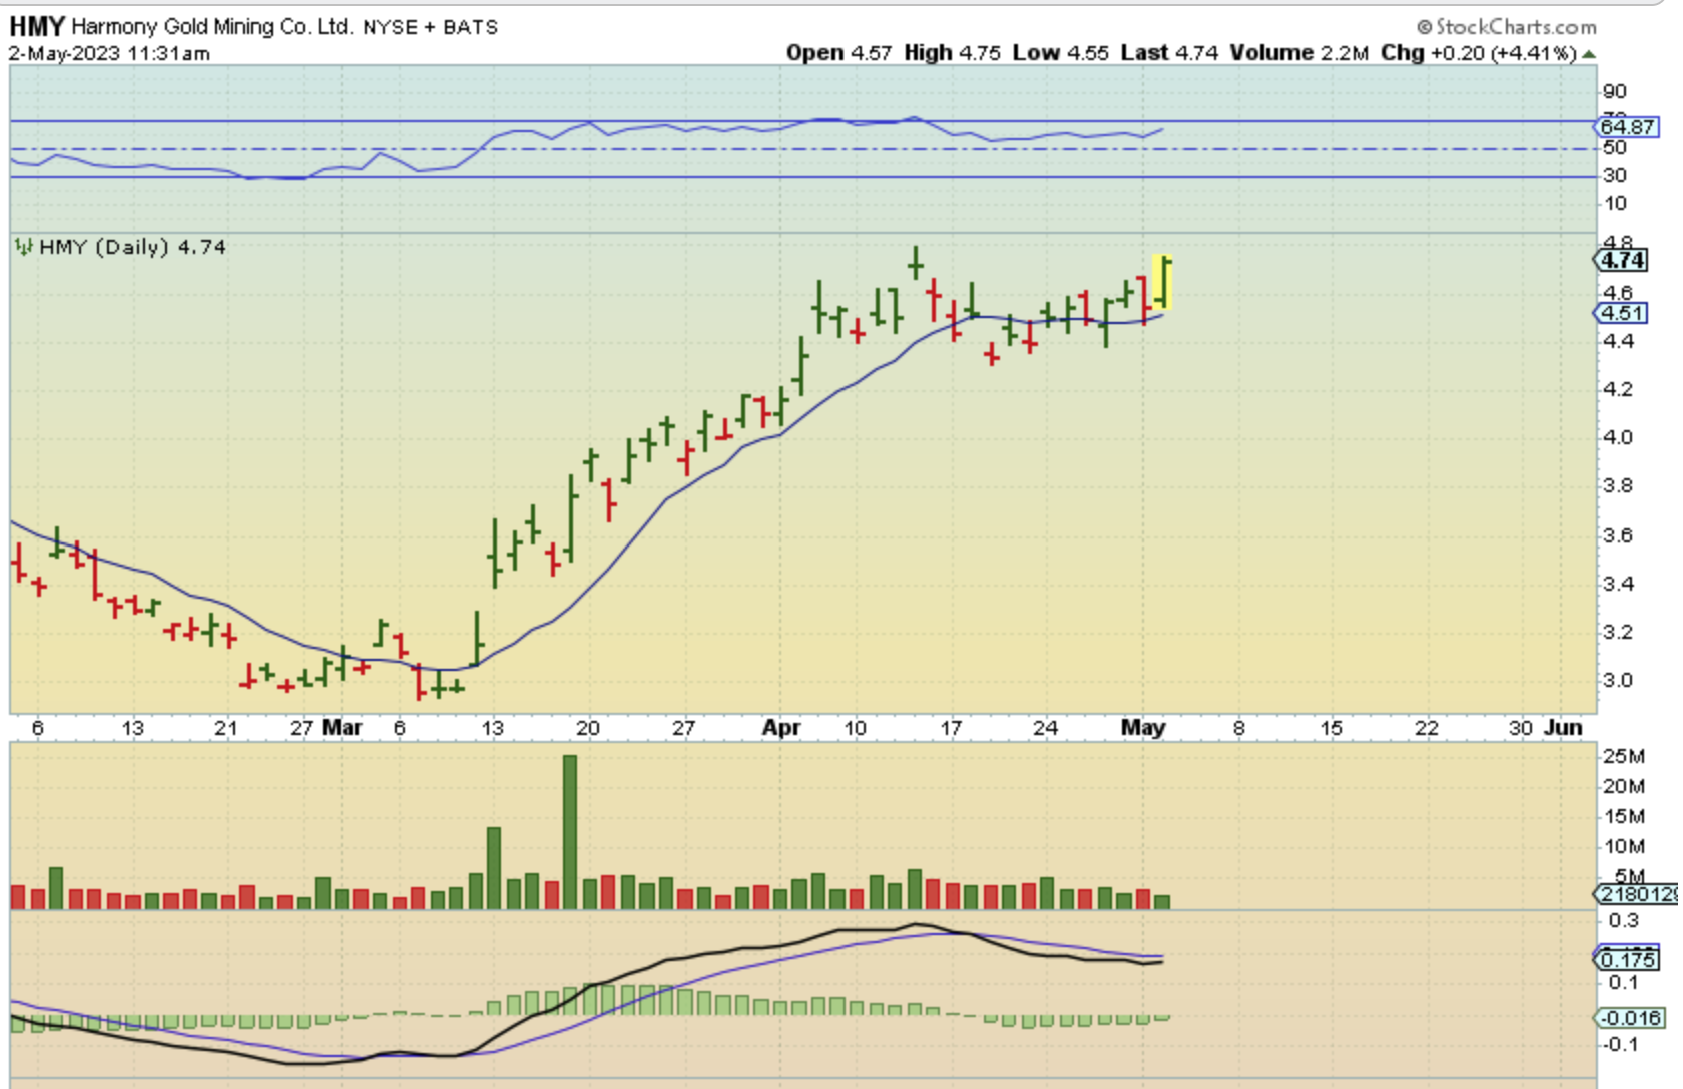
I actually posted this at 11:30 a.m., but even with Tuesdays drop, stocks like HMY, OR, DRD, etc are still trading up near the highs. That is super bullish and I have been pointing these out because you can own these and feel minimal pain on the dips. HMY then closed yesterday up at NEW HIGHS, up over 7%.
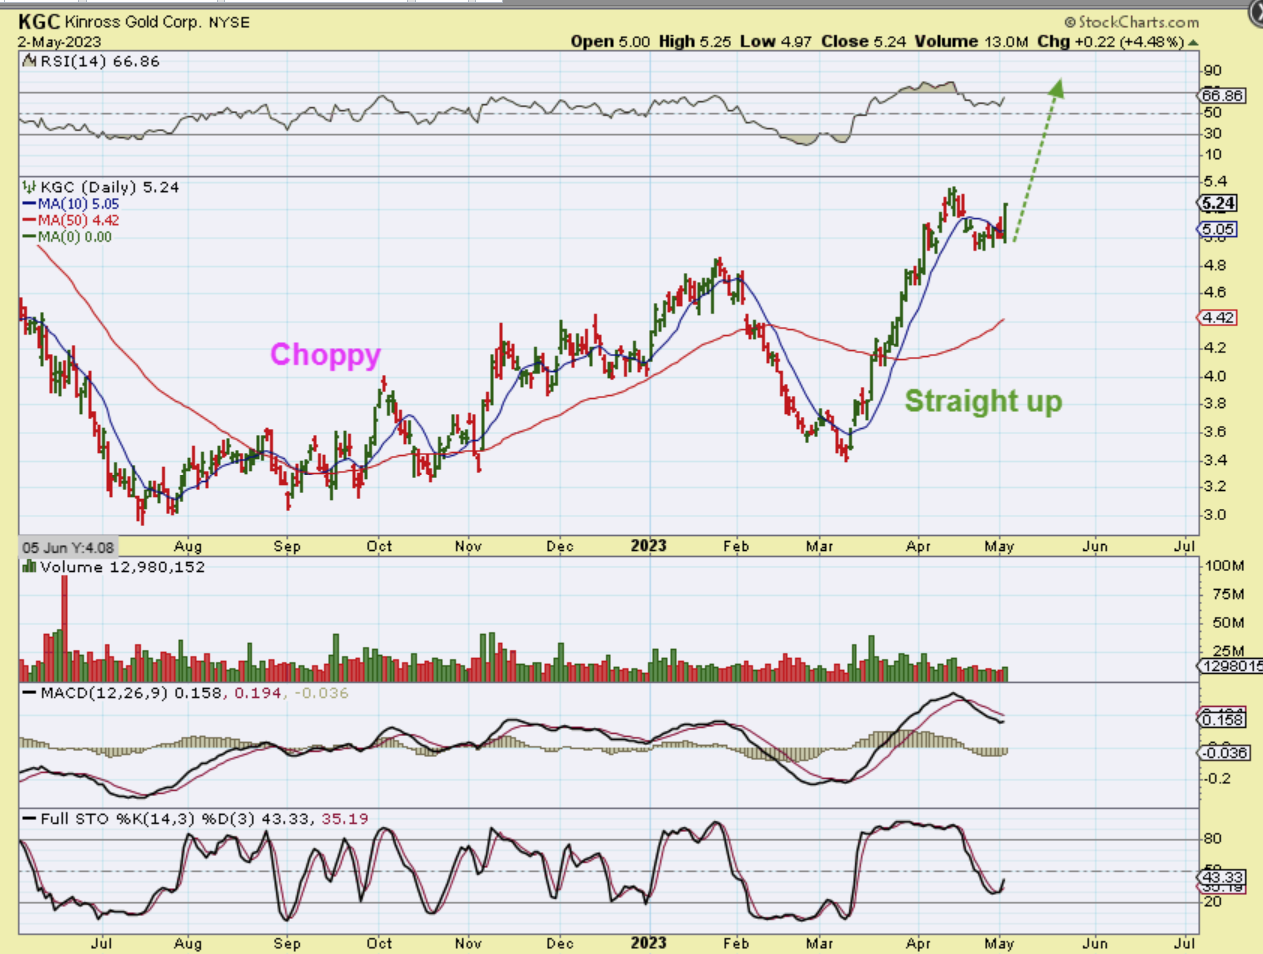
KGC is not at new highs yet, but let me ask you something.
Do you see a difference between the first Intermediate Rally from August to January, and then the first daily cycle in March? That March rally blew the Aug – Jan rally away, and the next leg could be similar. Straight up.
.
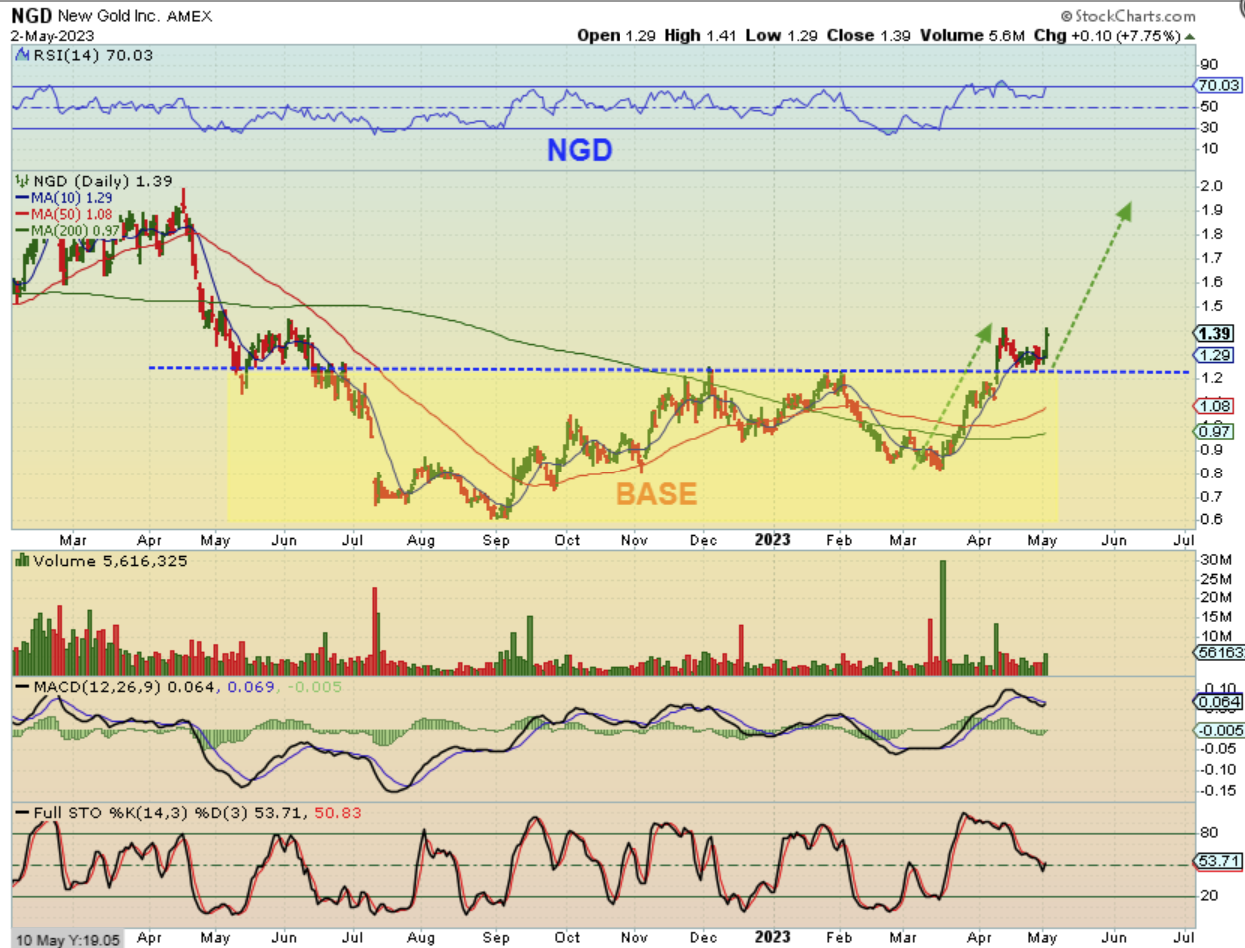
NGD formed a choppy base during the first Intermediate Cycle. In other words, it lagged. Then that March rally was also a sharp one, so this back test of the base is a buy.
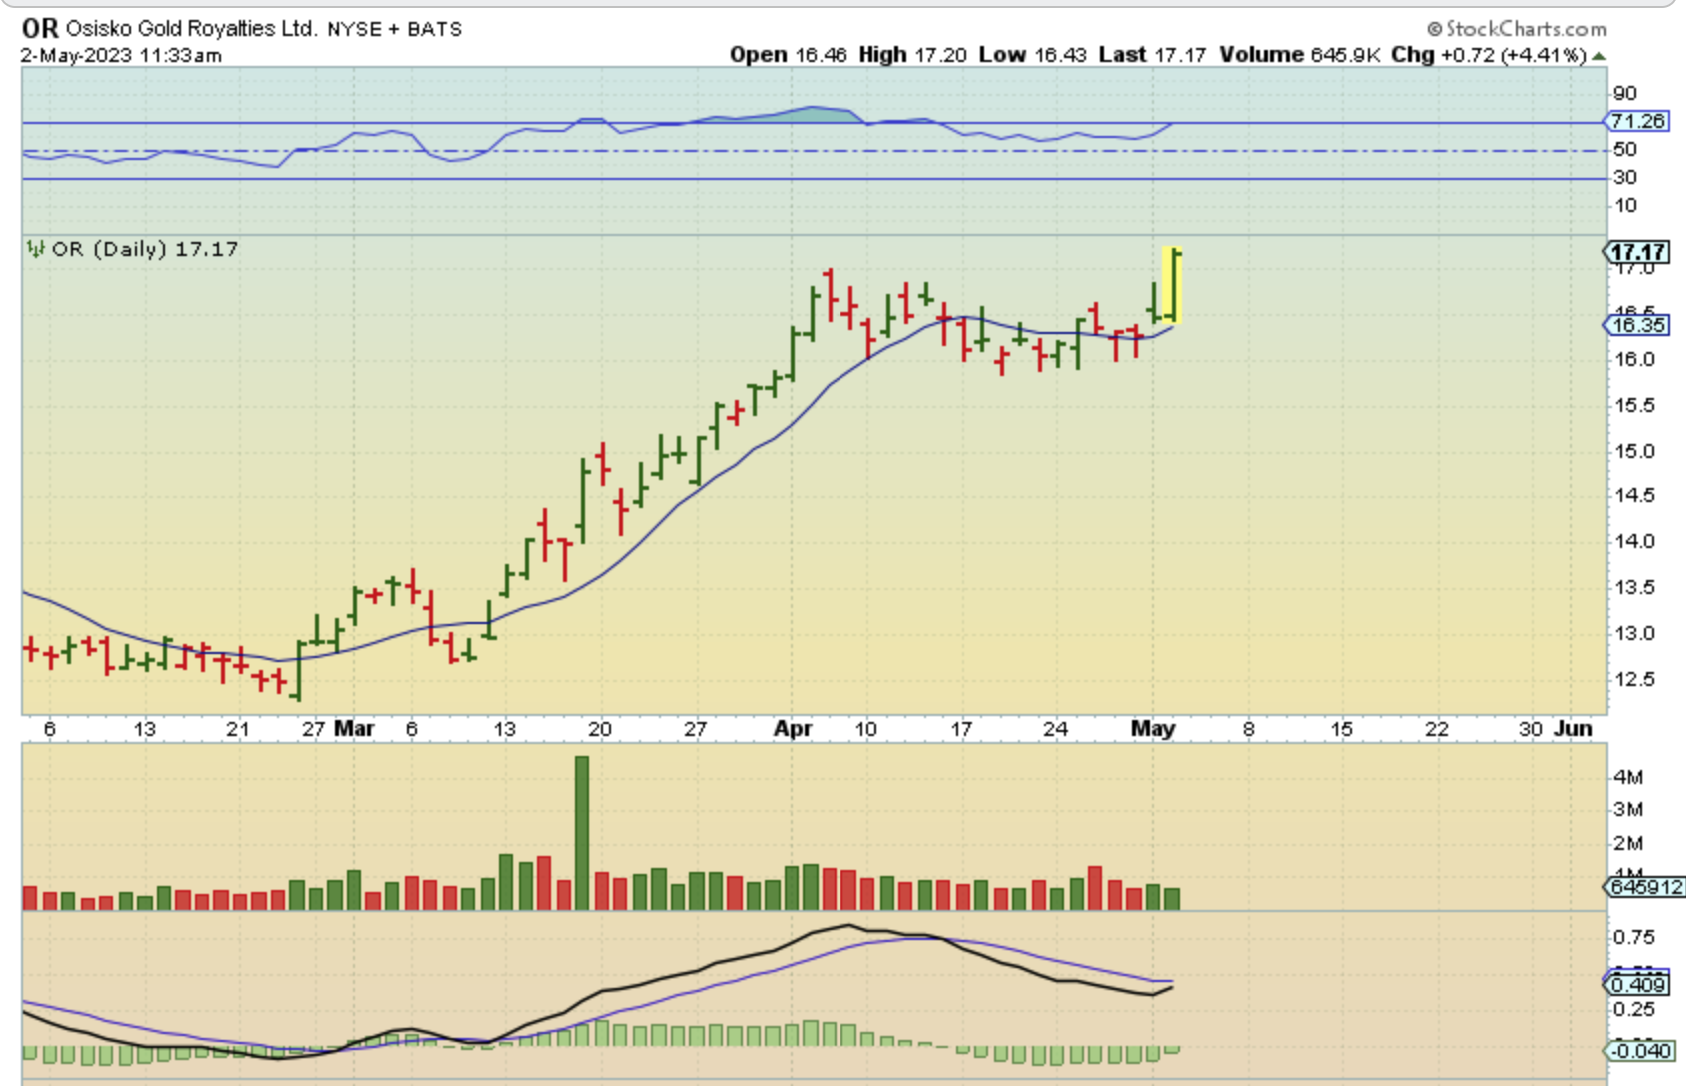
I captured this chart of ‘OR’ as it broke to new highs 2 hrs into trading. I have pointed out just how strong this has been for a while now. That pullback was simply a sideways churn. This looks ready to go.
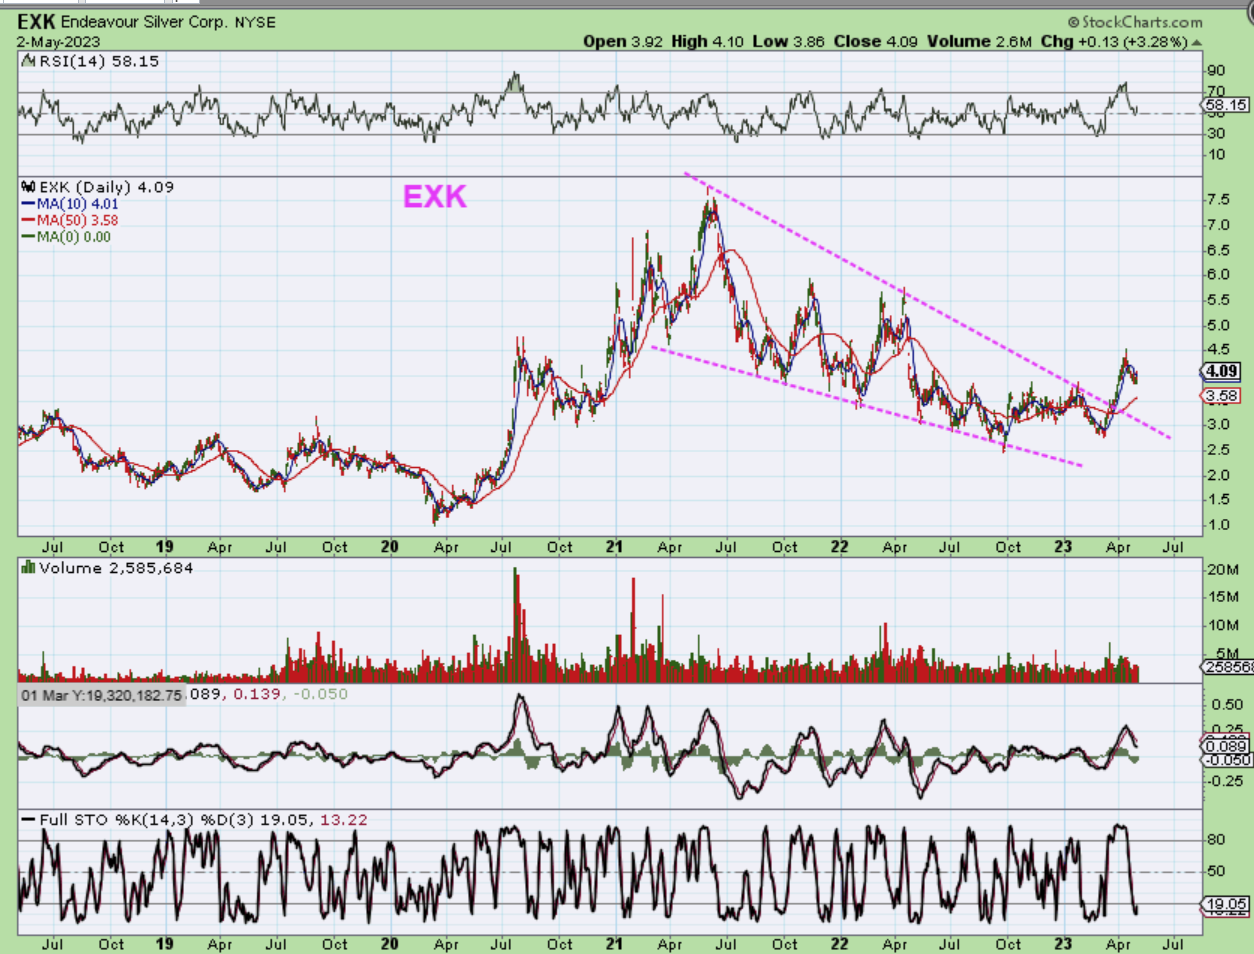
Silver stocks have lagged a bit, but Silver really perked up on Tuesday. Stocks like EXK, AG, HL, etc may be ready to go too.
.
EXK pulled back to a support in the form of a back test of the base breakout.
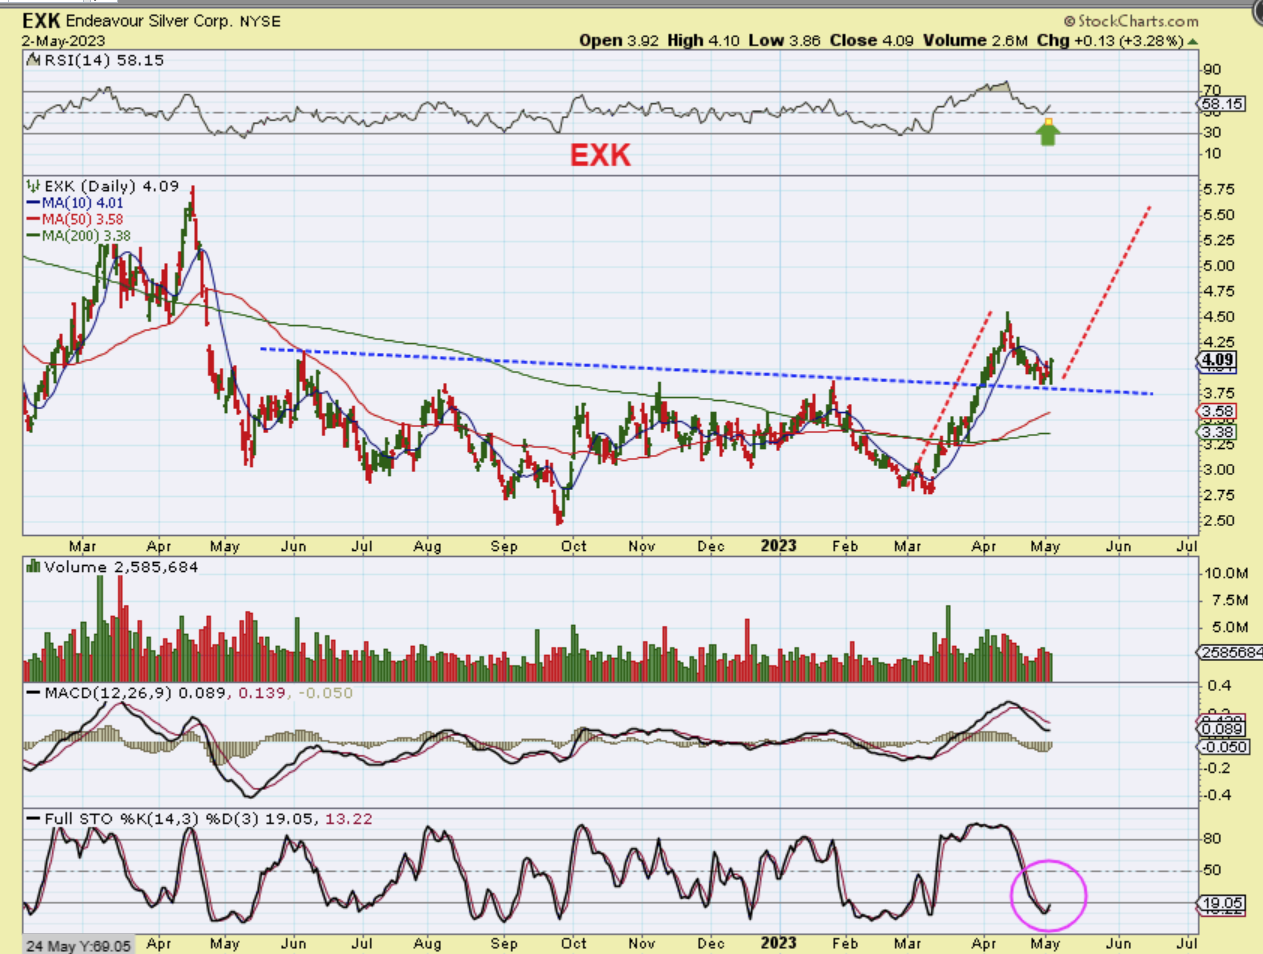
EXK – Most of the Silver stocks are really lagging in the bigger picture, so I’m hoping for a stronger Silver rally this time to make up for that. For EXK, the downtrend was broken with that March run up.
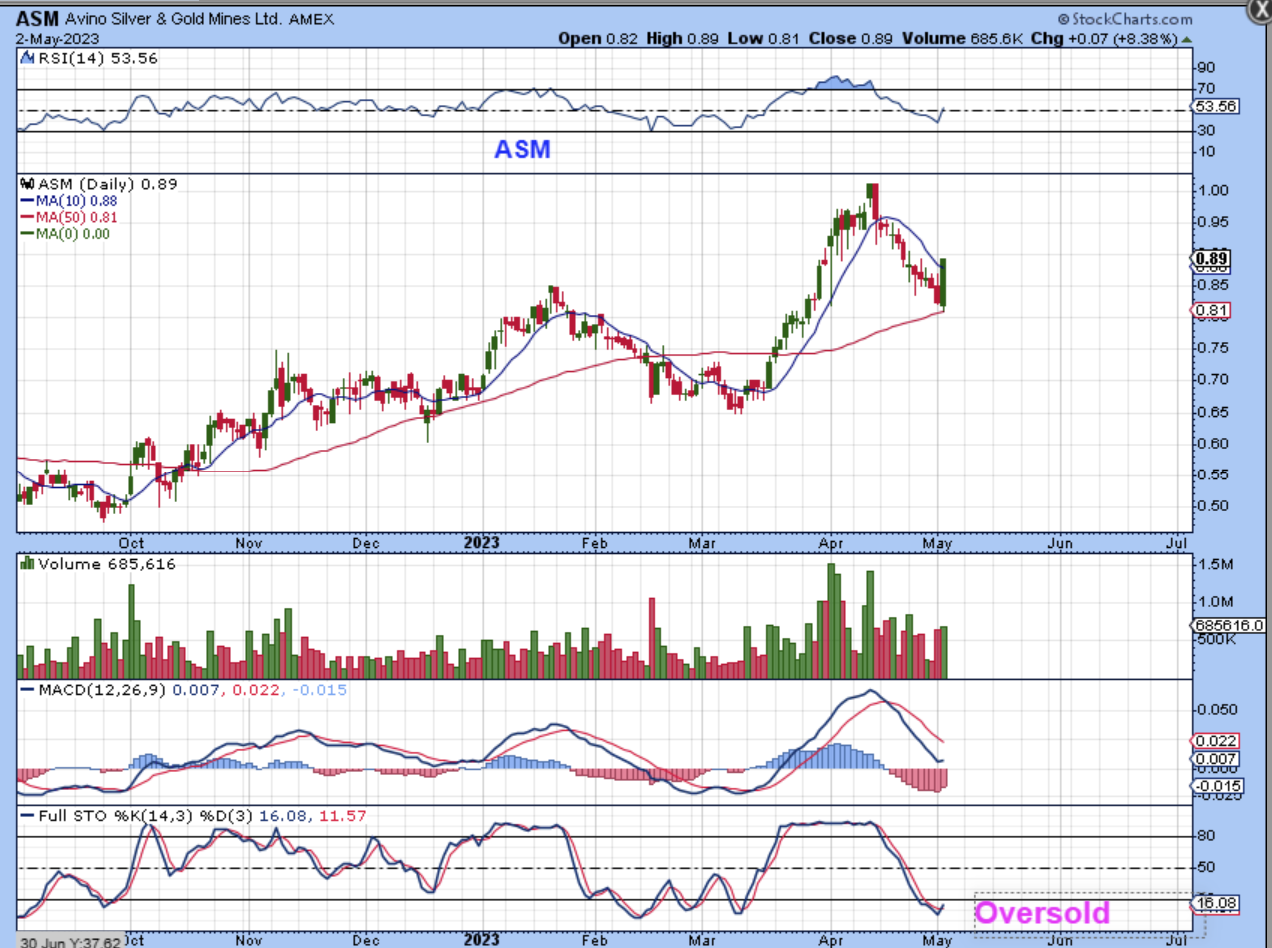
ASM became oversold during the recent pullback and reversed right at the 50sma support. This is a buy.
.
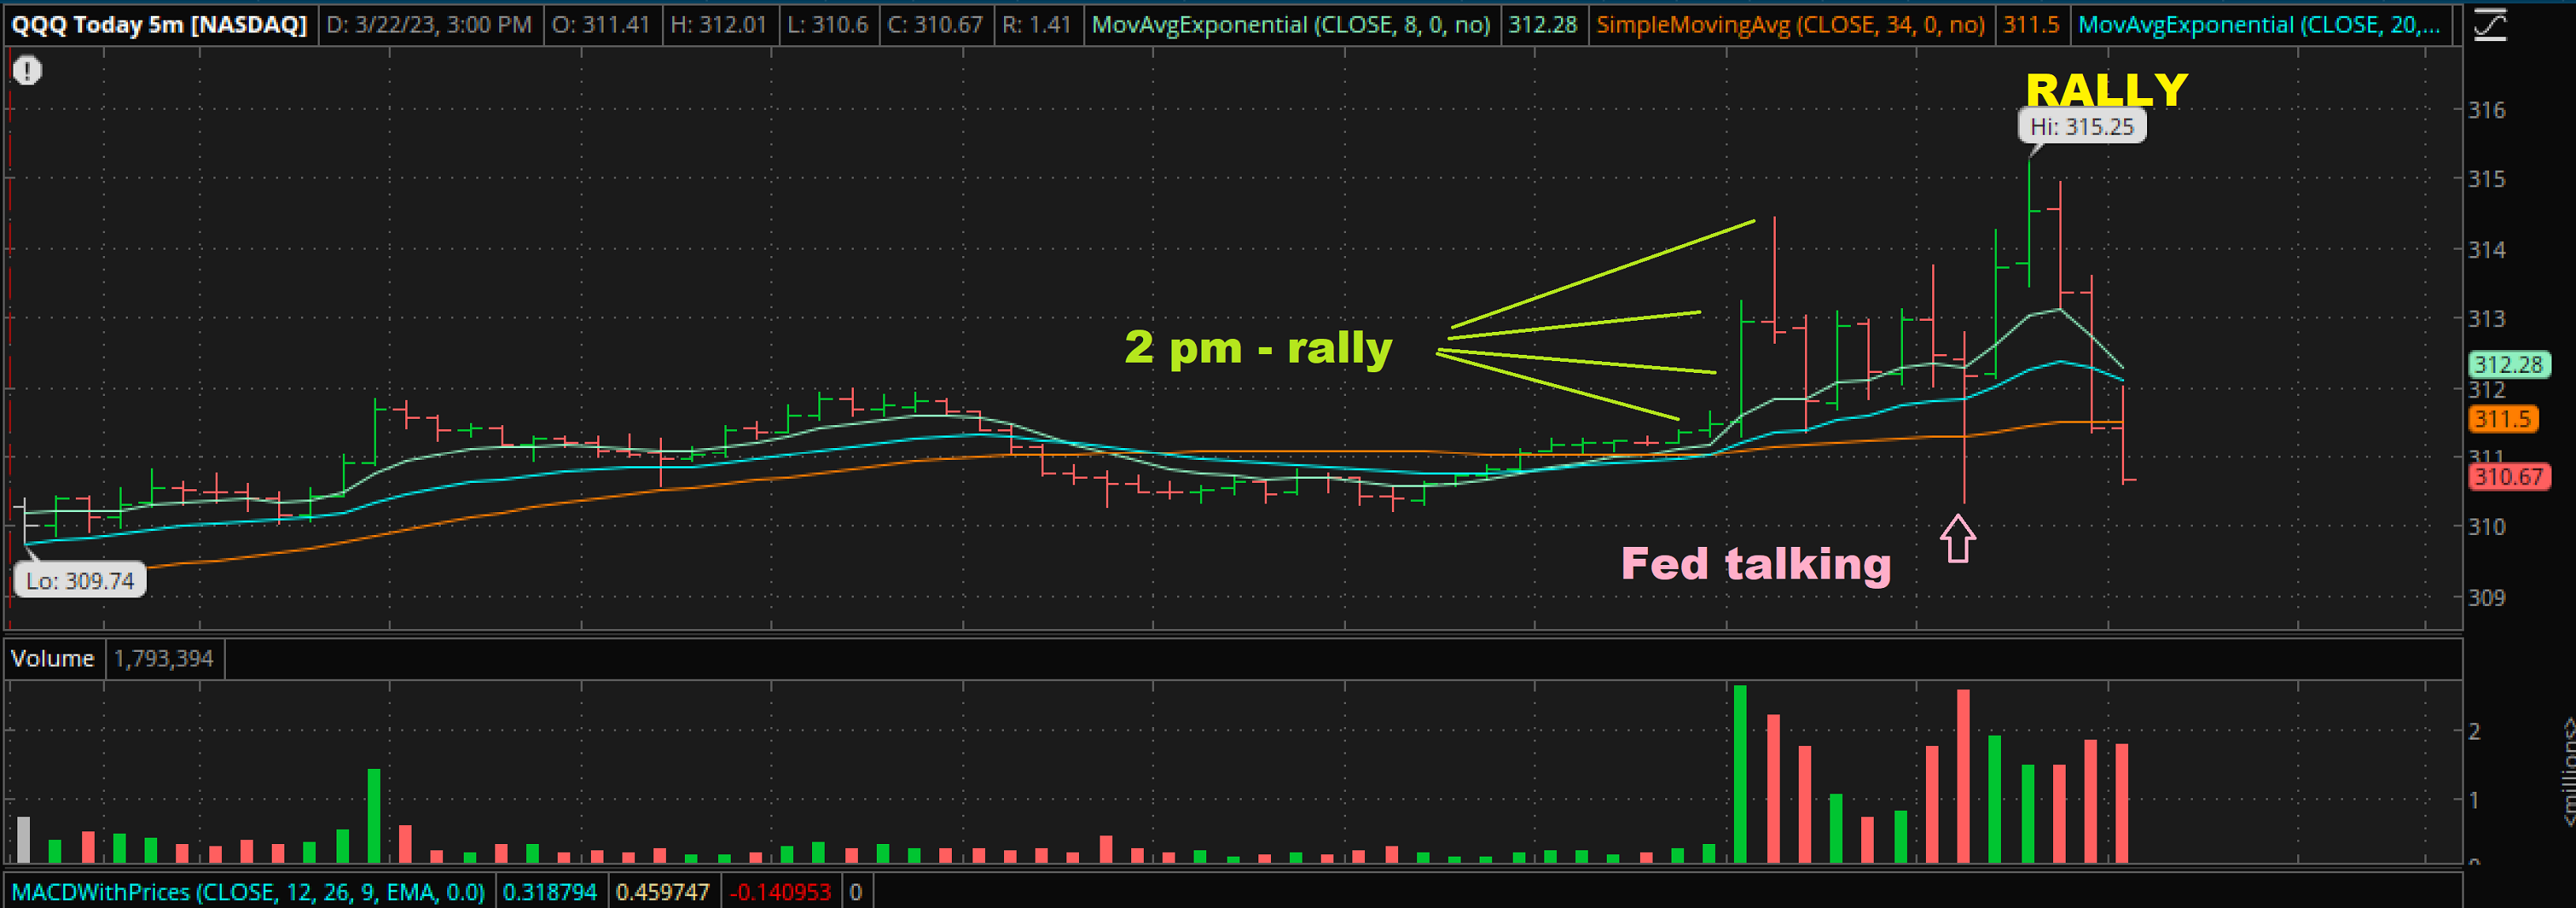
So we find ourselves at the FOMC Meeting and whether they do a rate hike or not, we know that these days are ALWAYS extremely volatile. I have repeatedly shown intraday charts of the 2 p.m. – 4 p,m. hours when the decision is released and then the speech is given at 2:30 with the question-and-answer period that follows.
.
Let me show you some older charts (intraday) of the General Markets and Gold, just so that you can see how volatile it gets. This is the QQQ. We saw a rally at the fed decision, then he spoke and things spiked down. Then it rallied to a new highs during his speech, and finally it dropped back to the spike down lows. This is nauseating in real time.
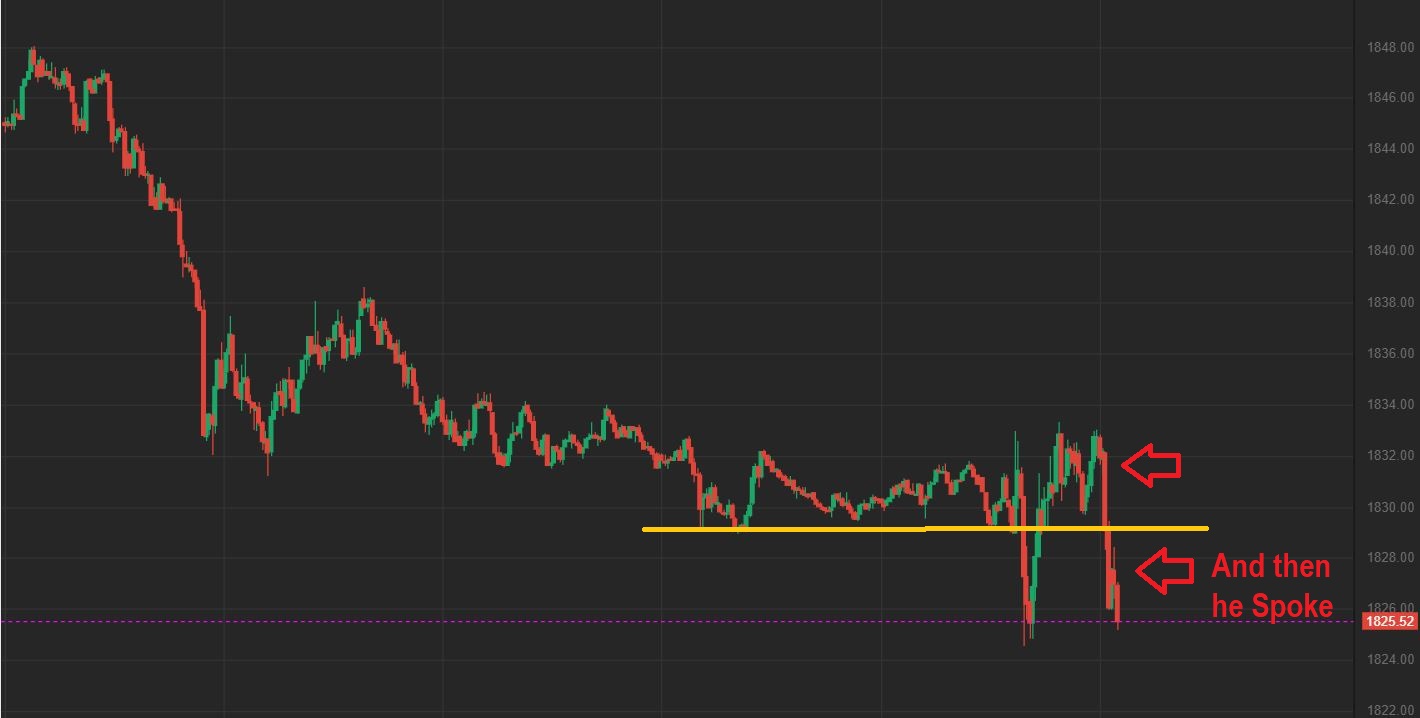
This was Gold during a Fed decision (slam down to new daily lows), it recovered, and then he spoke and it slammed down to those lows again.
.
#1 THIS WAS A FED DAY SLAM DOWN FOR THE GENERAL MARKETS. A CRASH, RIGHT?
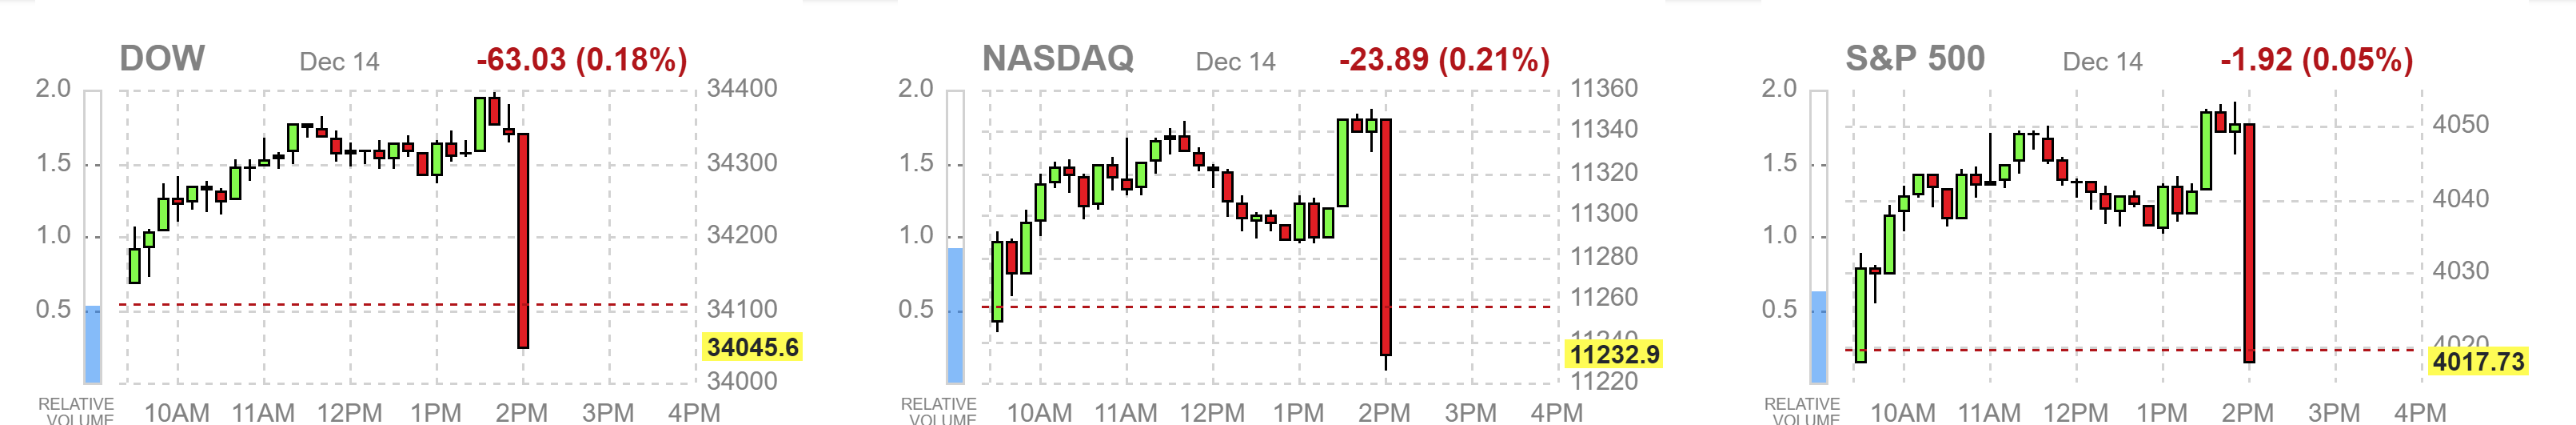
.
#2 We then saw a bounce or ‘pause’, but then it broke down to even lower lows. This looked like a sell off for the Fed day
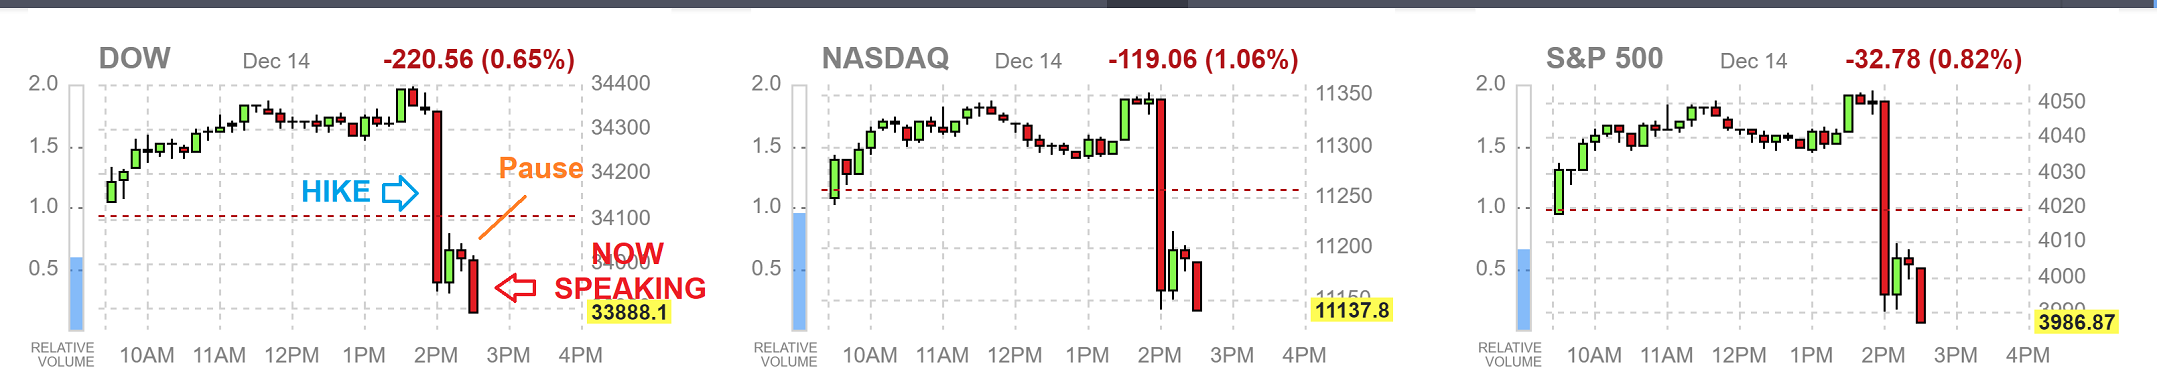
.
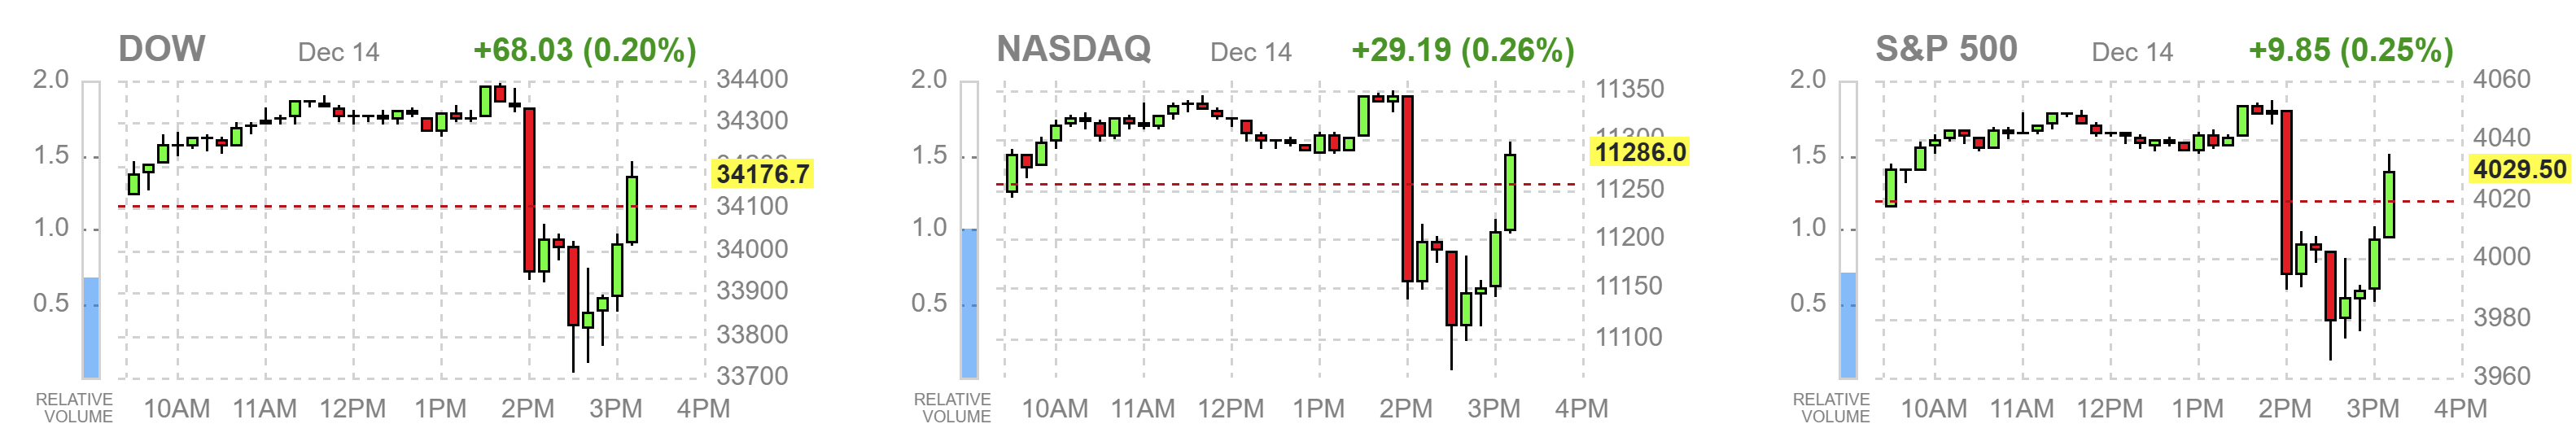
#3. And then the Markets started to bounce back at 2:30 and rallied back up into the close. THESE FED DAYS ARE TRICKY!
.
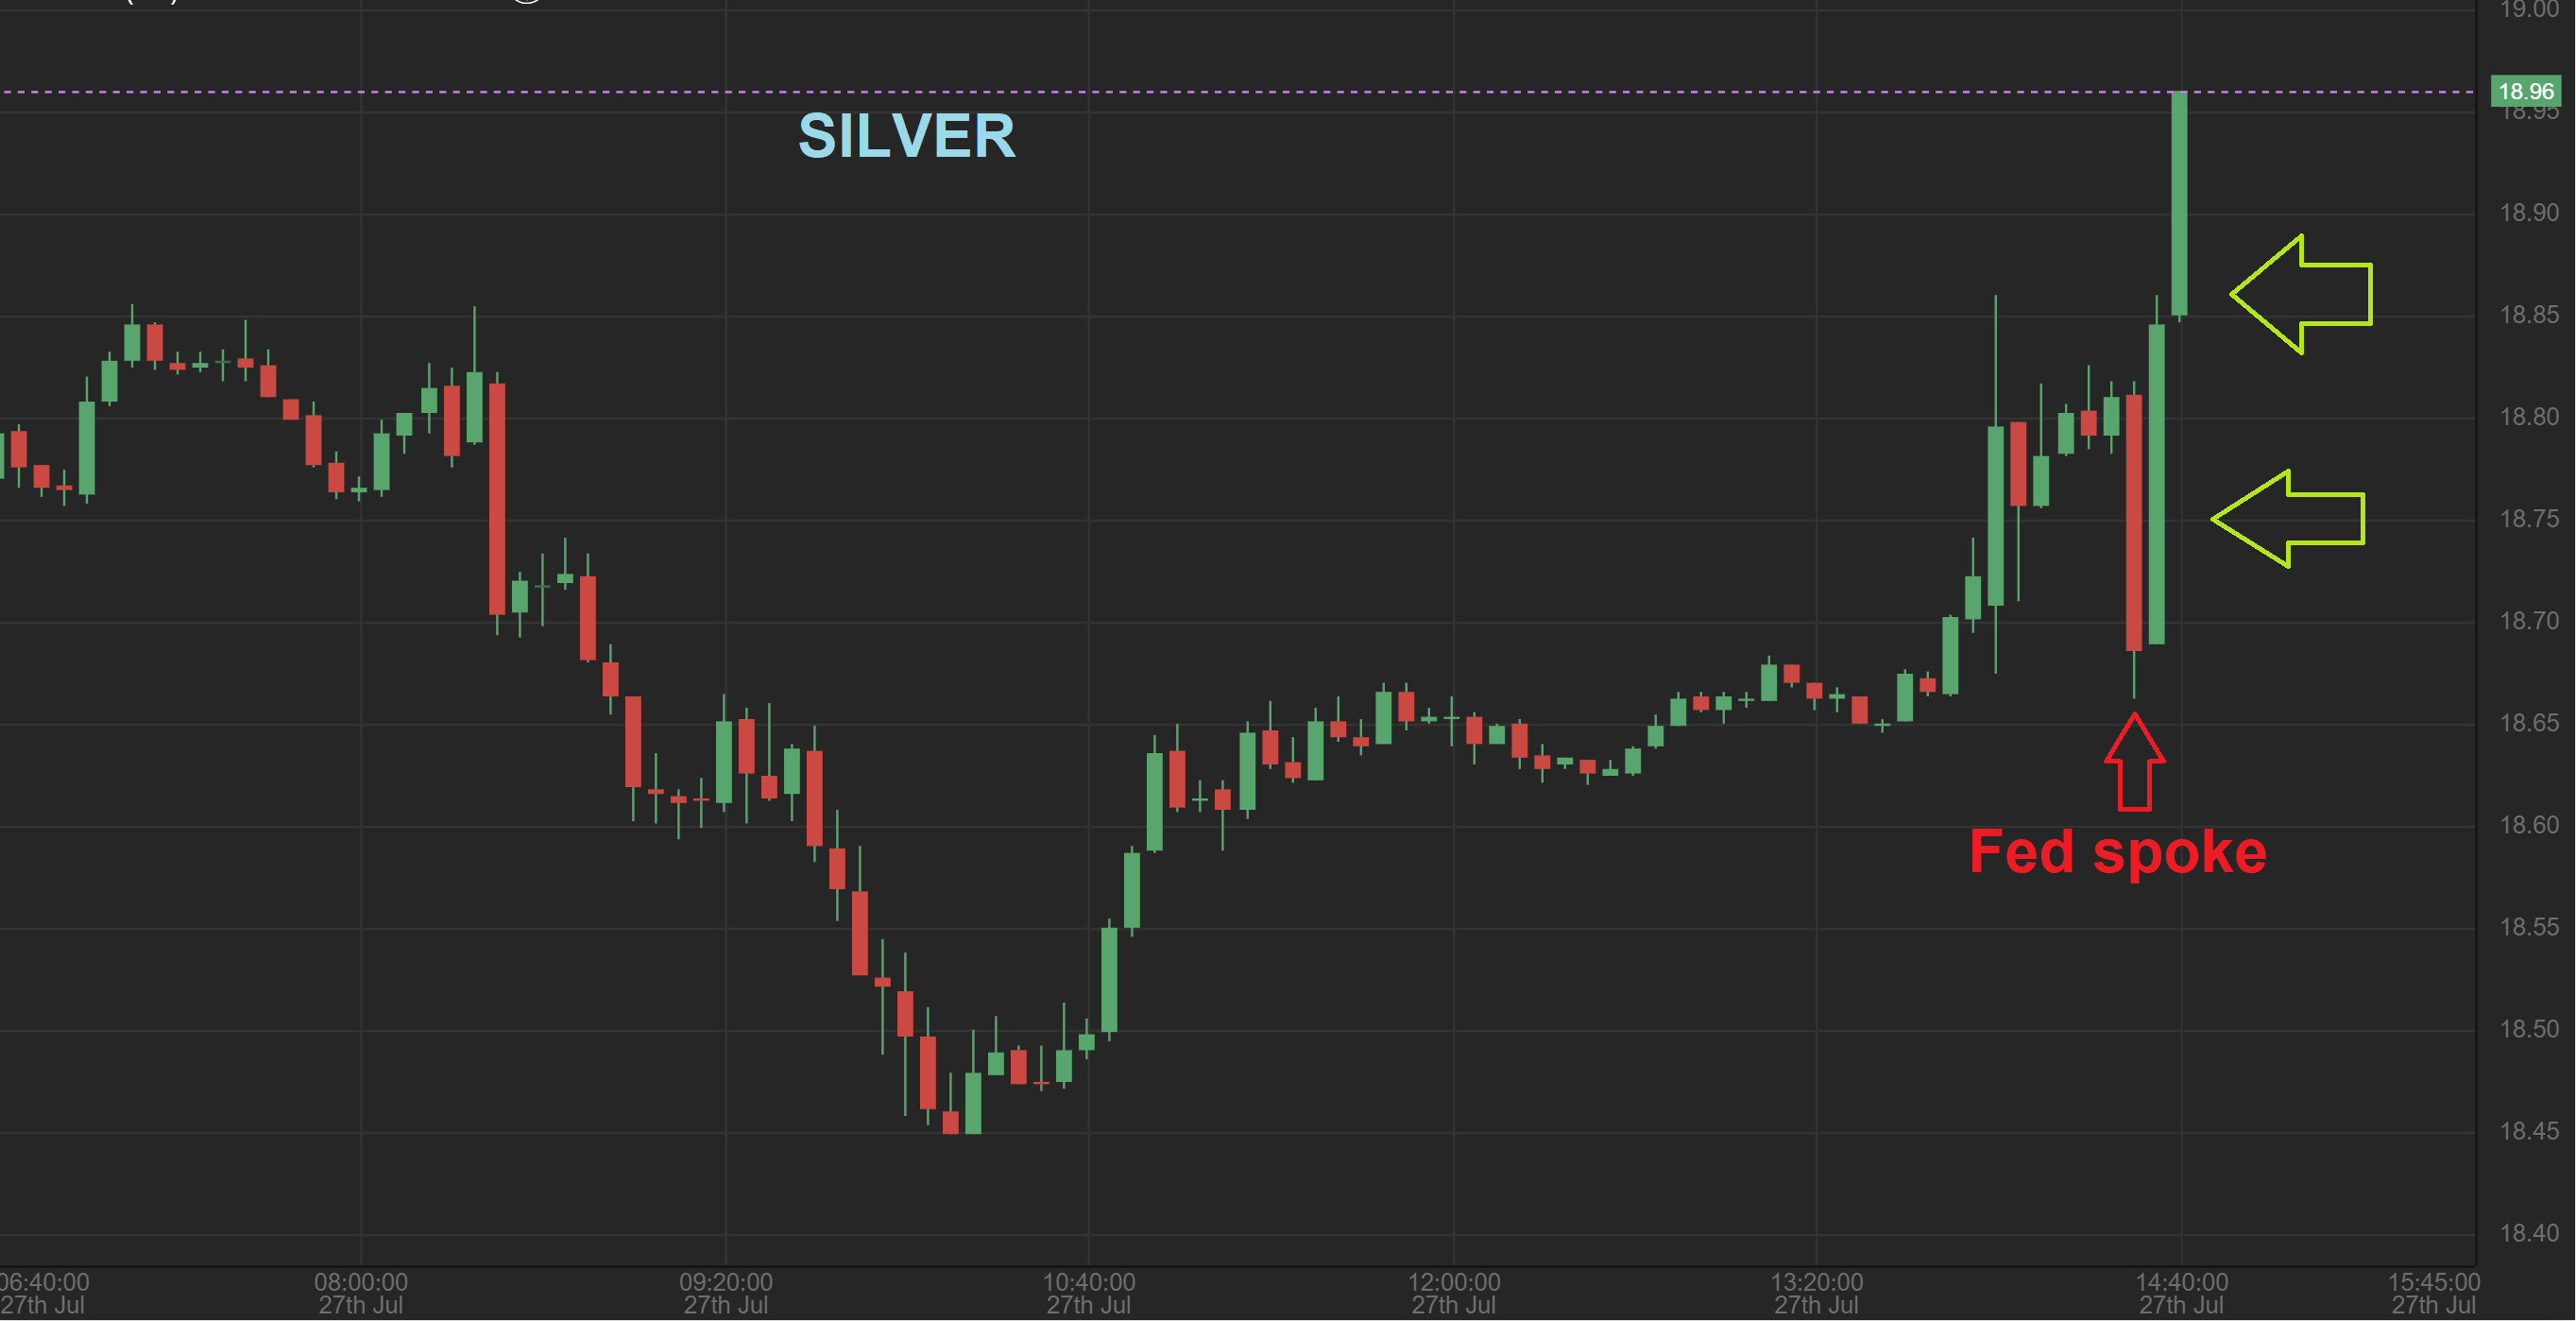
This was a Silver fake out: Silver rallied into the Fed Mtg. It became choppy and then suddenly slammed down when the Fed Spoke. This slam down may have caused people to sell, based on whatever he said, but then just as suddenly it just took off higher to new highs and rallied very sharply.
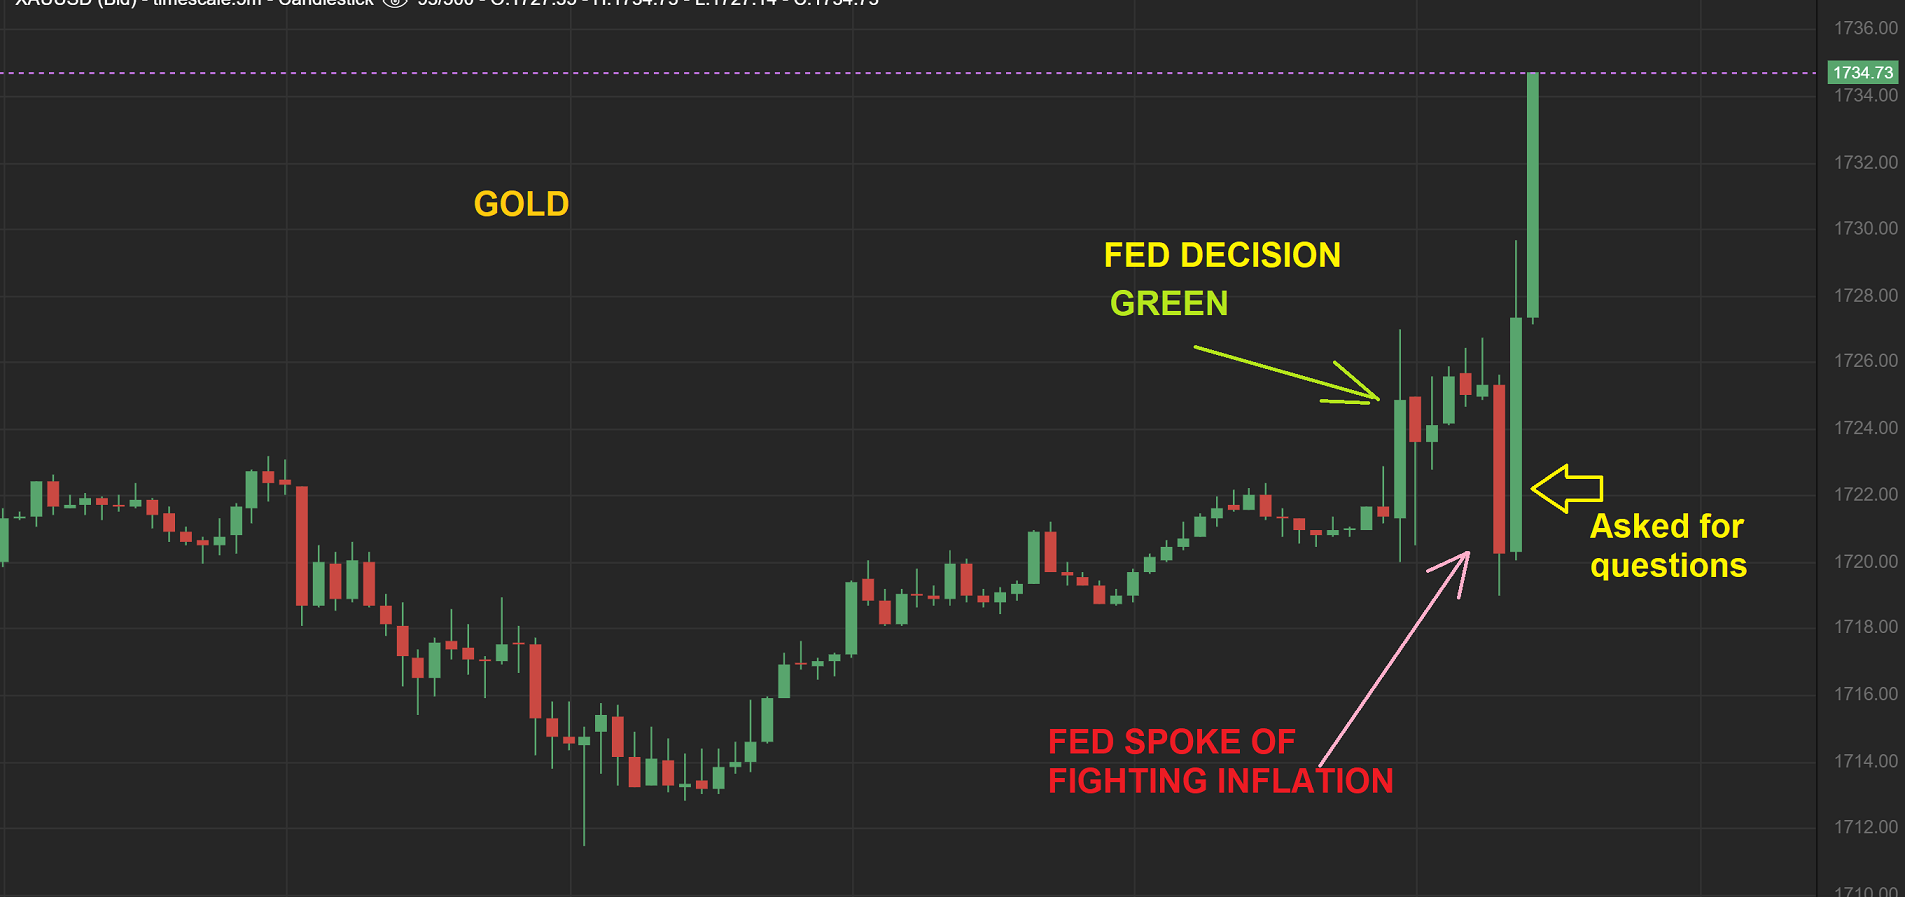
This was Gold on the same day: The rate hike ‘decision’ caused a spike rally and it continued higher into his speech. He then mentioned the inflation fight with future rate hikes and that slammed gold down. Again, that may have scared some into selling, thinking that what he said would tank Miners, and Boom- Gold Spiked sharply higher as he answered questions.
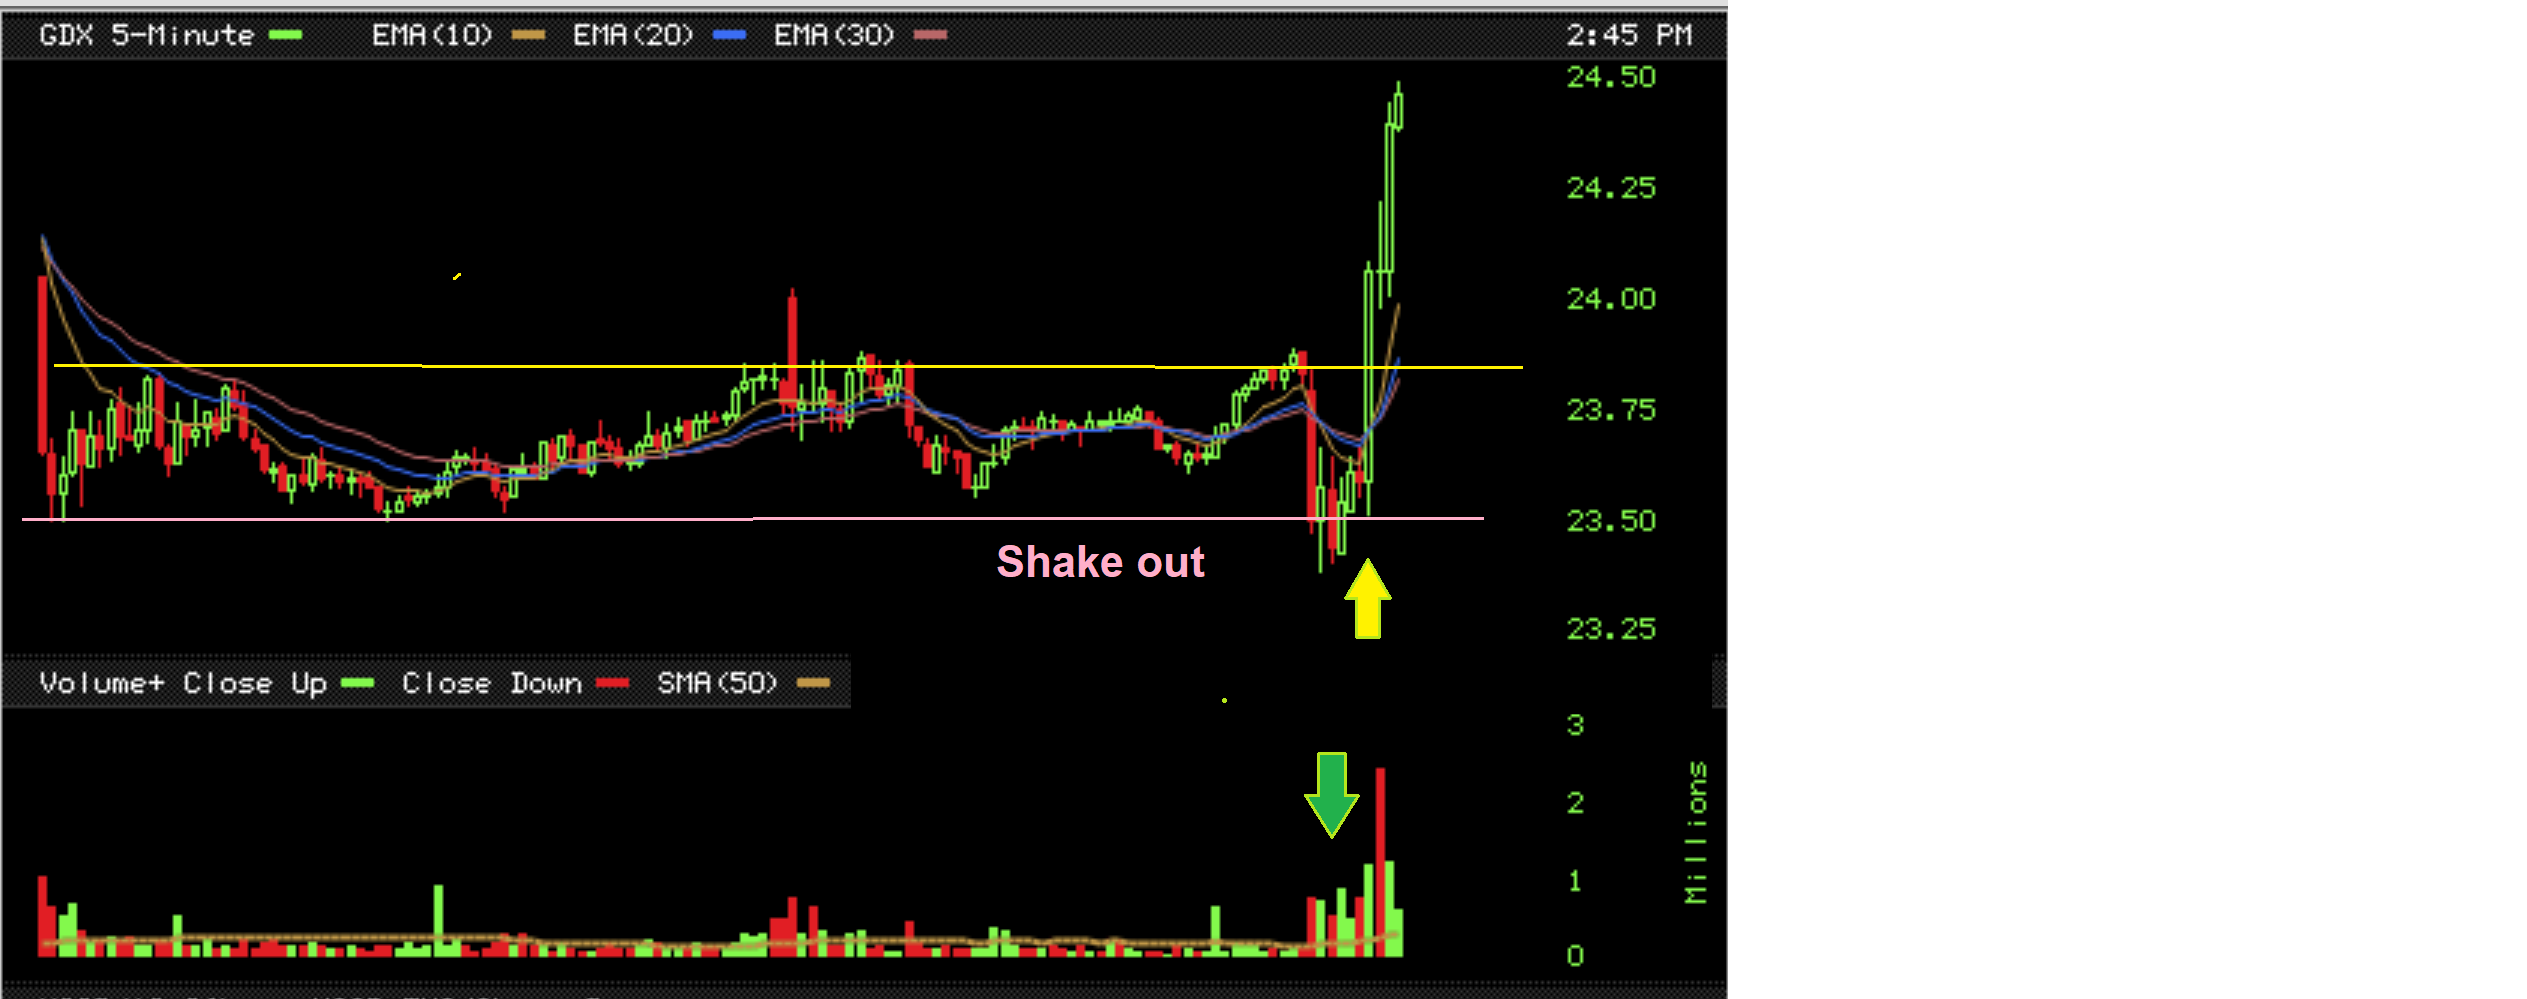
GDX rallied, slammed down, and spiked higher too. If you bought GDX or Miners on fed Wednesday, this would definitely have you second guessing whether or not it was going to run higher or crash.
.
So there you have a few charts of past reactions during The Fed Mtgs and Speeches for the General Markets and Gold & Silver. You have seen it with your own eyes – Fed days are never easy! They can really become volatile and shake things up, but there is nothing that we can really do about that kind of event volatility. We should now have dcls in place and I’m hoping that any volatility will not be able to break those lows. The set up is Bullish and I expect a rally from here, but let’s see what happens after the Fed decision and the speech that follows. Buy the volatility dip? Some added yesterday, it may be tough to hold on, we’ll see. Others will try to but that dip during volatility today (Not easy to do mentally), others may just find it best to wait until the final hour to add or even wait until Thursday to see what the reaction is the day after the Fed mtg. It’s never really easy, but in the daily charts we should have the lows in place and you can add to your miners whenever you are comfortable doing so.
.
If at all possible, Enjoy your Fed day trading! 🙂
.
~ALEX
.
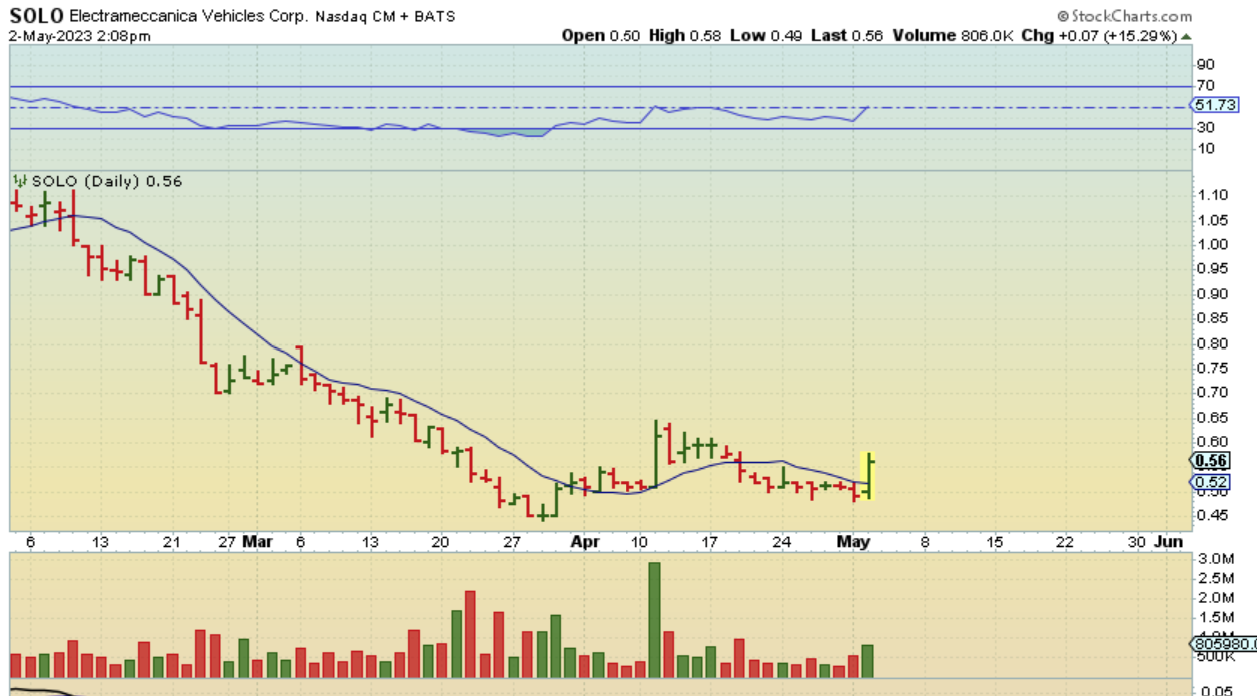
I almost forgot to add these as a point of interest going forward. Yesterday some of the EV & Clean Energy companies were Popping up 20% or so too. Some have bases or double bottoms and were mentioned in recent reports too (like SOLO, GOEV, etc), so I just wanted to share these for your watch list. You can also add them to a portfolio with a stop, or maybe for now just keep an eye on the sector like I am. IF THESE BOTTOM AND MAKE A MOVE HIGHER, they can run nicely, but for now they remain choppy and may not be quite ready to run. I am watching them daily.
.
SOLO has a higher low and was discussed the first time that it popped.
.
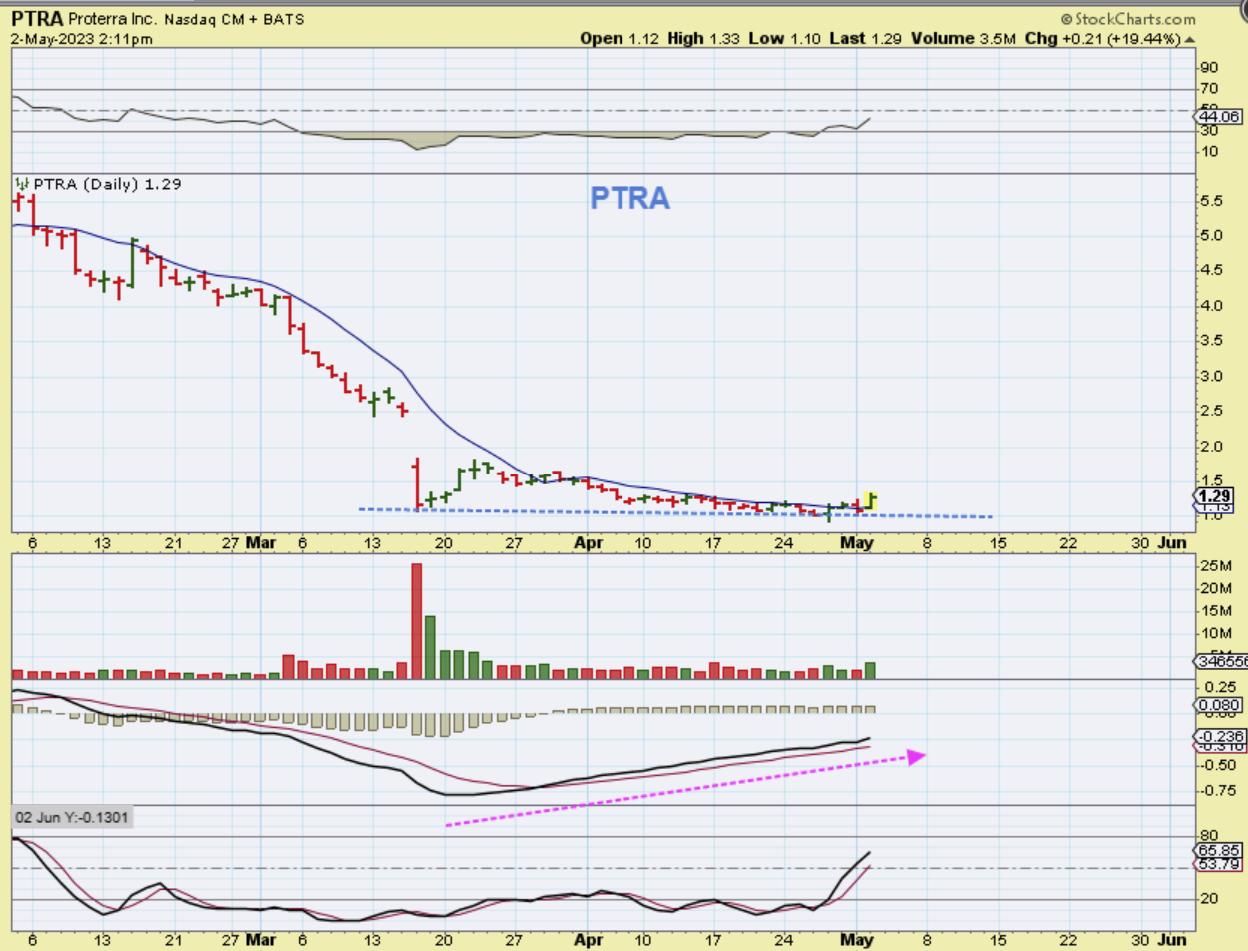
PTRA has a double bottom or a base too.
.
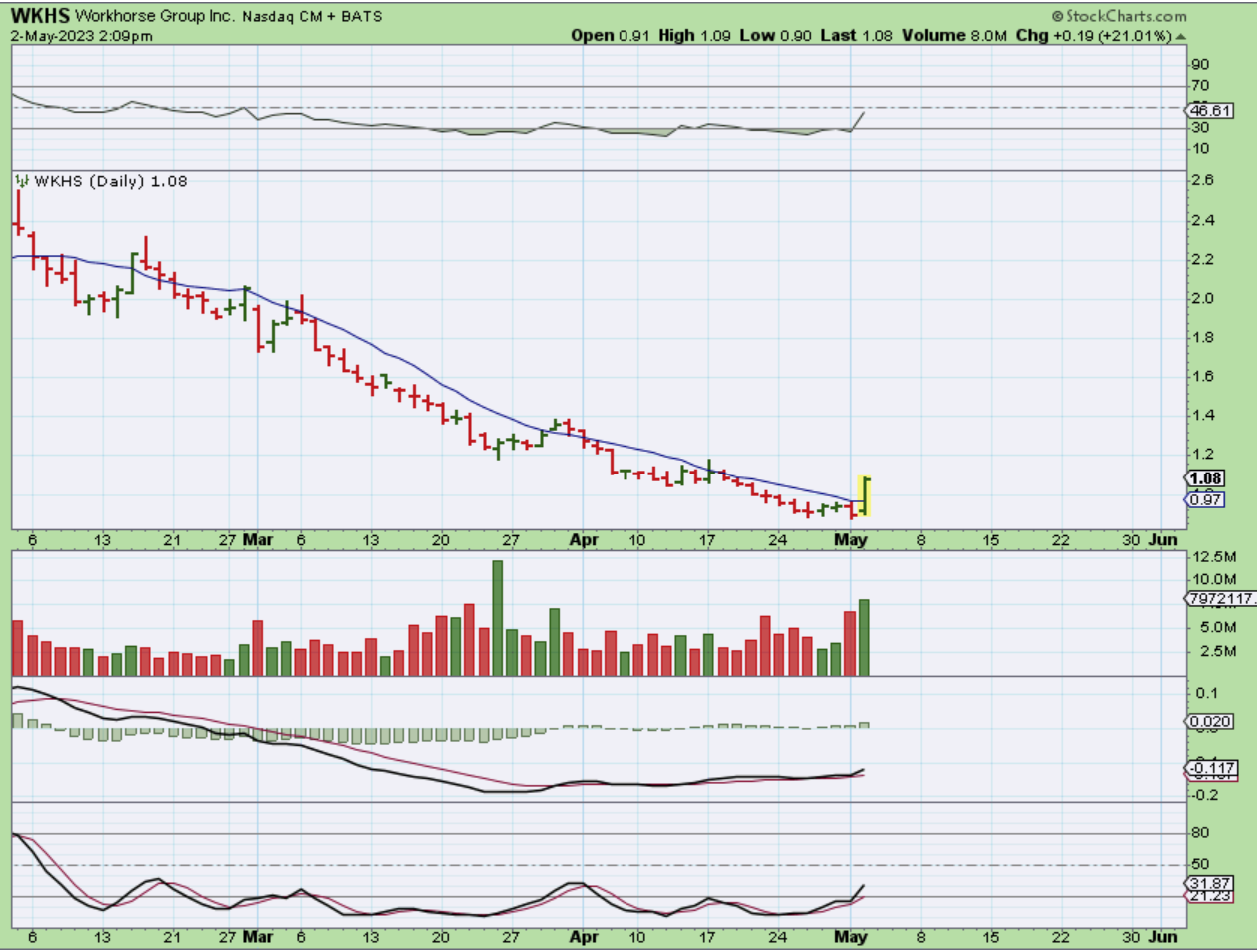
WKHS is just now trying to break out.