Tuesday May 2nd – Broken Banks
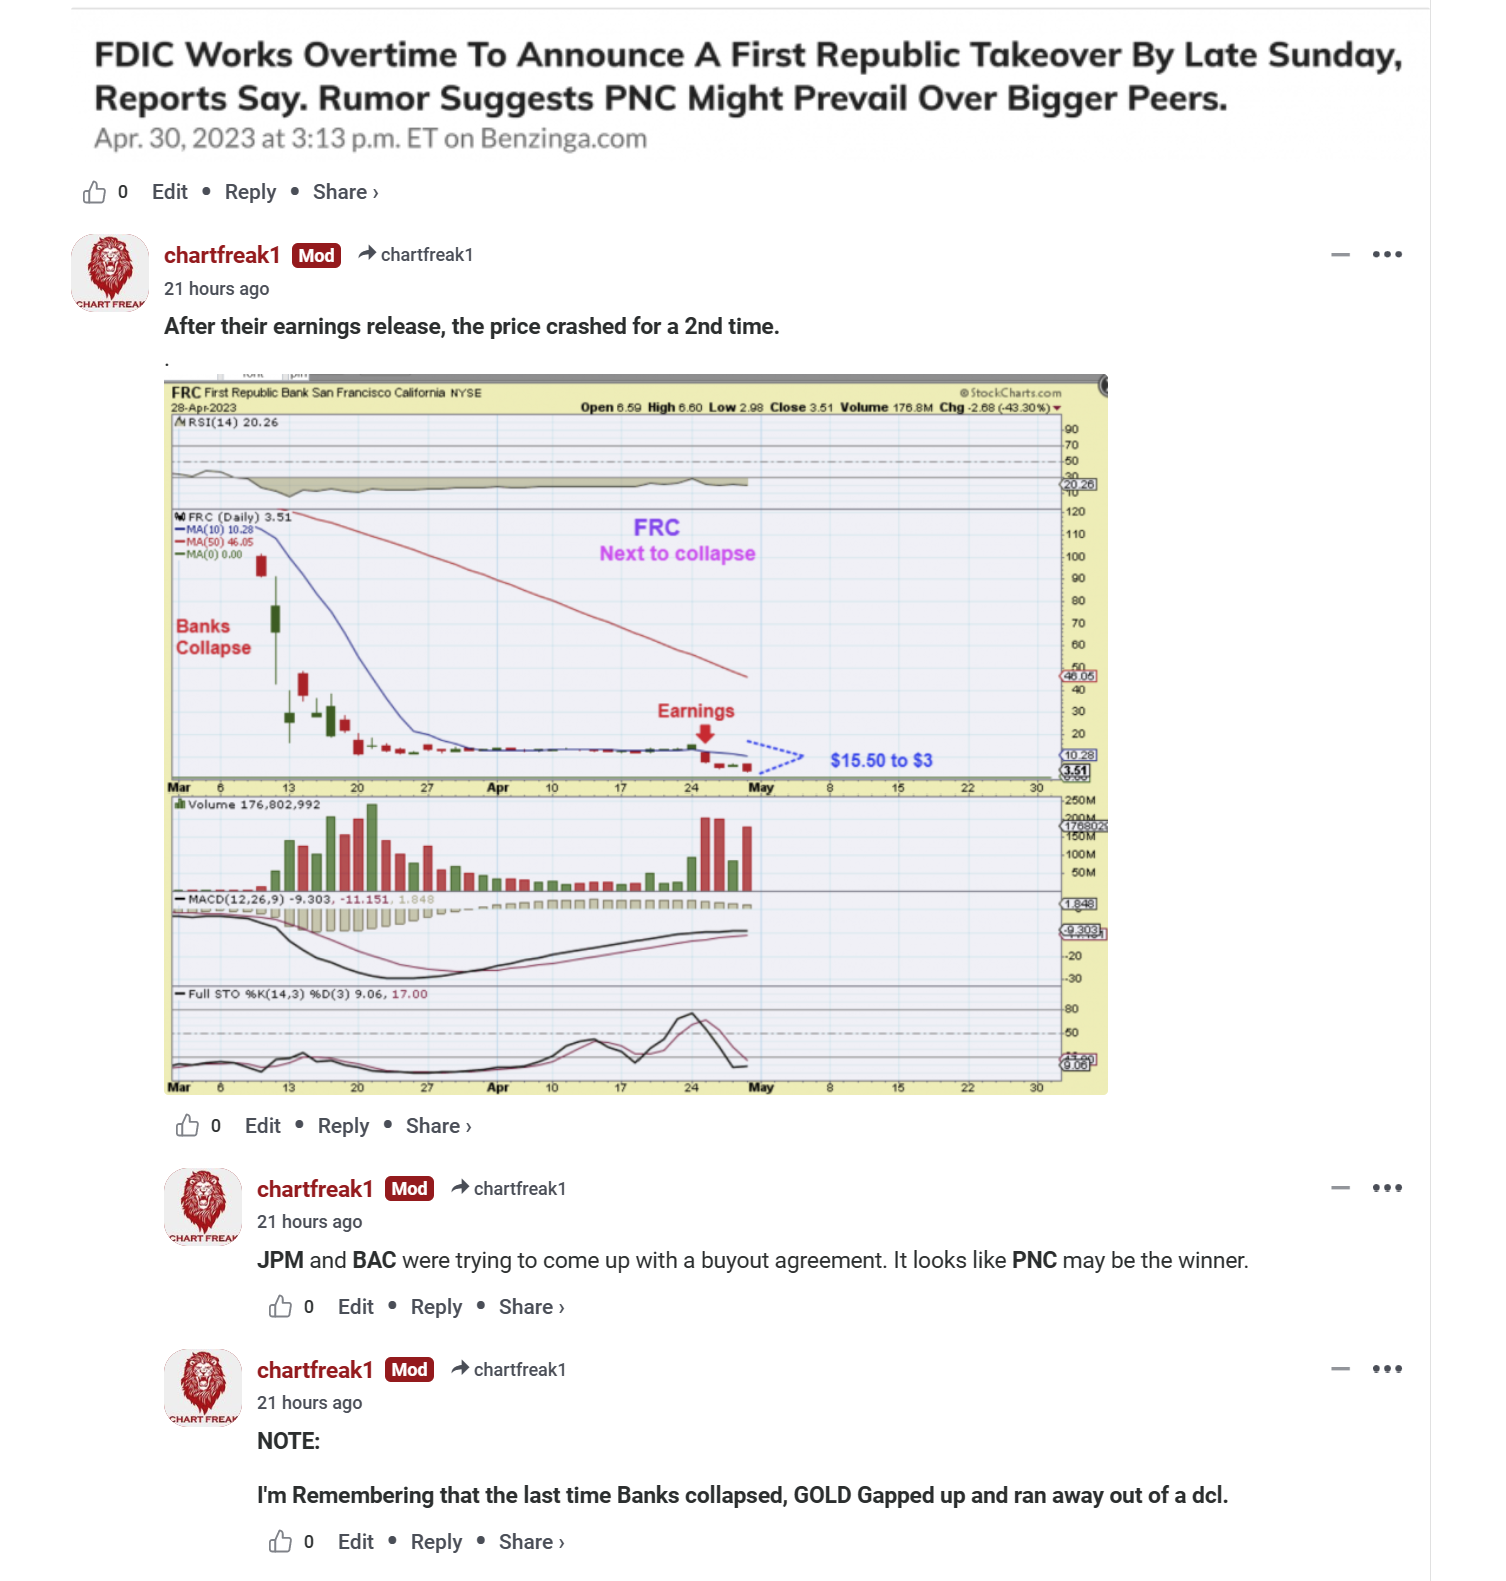
This weekend I was hearing that First Republic was about to be the next bank to fail in 2023, and the 3rd largest bank ever to fail. I decided to mention that in the comments on Sunday night, because the last time we saw banks fail on the weekend, Gold & Silver broke sharply higher on Monday (everything gapped open higher on that Monday in March) and the sector rallied for weeks.
.
Since we are due for a dcl, I wrote these 3 comments below on Sunday night:
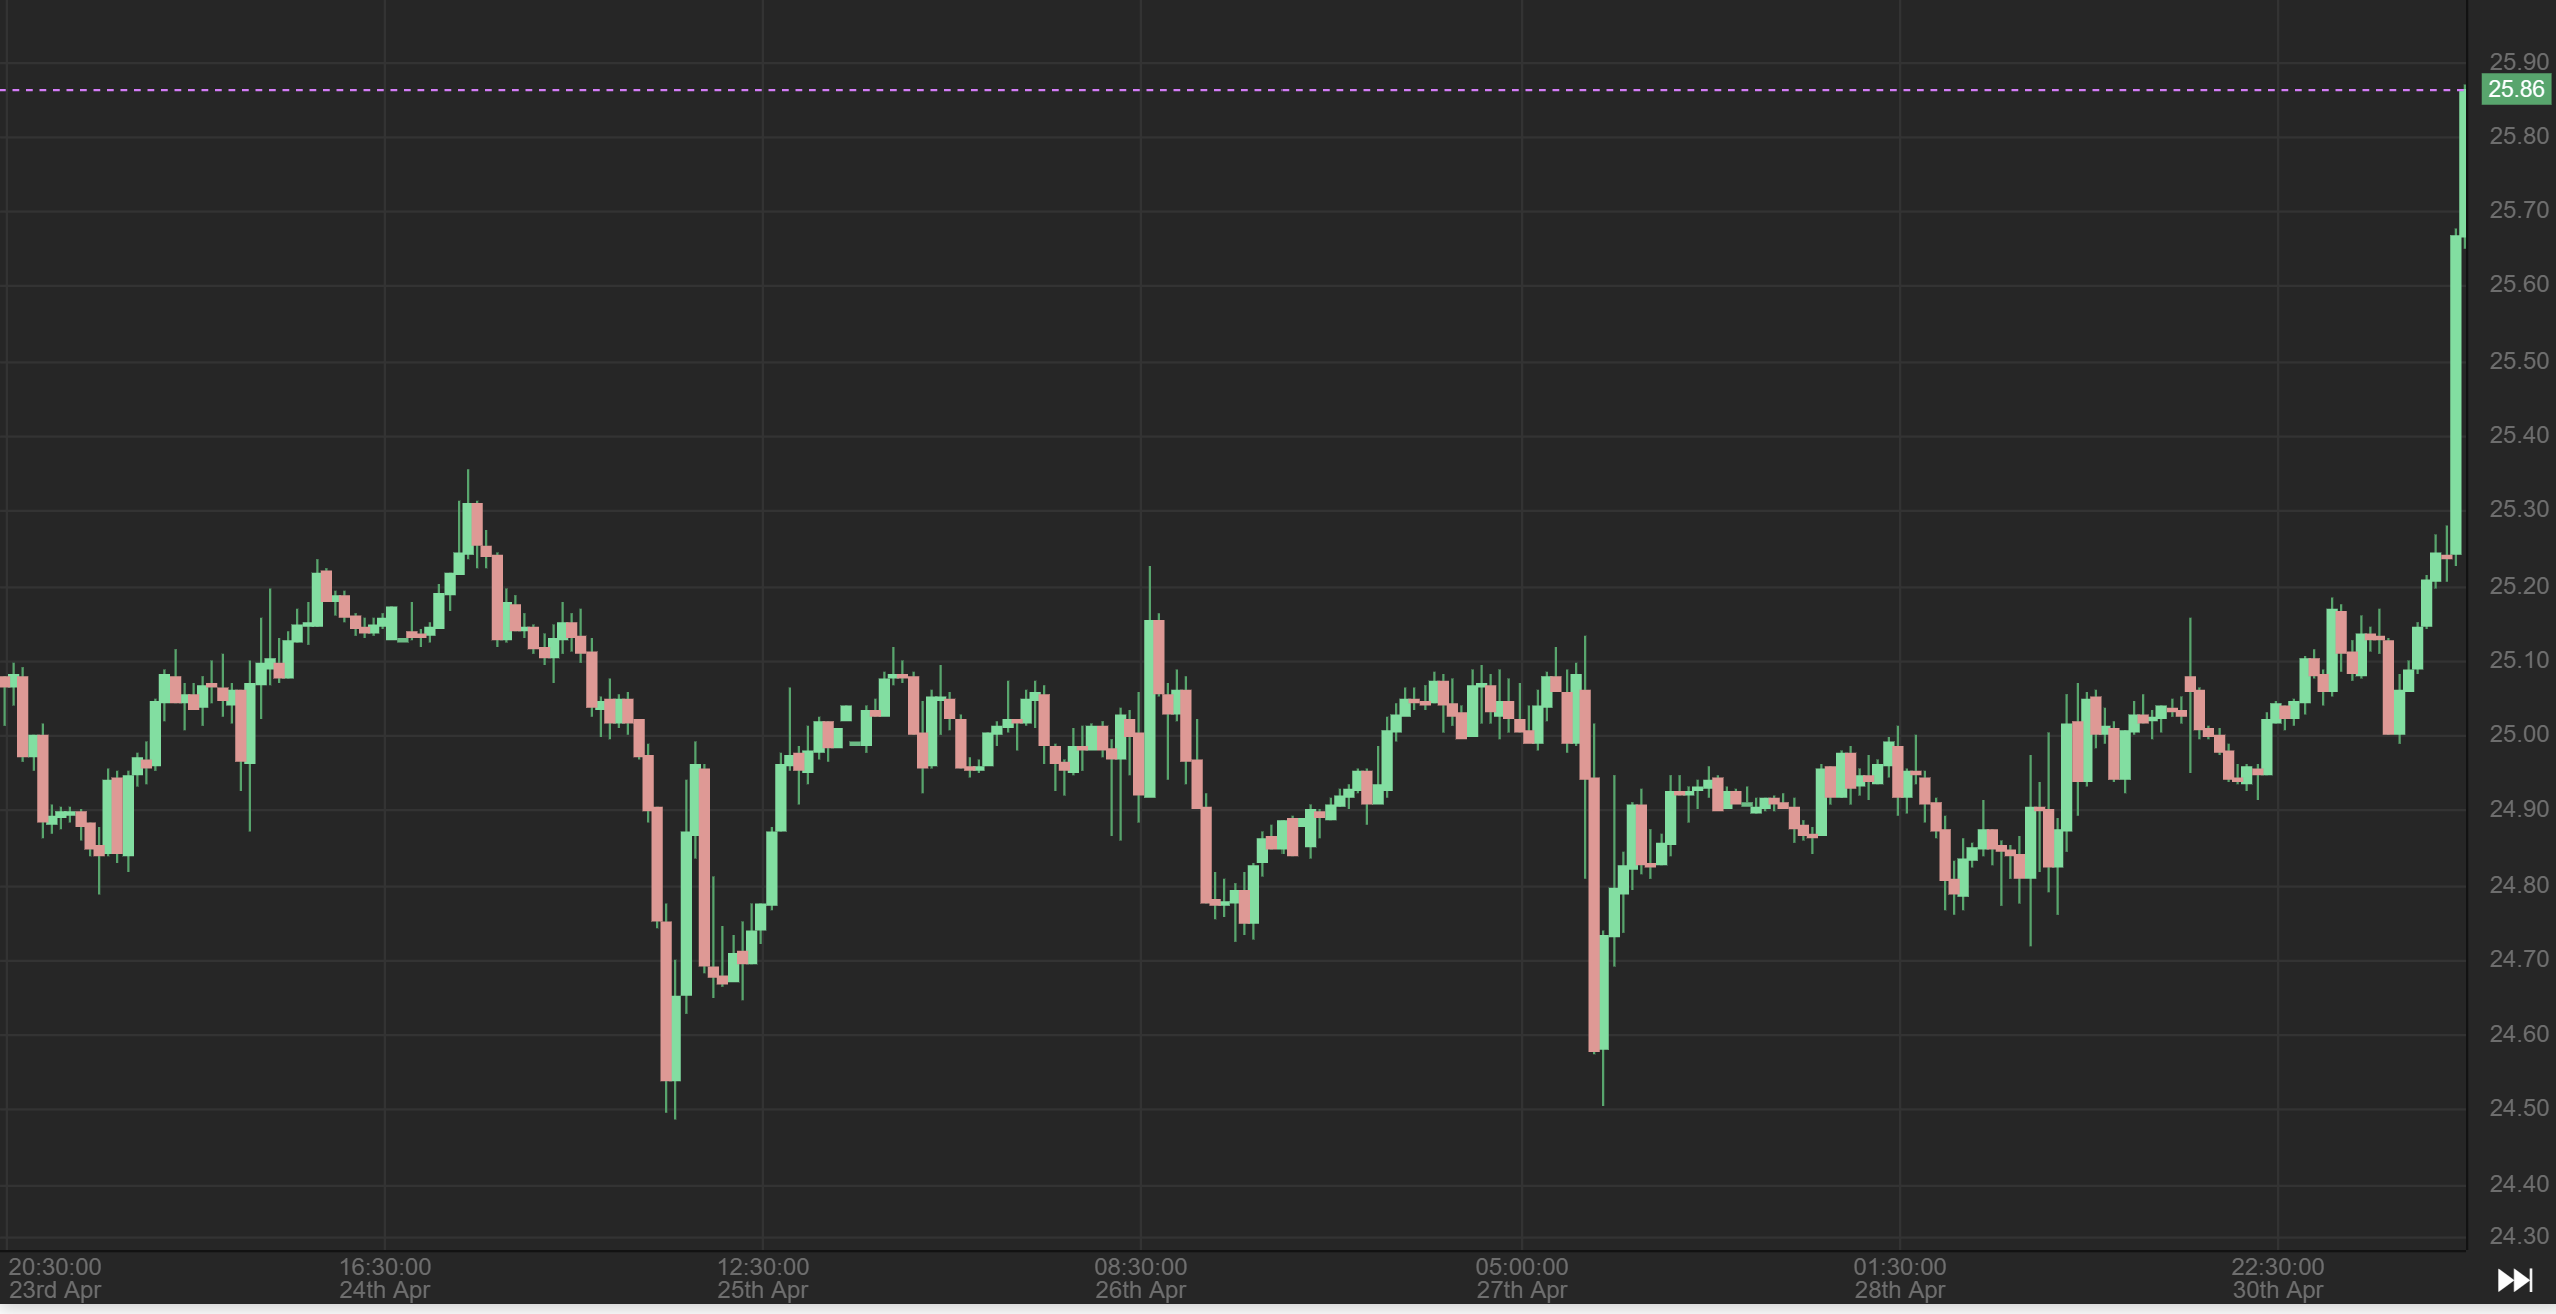
ON MONDAY MORNING: This was Silver on a 30 minute chart ripping higher after 8 a.m. ET. It definitely looked like the same reaction was taking place when the Banks collapsed in March. I added a little to my Silver stocks in pre-market, just in case we got a gap & go runaway move.
.
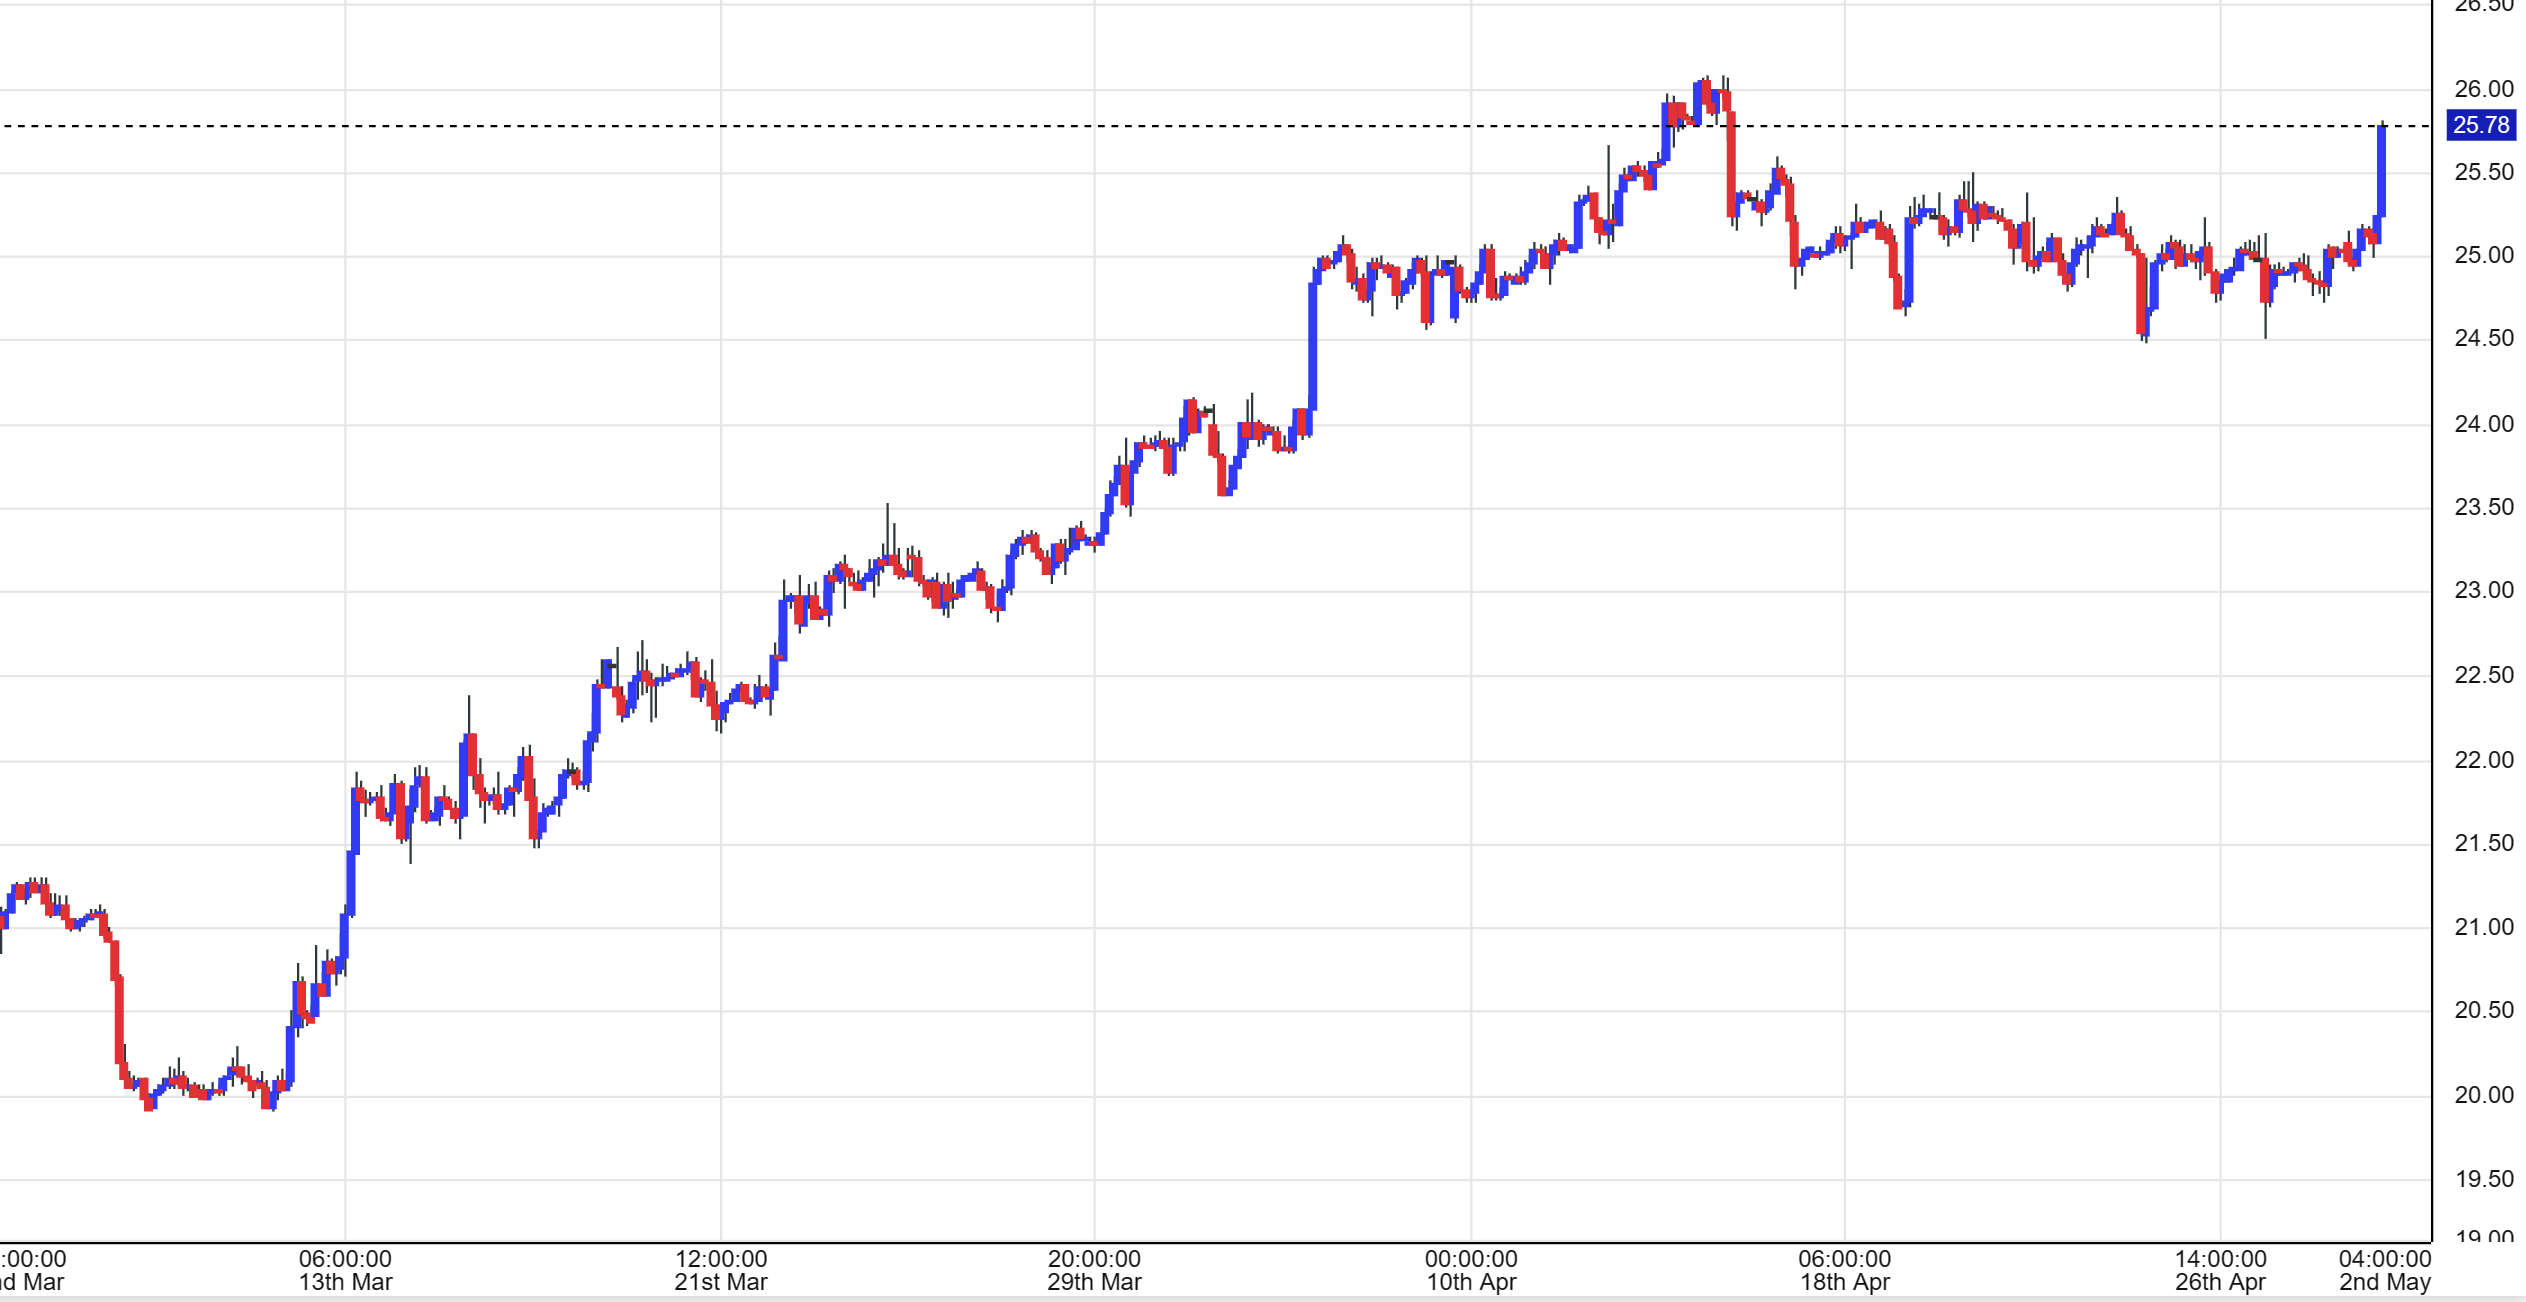
And this is a view from a little further back. I think this was a 1/2 hr chart that showed Silver, which was due for a dcl, taking off higher from a choppy base. THIS looked very good, so what happened next?? Well, why don’t we discuss the rest of the day for the Precious Metals sector later, first we’ll cover the General Markets, oil, etc…
.
.
The General Markets rallied in the morning too, but then they sold off in the second half of the day. This gave us a reversal candle or a ‘pop & drop’. You may recall that in recent reports I warned that we might see choppy toppy action similar to what we saw when the first daily cycle started to top.

.
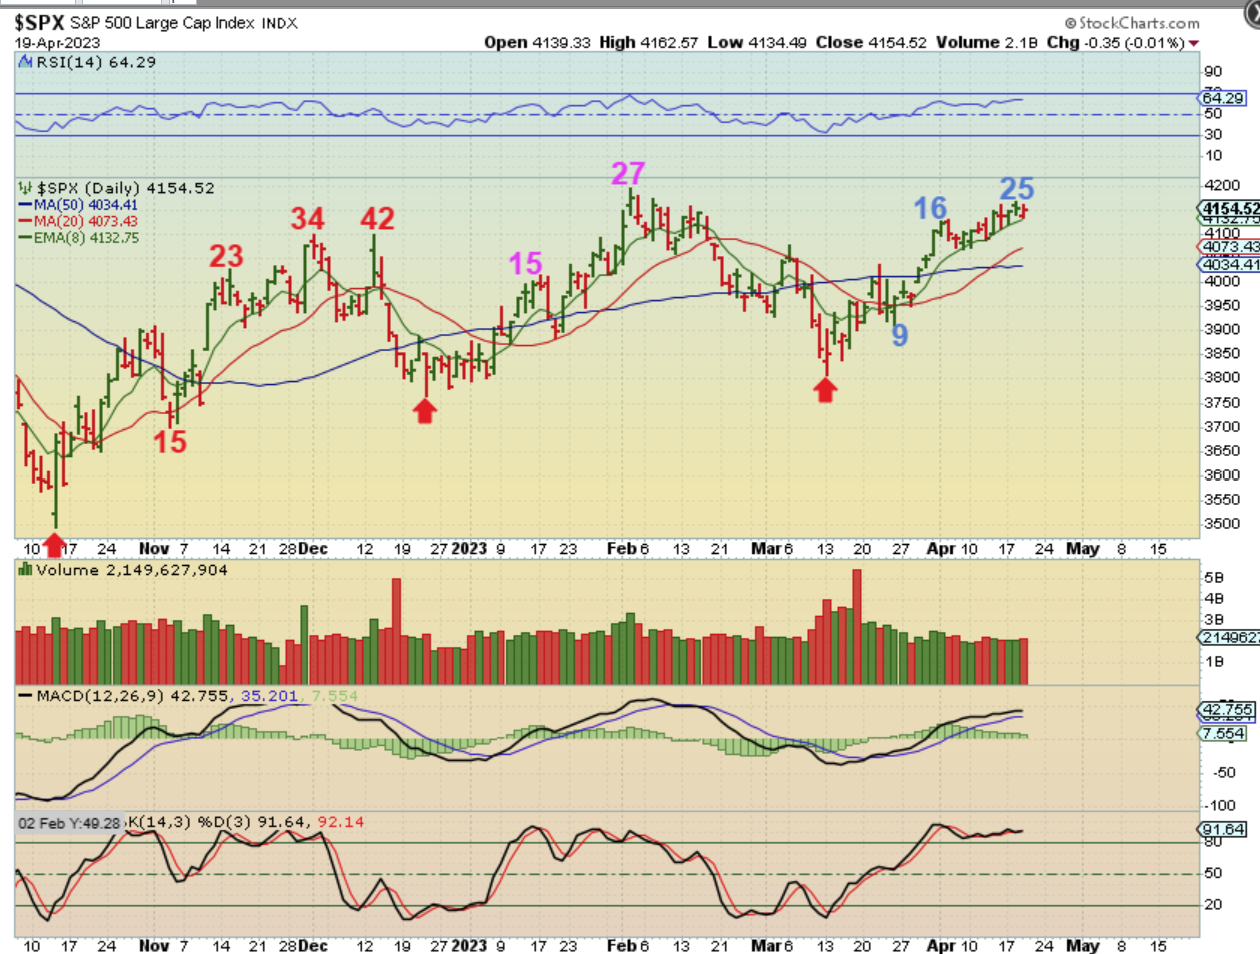
This was The SPX on April 19th, and this was where I was showing how that first daily cycle kept breaking to new highs and then dropping, so it was a choppy topping process. Each of those bursts higher looked like a rally would follow, but it rolled over after day 42.
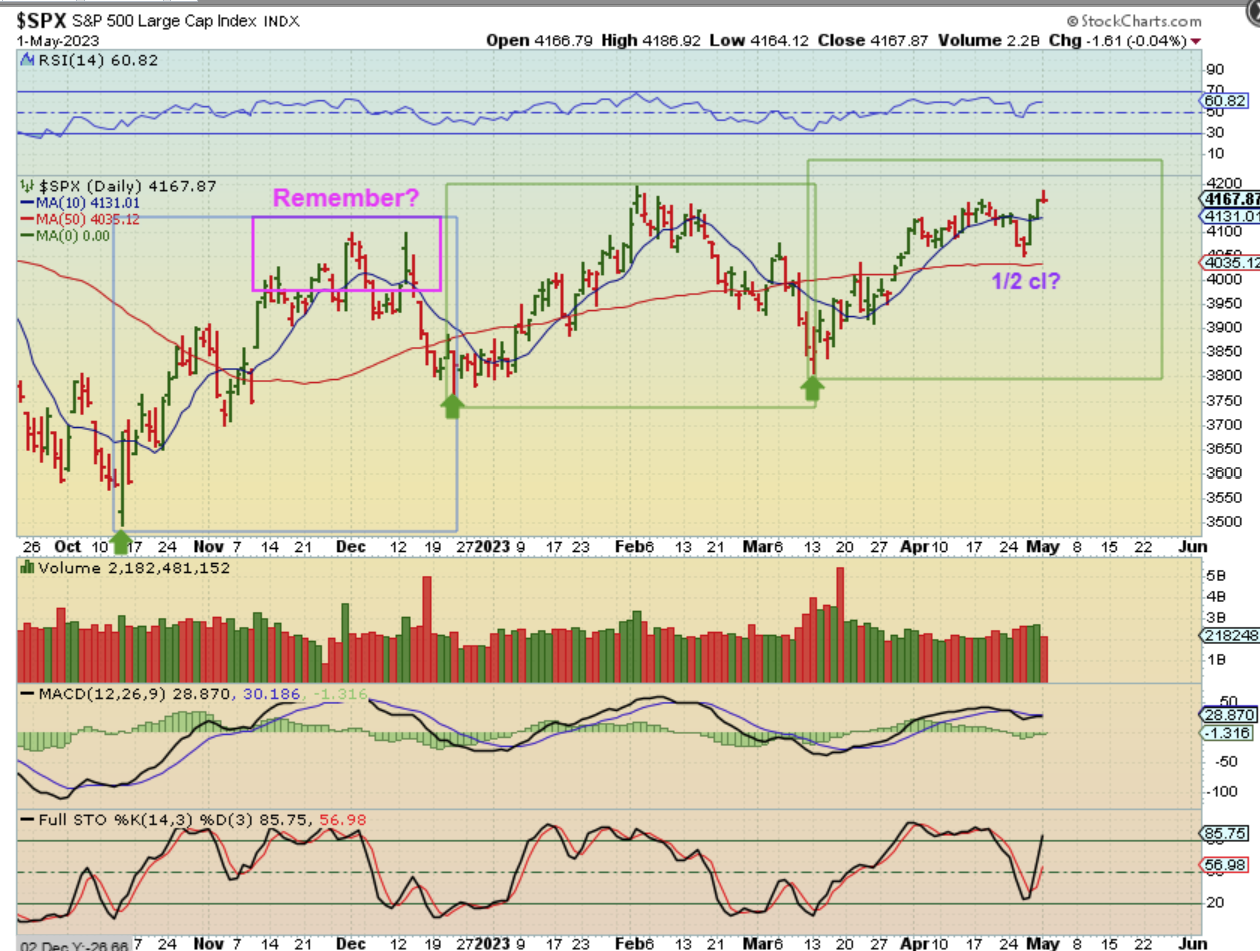
For the last 3 days The SPX rallied higher, but it started to reverse into the close yesterday too. We had 2 long daily cycles of 50 days, so was this just a 1/2 cycle low and another long daily cycle will take place? Or was that a shorter daily cycle and a dcl? We will likely know better after Fed Wednesday.
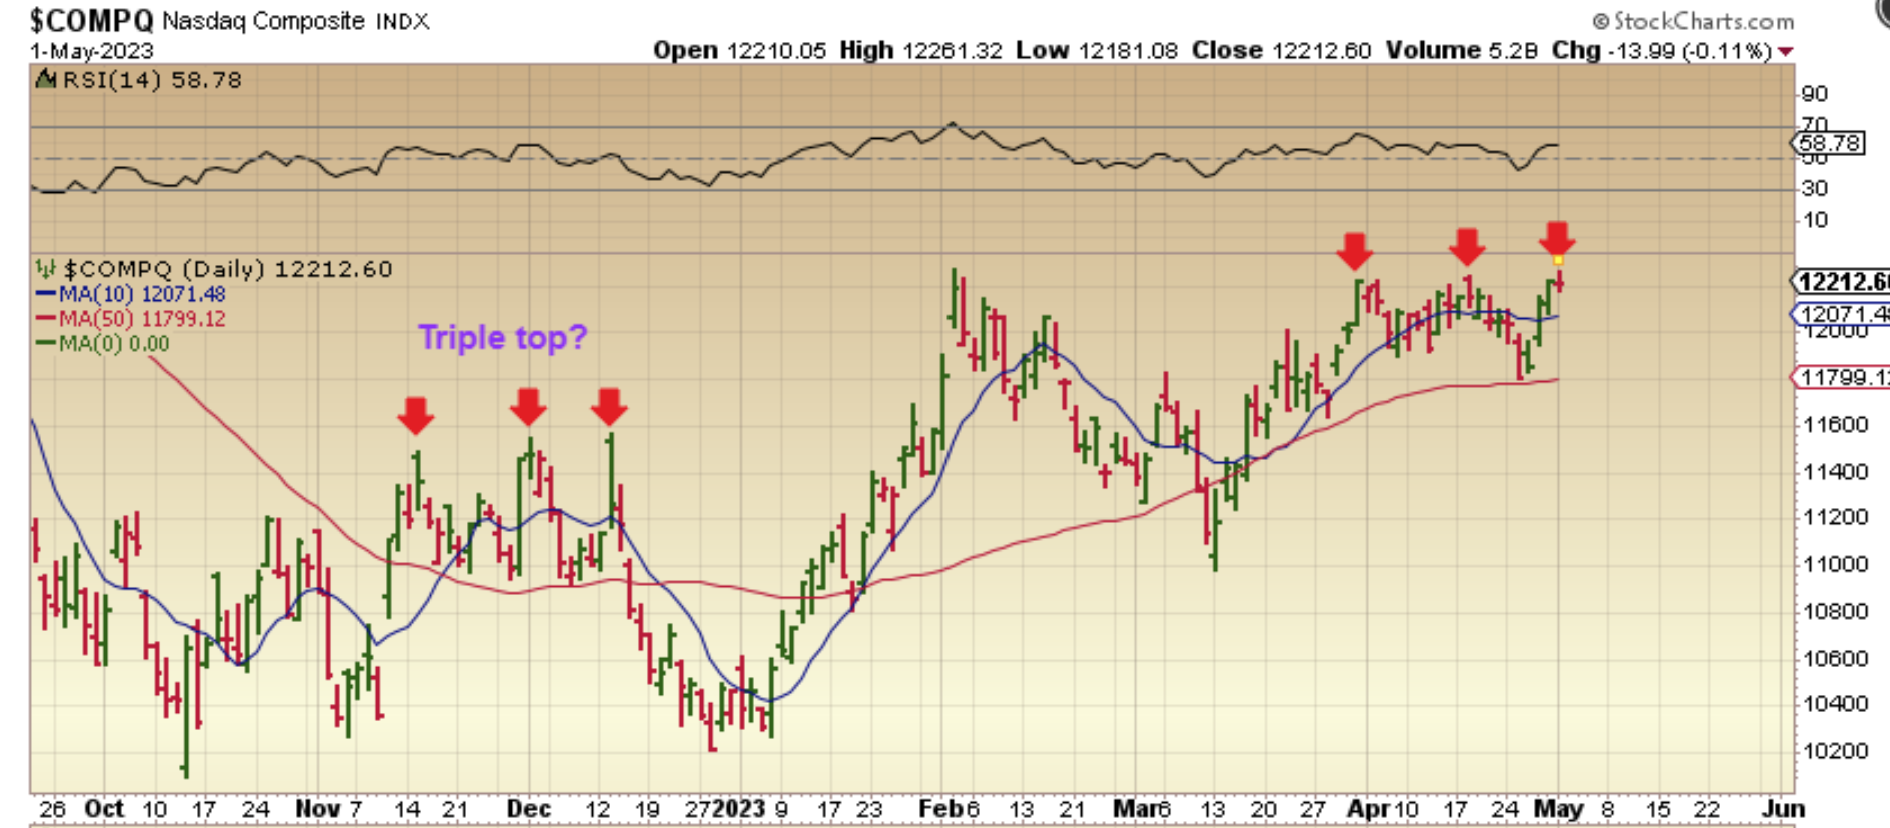
The NASDAQ is giving us the same triple top look though. This is where it triple topped after the first daily cycle, so we want to be aware of that, especially on a Fed Week and this late in a daily cycle if that is a 1/2 cycle low.
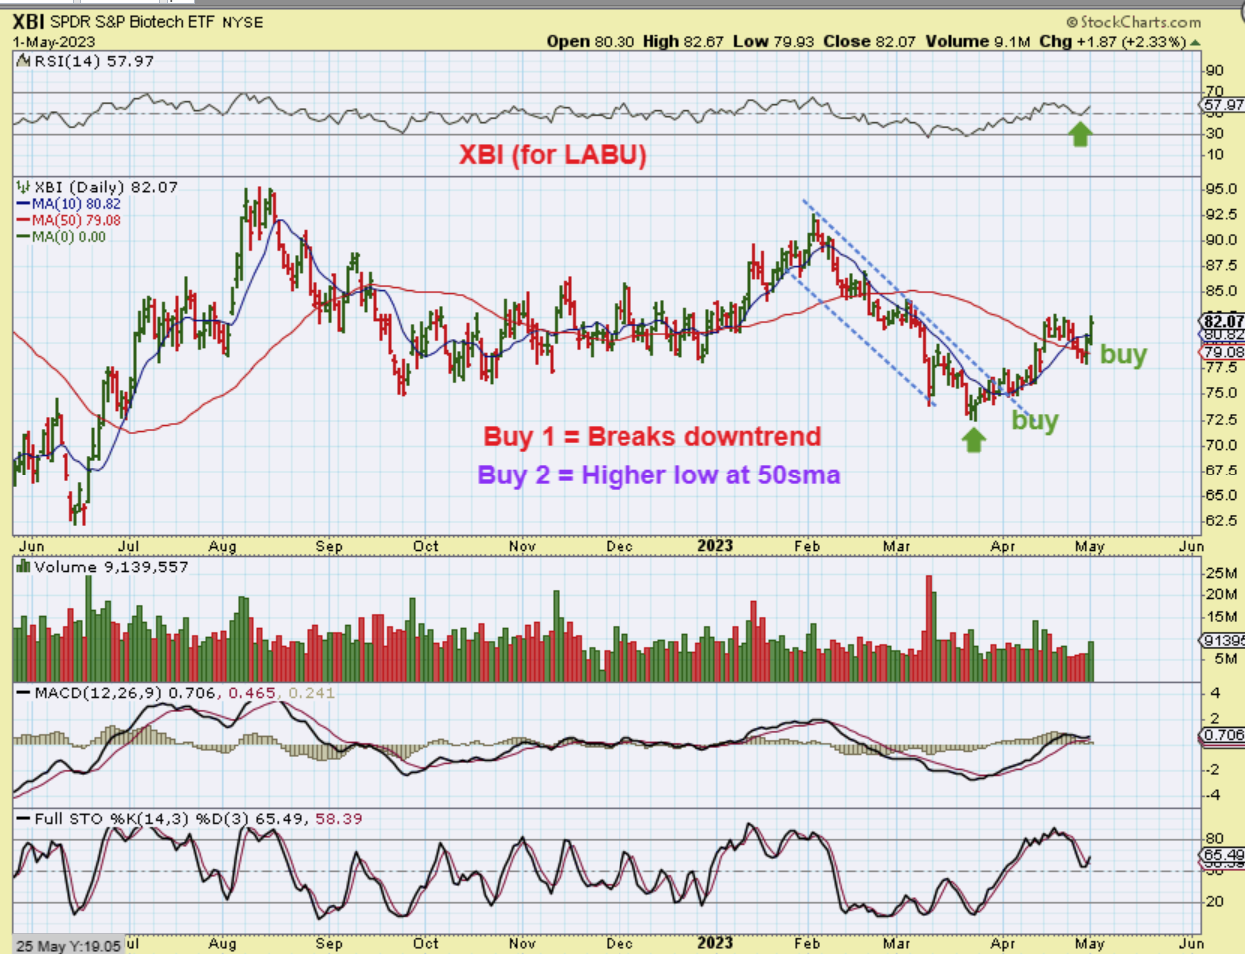
XBI MARCH 29 -In March I pointed out the XBI downtrend break as a buy opportunity for LABU. I then mentioned it a few more times in March and April…
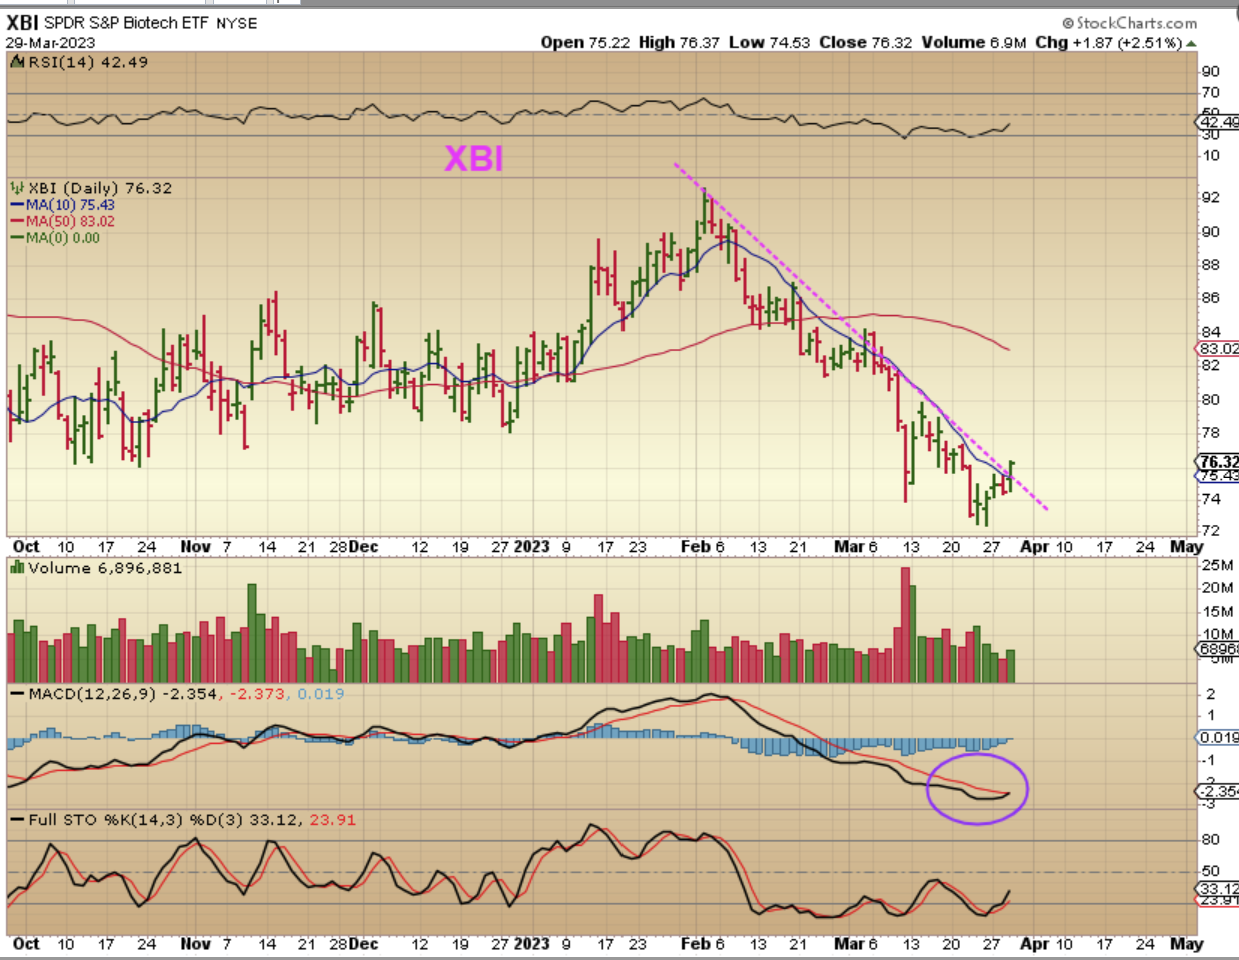
XBI -And recently I also noted that with the General Market rally after the bank failure, Biotech continued to sell off in what looks to be an ICL. So I was pointing out that this no longer followed the General Markets, but that this may be the move out of the ICL for XBI.
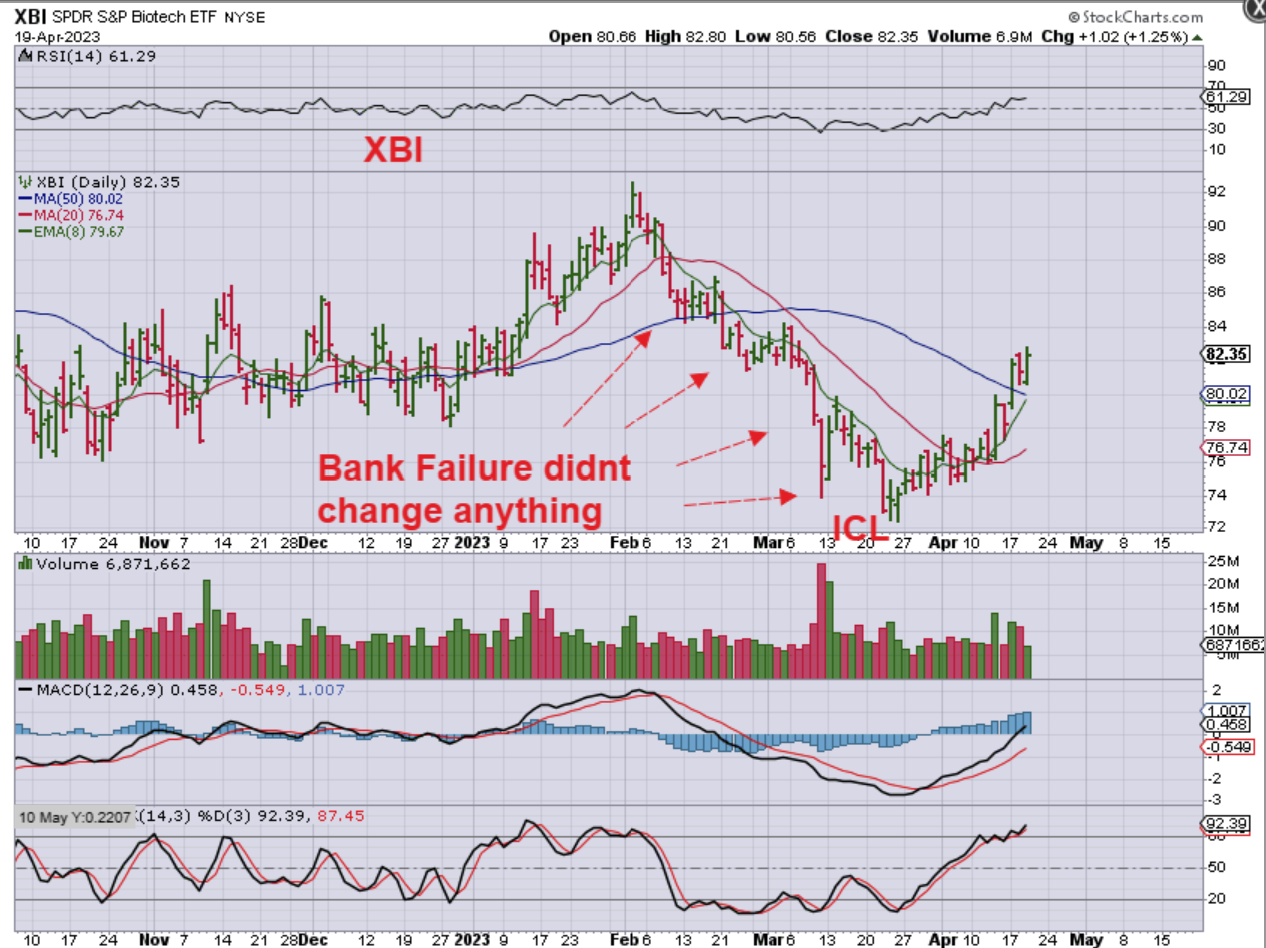
Since then, THE XBI has chopped sideways and then it pulled back to the 50sma and put in a higher low at the 50sma. This is also a buy area, or a place to add if you bought at the lows with the downtrend break.
.
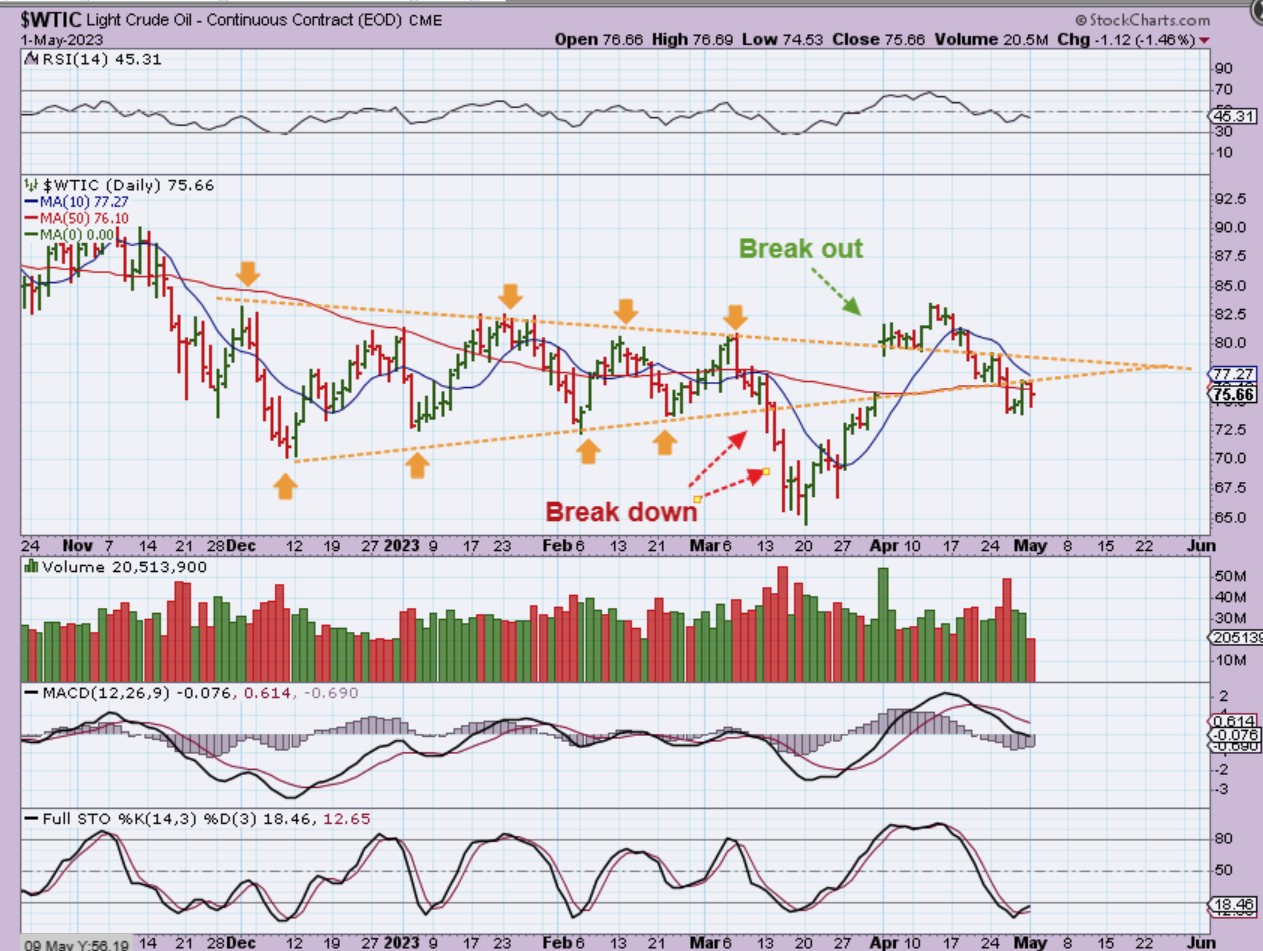
WTIC – Oil has been so choppy that it is just TOUGH! It has offered plenty of reasons to move higher, but it seems to want to be choppy in a battle between the bulls and bears. So what do we look for next?
After the rally out of the March lows, Oil is back at the 50sma area. I think that a push above the 50 & the 10sma should offer a buy at this higher low, with a stop at that recent low. Oil is oversold now too.
.
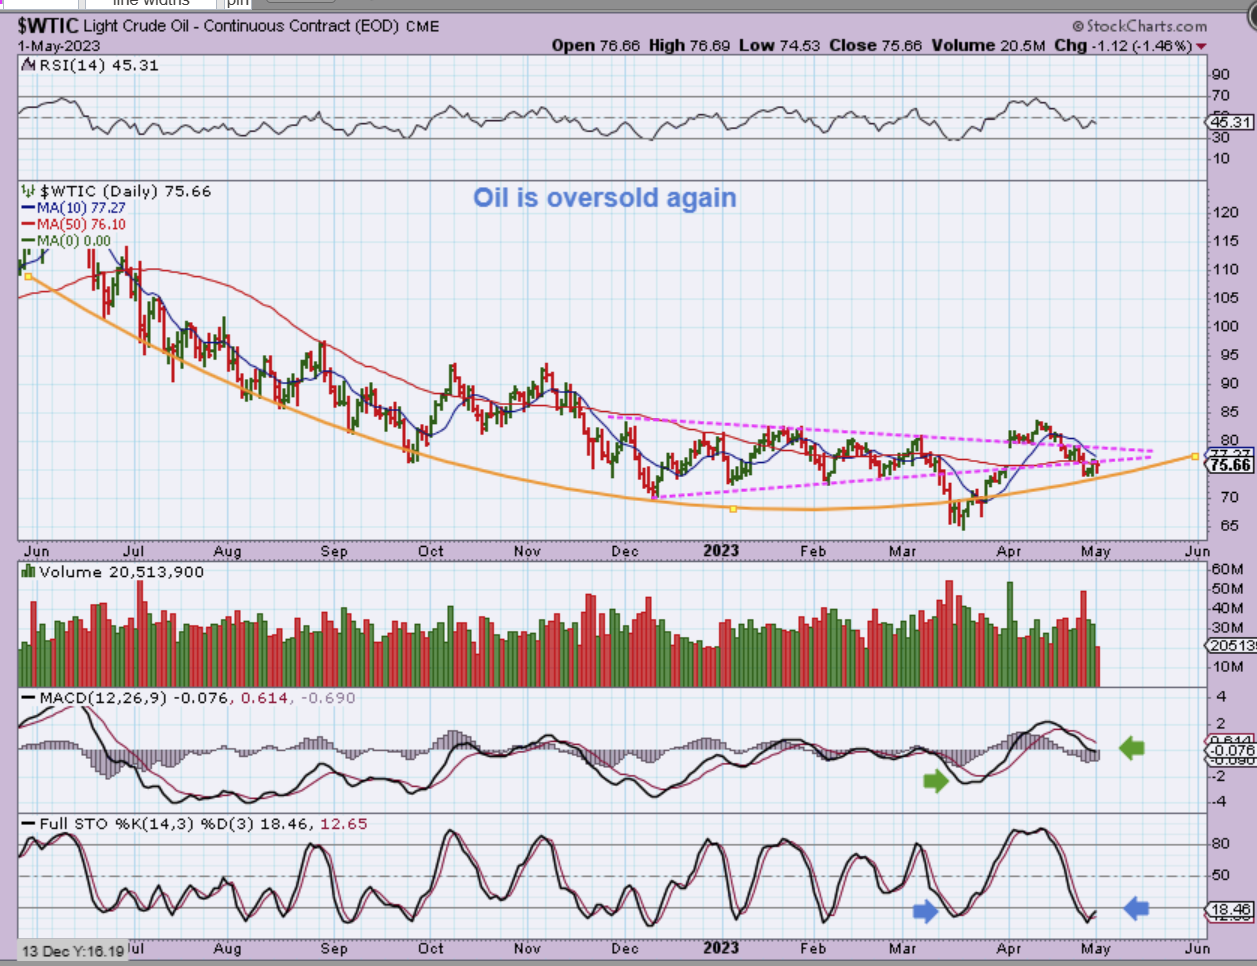
Is Oil ok in the bigger picture?…
.
When I step back and look at OIL this way, you can see that it is very very choppy, but it may be forming a rounding bottom base here over time. Unfortunately, that might mean that we chop higher up the right-hand side in a similar manner that it dropped on the left side formed.
.
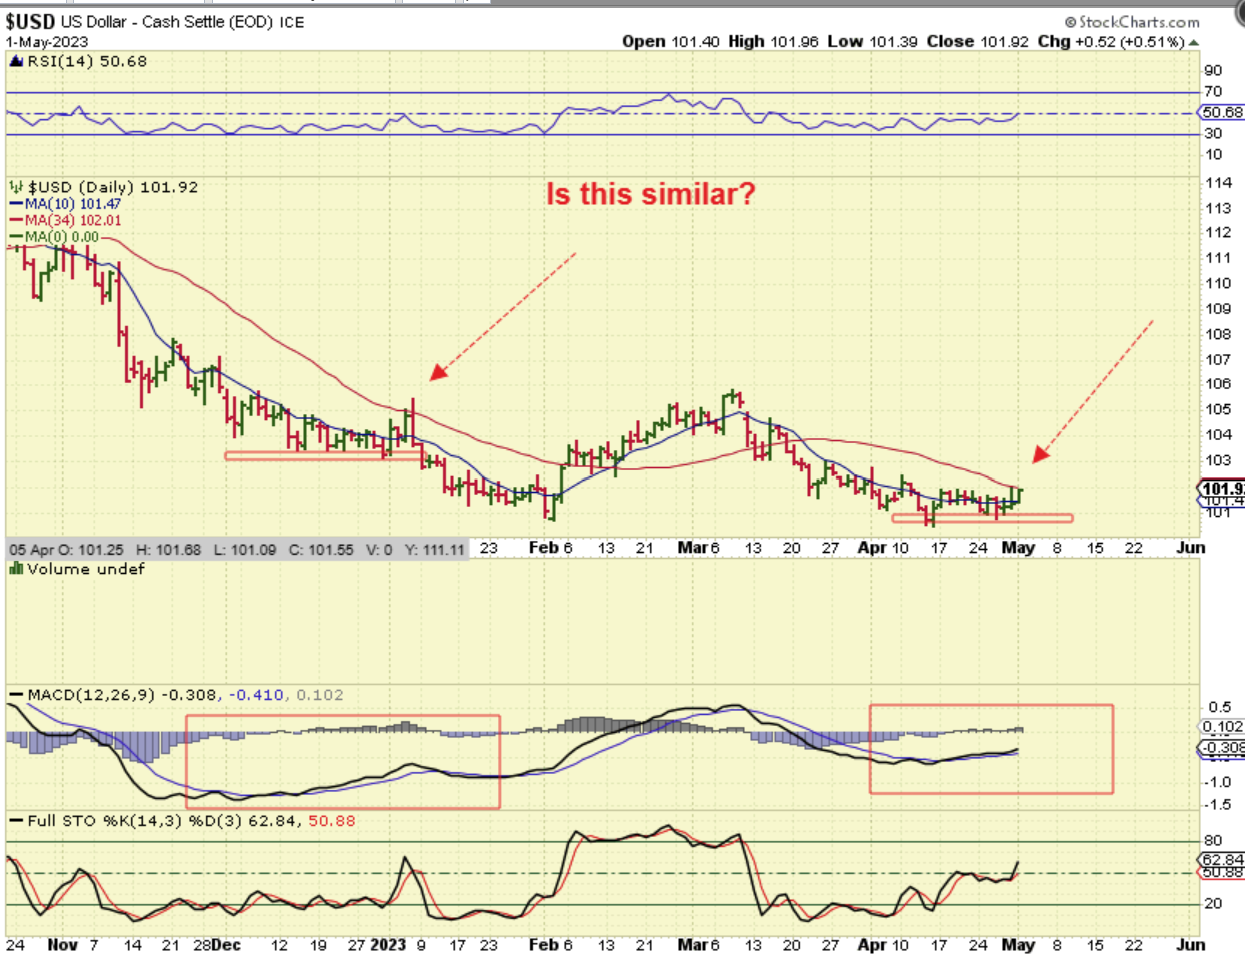
The USD is tricky:
.
It did push higher on Monday, but it still looks similar to the pop in January that we saw so far too. That pop also gave us divergence with the MACD, but then it still sold off and bottomed later, with even stronger divergence. We have 2 things to note with the USD:
1. What will it do Post Fed? Is it gaining strength or not, and
2. If it does run even higher, can Gold & Silver ignore it & run higher too, or not?
So let’s look at something else…
.
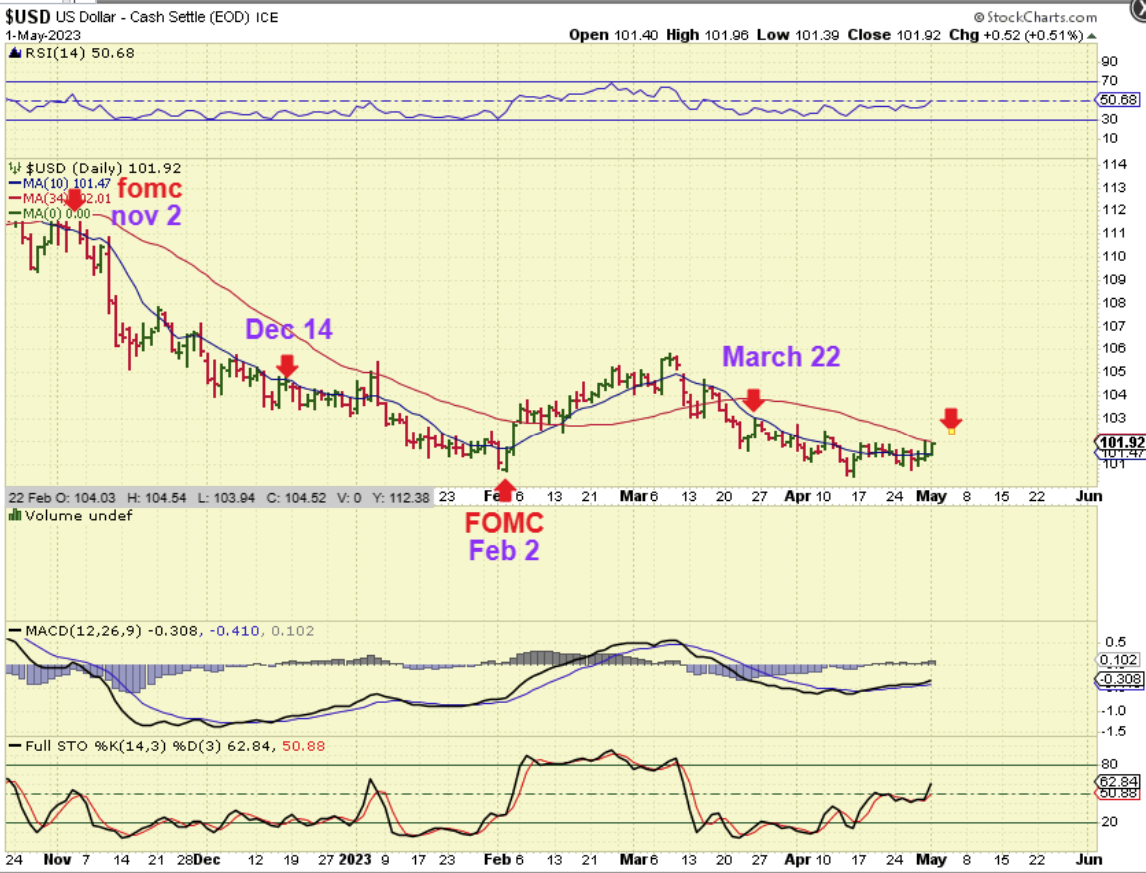
I thought that it would give us some insight to look at The USD with the recent FOMC dates. Guess what? I’m not so sure that it did. 🙂.
1. The Nov Fed Mtg was followed by a sharp sell off after a rate hike.
2. The December Mtg continued the selling with a rate hike, but it was at a slow choppy pace.
3. February 2 was an FOMC mtg where the DCL for the USD was due, and it actually rallied right out of that Fed 2 meeting & Gold peaked & began to sell off into what I predicted would be an ICL in late March or early April.
4. With the March 22 Fed Mtg, we saw a smaller rate hike after Banks collapsed, and the USD Popped heading into that mtg, but then it sold off too.
5. This week the MACD is rising and it looks bullish, but 3 out of 4 of the last Fed Mtgs saw the USD rise heading into that meeting and then sell off .
.
I lost some money yesterday and was even stopped out of a few newer positions with a loss, so I just wanted to show you that too. It happens to everyone, so let’s do a review and see what happened.
.
With that First Republic Bank Failing, EARLY TRADING WAS giving us that fast rally in Gold and Silver that I mentioned at the open of this report. Gold was up over $26 and Silver was up almost $1 premarket. It was announced that JPMorgan bid on and won the bid, they bought the First Republic Bank and that is possibly why things started to reverse (As you can see here). Gold & Silver sold off as the day went on.
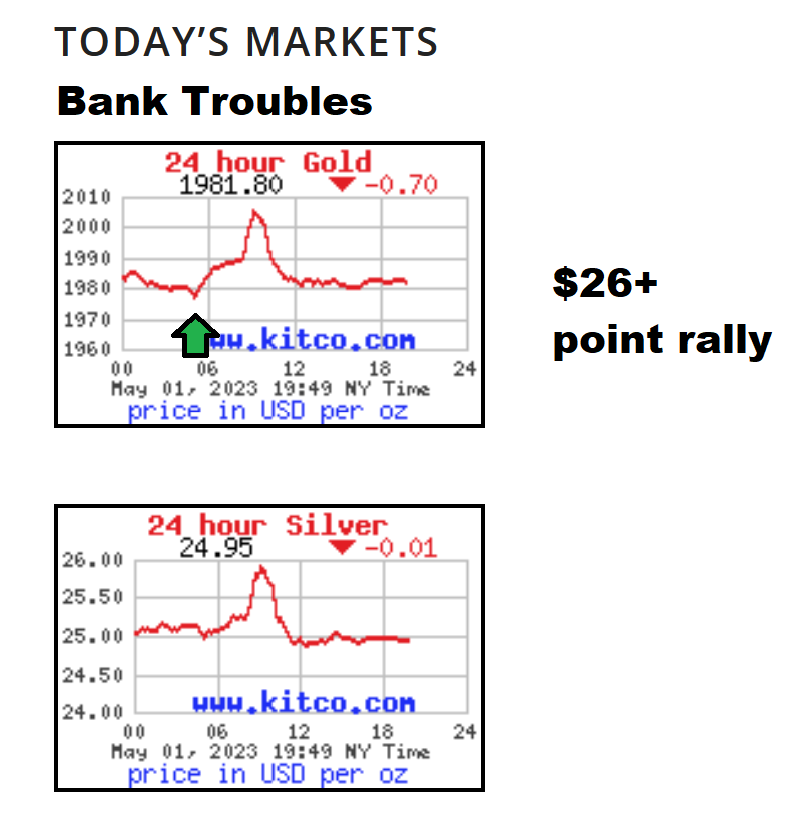
Well, that ruined my trades. Why? I was adding to my positions in premarket. In the past I have done that and done very well, but as you see here, Gold and Silver pulled back and just kept going…
.
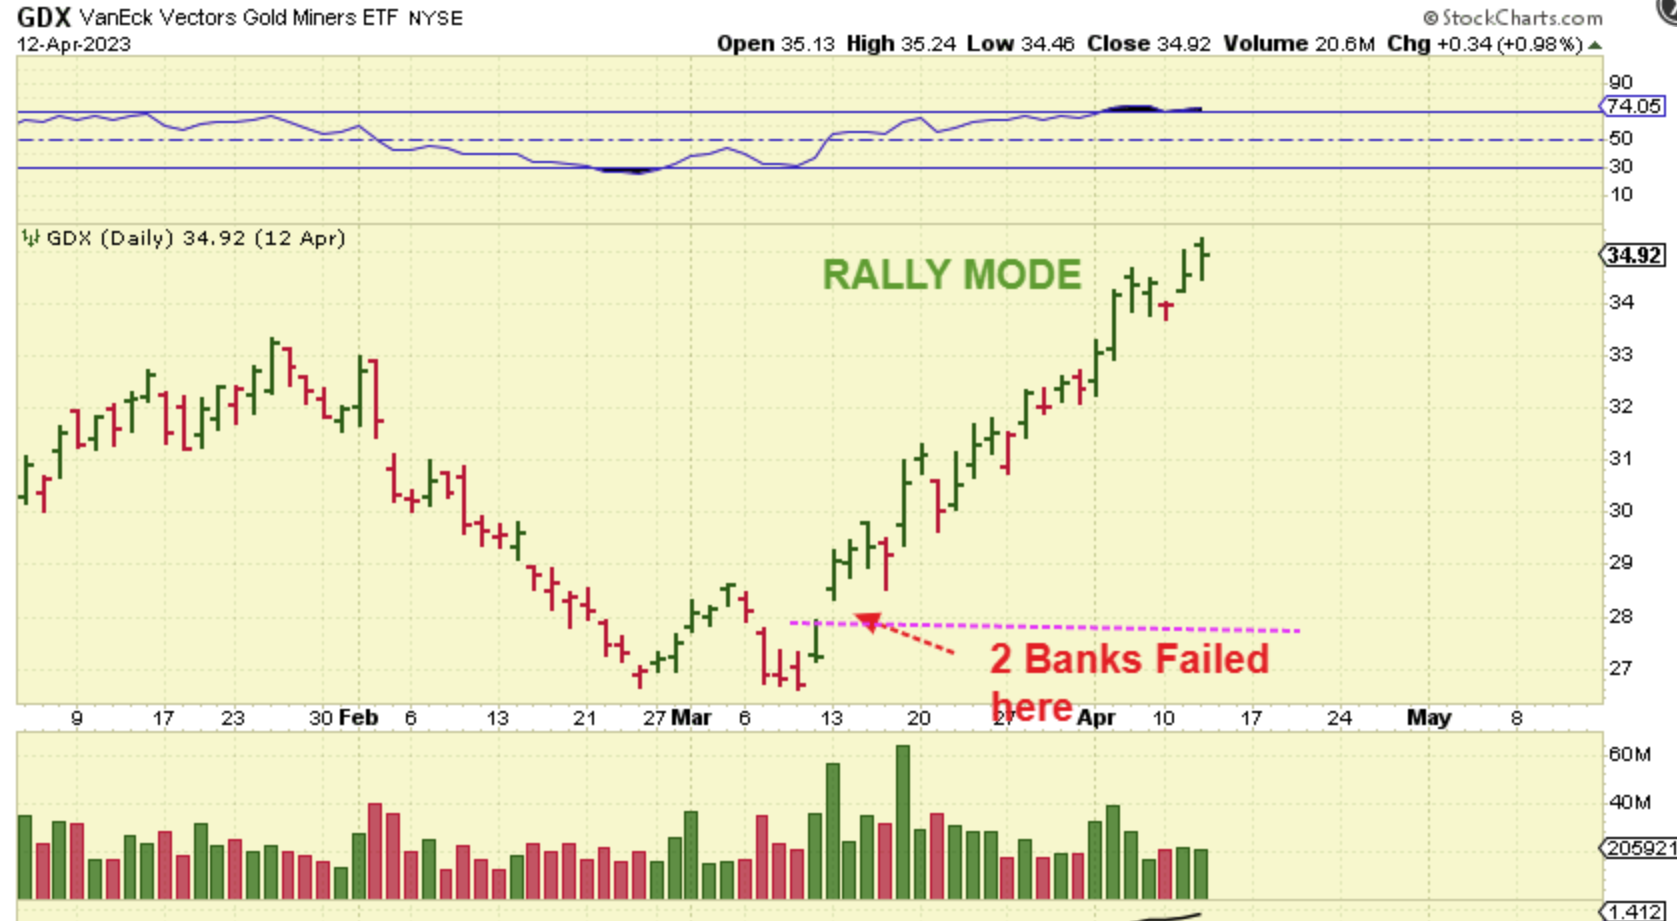
Like I said, I remembered that with the last bank failures in March, we were dropping into an ICL and everything suddenly Gapped open and RAN HIGHER. You can see that here. Notice that The GDX gapped up and hit RALLY MODE! Those gaps never filled, So I did some buying pre-market just in case we saw that again.
.
As seen at the opening of this report, SILVER was in rally mode when I was buying, so all looked very bullish…
.
And then I got my hand slapped!
.
SILVER sold off as the day went on, and so did the Silver stocks. This does still looks like a day 33 dcl, but since it is a Fed Week with volatility and we see a reversal candle, I had to make sure that I had some space between my buy point and price heading into the Fed Mtg. I stopped out of some newer purchases as a loss for that reason.
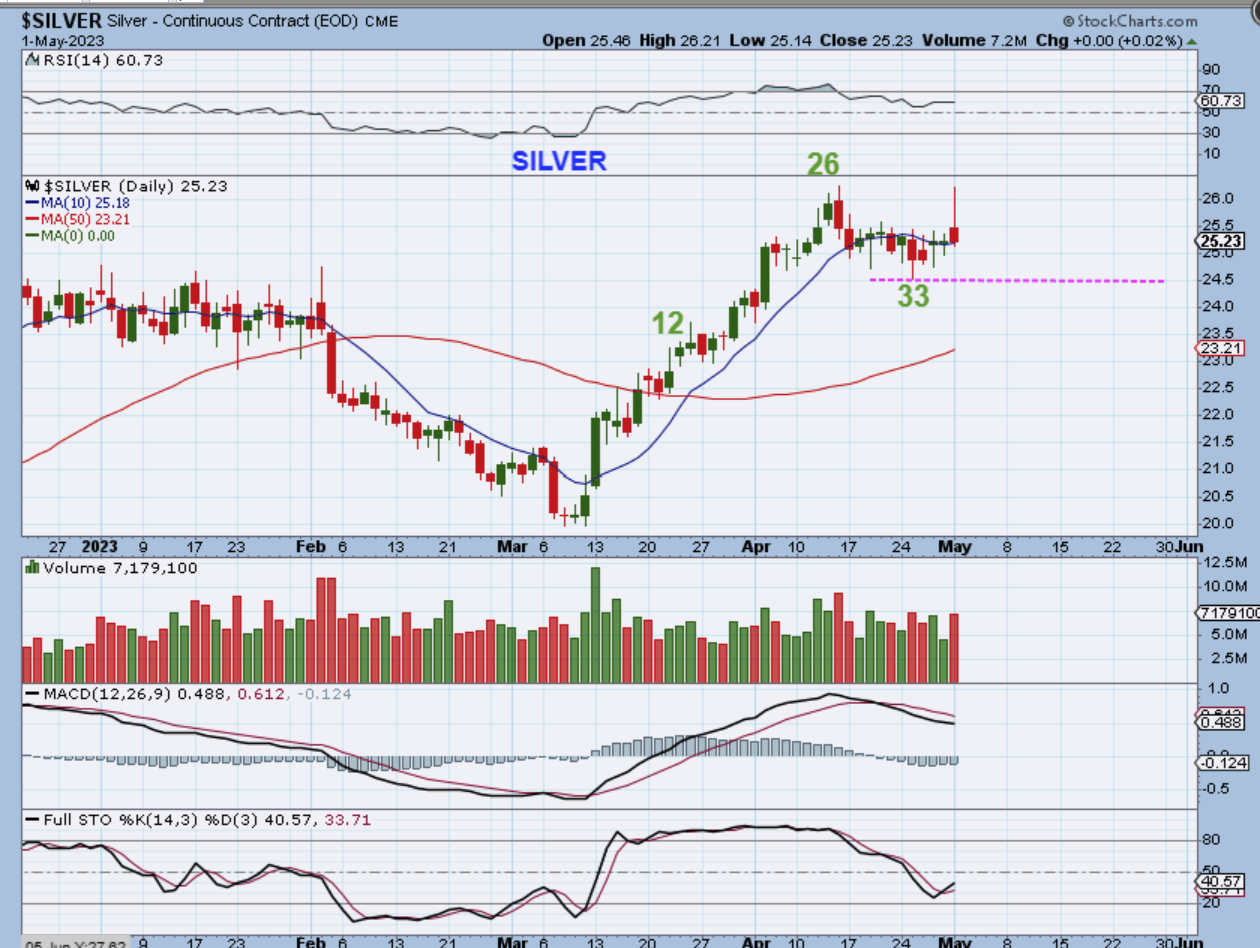
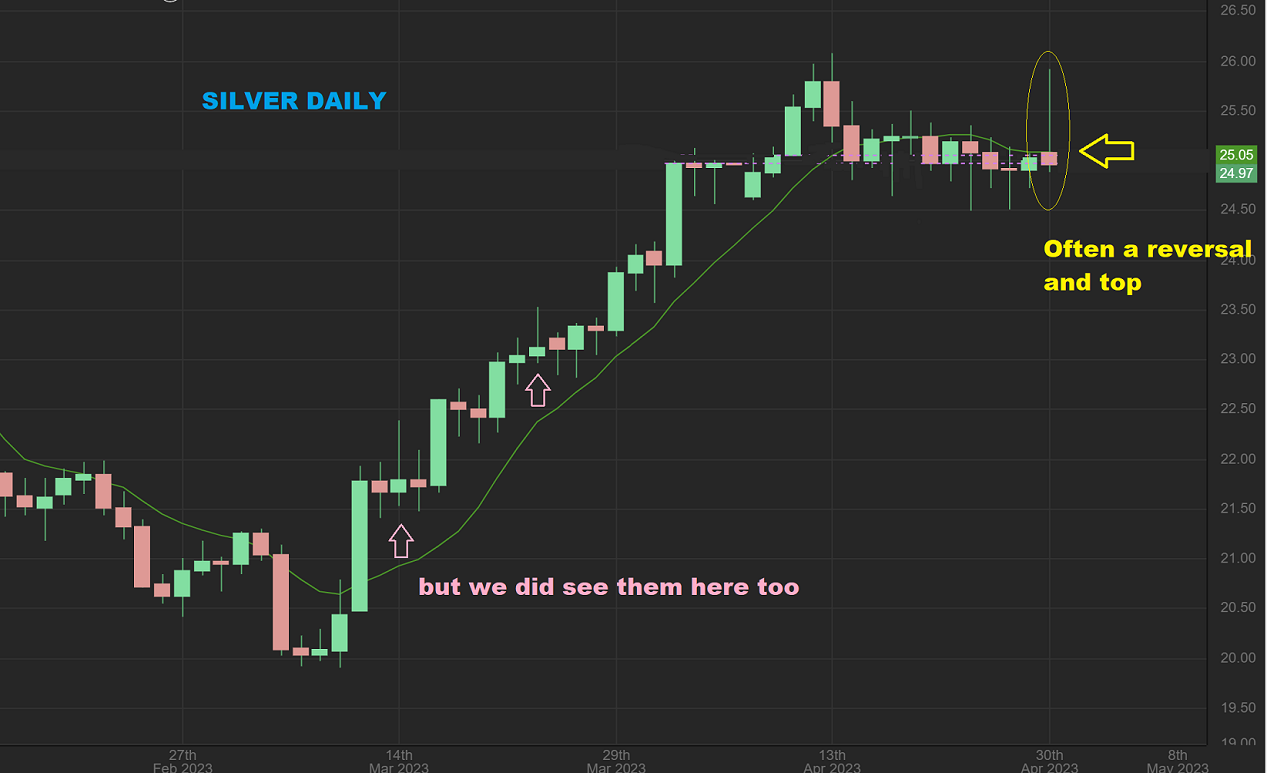
So like I mentioned, SILVER is a reversal candle and they can lead into a sell off, but take a look at the last strong run higher. My pink arrows are pointing to similar reversal candles, but it didn’t lead to a lasting sell off. Silver simply paused. Silver still could have that day 33 dcl in place heading into the Fed.
.
BACK TO SILVER: The chart remains bullish and is due for a dcl timing-wise, possibly already having one in place at day 33. We are heading into the Fed Mtg this Wednesday, and I couldn’t be fully loaded up with the risk of high volatility involved.
10 a.m. ET:
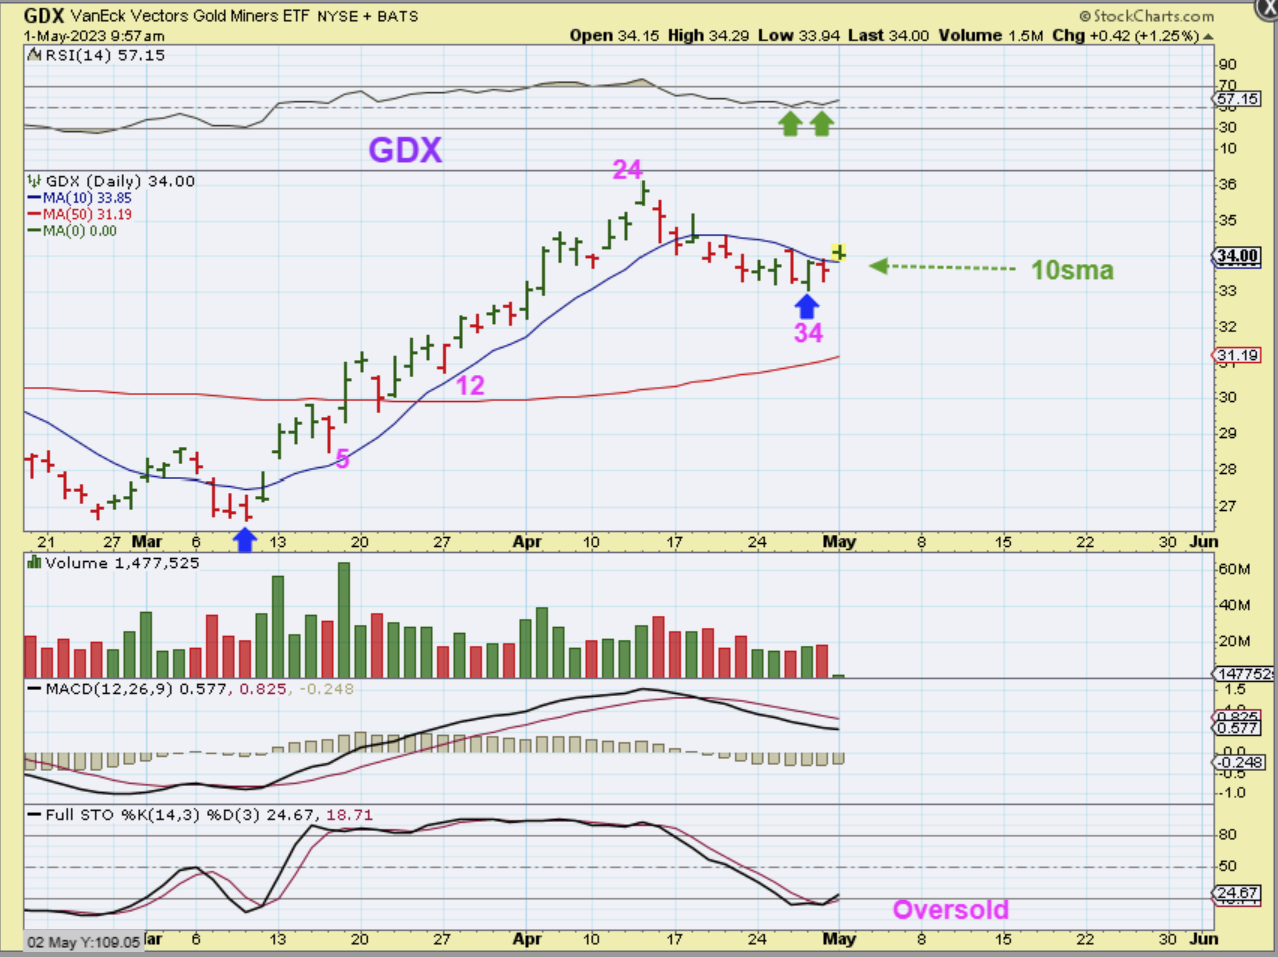
So The GDX ETF and Miners did Gap open, so guess what I did with this gap fill to the 10sma? Yes, I bought GDXU looking for it to reverse higher. Again, we are due for a dcl and this was above the 10sma, so that justified the buy, but it is also jumping the gun since I usually look for a close above the 10sma. This was 1/2 hr into the trading day, so I went to a full position in GDXU too, with a fairly tight stop.
MIDDAY:
GDX sold below the 10sma, I still didn’t sell GDXU immediately when it dropped, because this could easily regain the 10sma and it was above what should be the dcl. JPMorgan did buy the failing bank though and I did sell shortly after this, because GDXU travelled from $59 to $54. I bought near $57 & lost $2 per share and chose to sell ‘Just to be safe’. I can always get back in later.
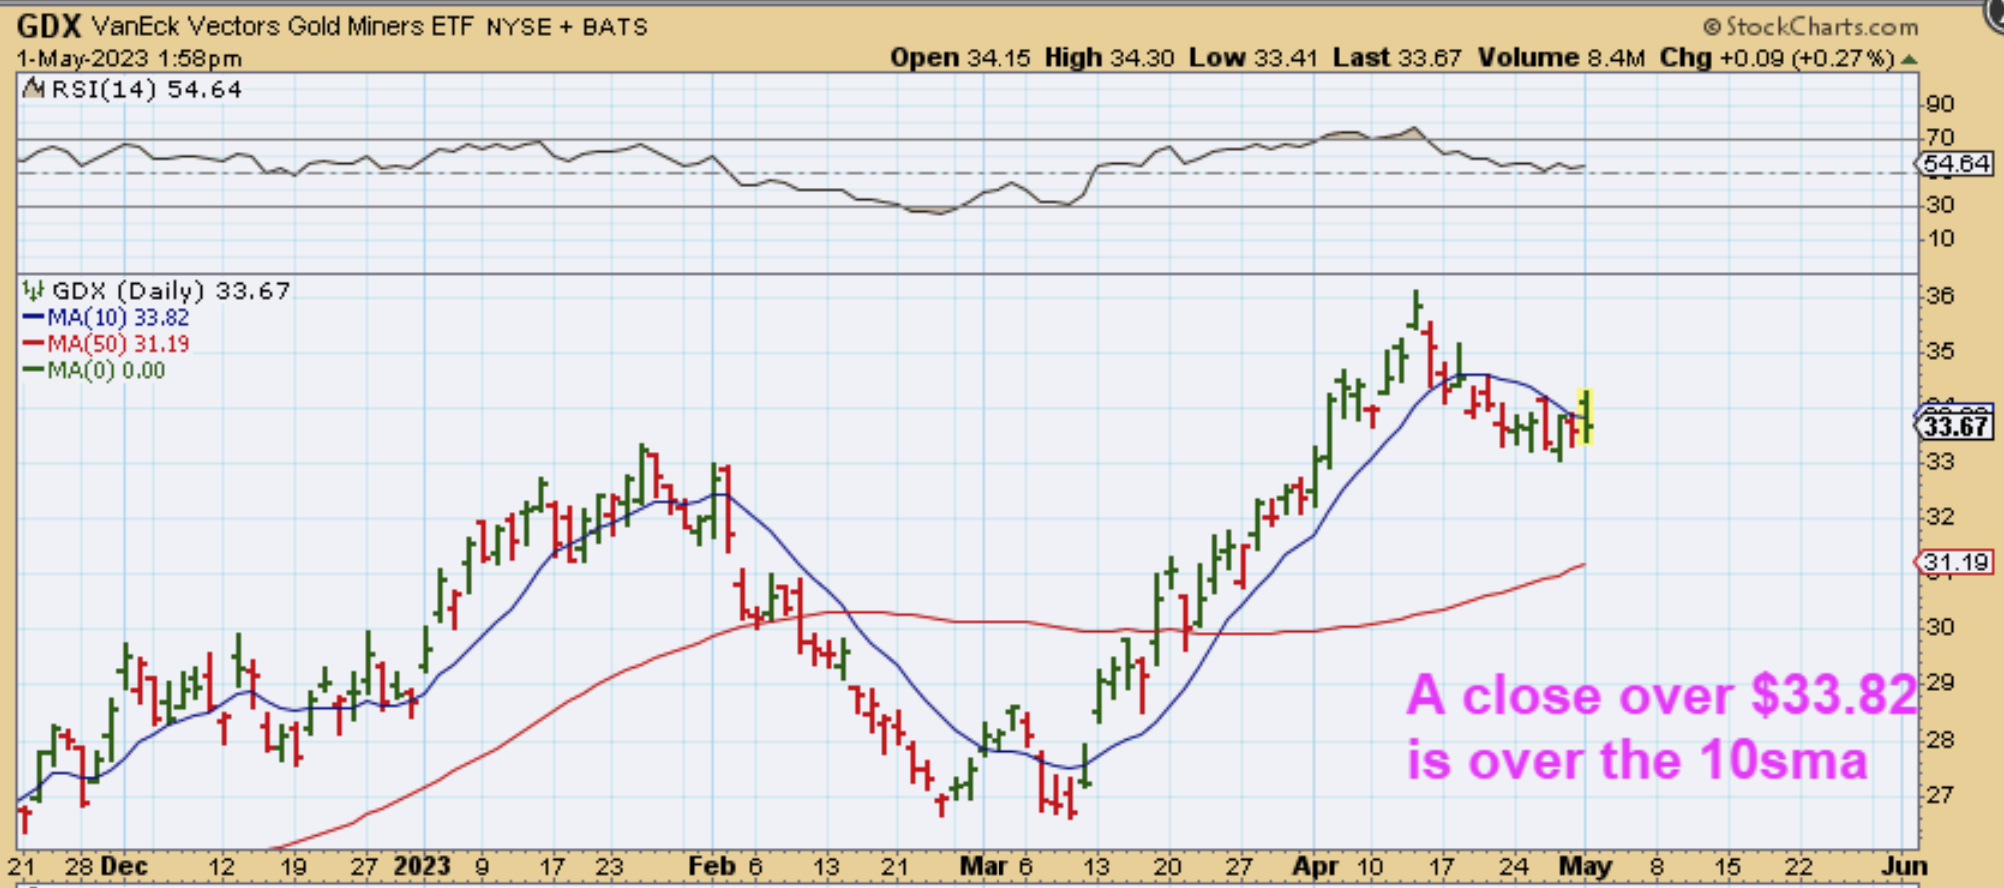
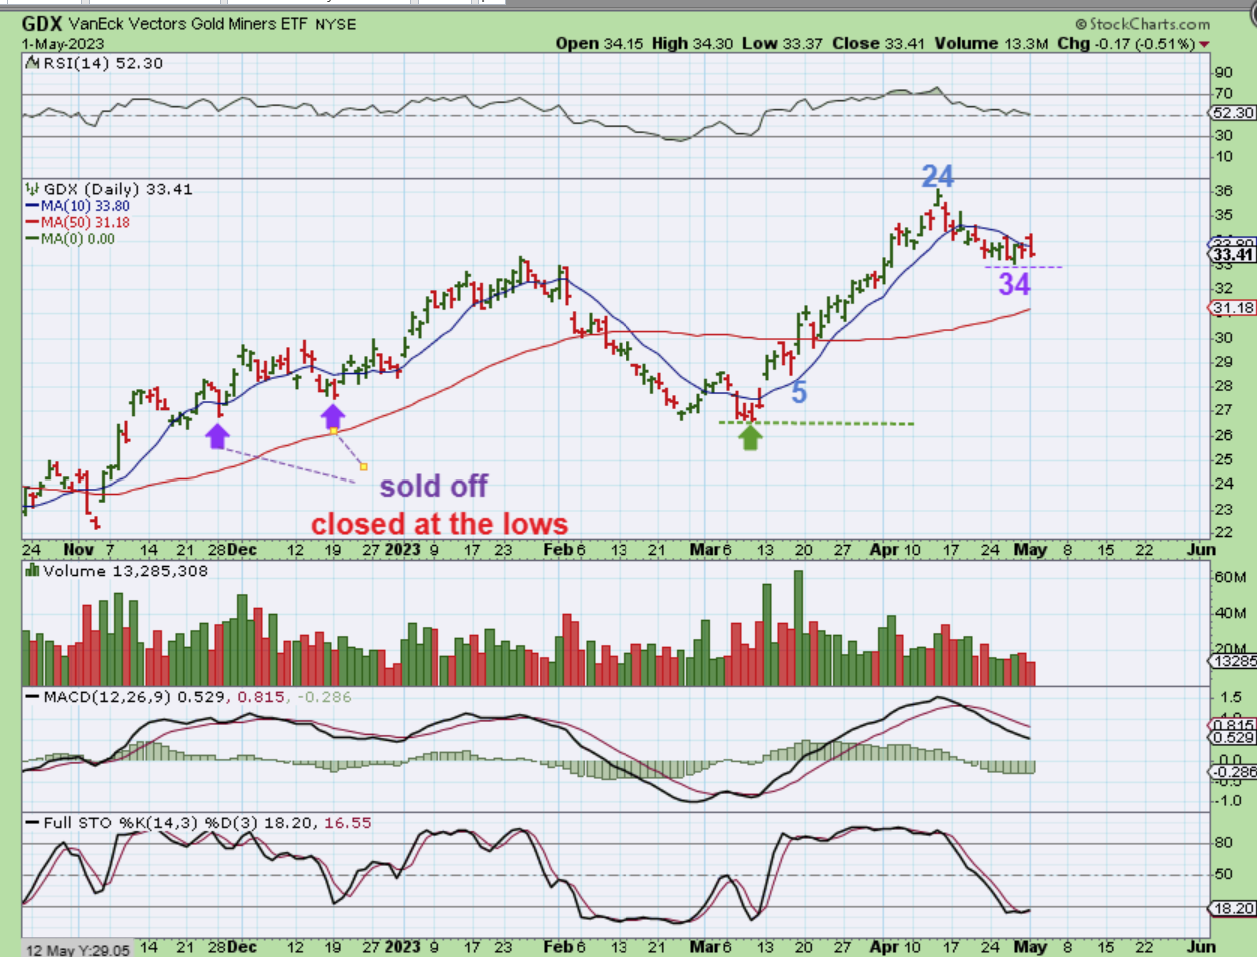
GDX closed below the 10sma. This still is NOT a bad chart at all for Miners, but above I am discussing Leverage and the Fed Mtg risk of volatility. Miners often overshoot what Gold or Silver does too, so I needed to be careful. When I own leverage and I am in a sell down day, I like to exit, clear my head and my bias, and rethink the next entry.
This GDX chart remains bullish, and I would expect it to rally higher soon (after the Fed mtg?). it is oversold.
.
So in todays report, we basically still have the same set up with Gold and Silver, but Monday just gave us one of those Pop & Drop days in the precious metals. I wanted to walk you through my trade with the Bank Failure to show you that anyone can buy and get stopped out for a loss, but it really doesn’t change what we have overall on the charts.
We are heading into the Fed Mtg on Wednesday though, and that day often has wild volatility, and I didn’t want to ride that out with prices below my entry. Today may be a day of patience and just seeing what the markets give us for a set up going into Wednesday. The USD appears to be gaining traction, but we have seen that in the past right before the fed mtg, and that may be short covering before the Fed. We’ll see. If you are trading, enjoy your Tuesday trading!
.
~ALEX
.
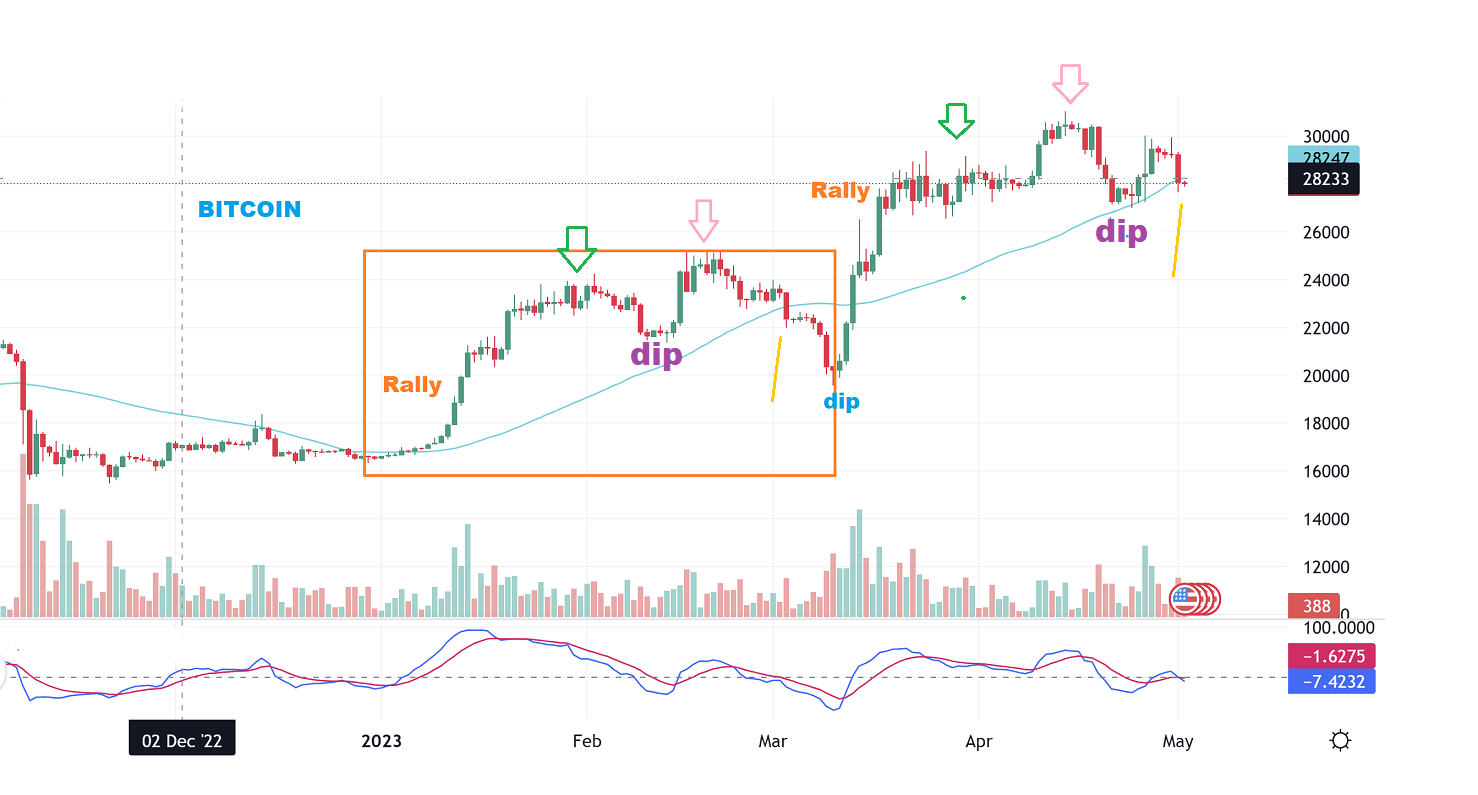
I took a look at Bitcoin after yesterdays dip and even though it landed at the 50sma(possible support), I couldn’t help but notice the similarities in the way it is moving. I marked the similarities here. With the General Markets possibly putting in a triple top and ready to pull back into a dcl, it may cause Bitcoin to pull back too. USE STOPS if you own crypto stocks. The Fed Mtg tomorrow could cause selling in the General Markets.