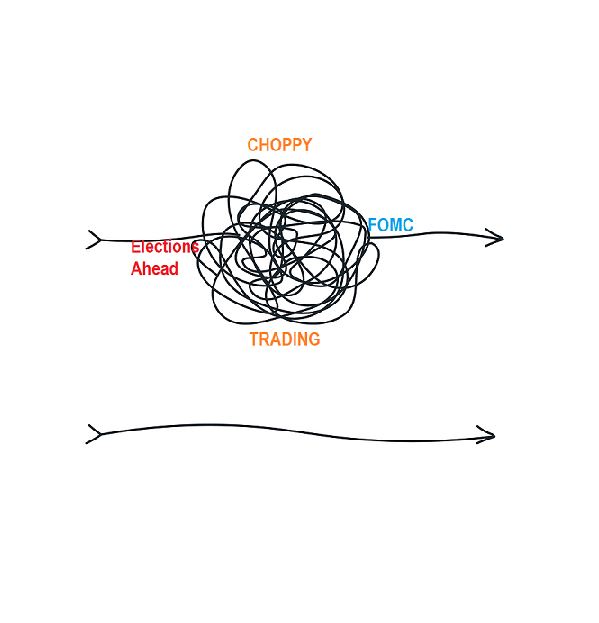
April 27th – Events from DCL to DCL Can Give Us Choppy Markets
I wrote most of this report late on Wednesday night, but I slept to 7 am ET, so I need to grab a live Bitcoin chart and then release this around 7:30, so please excuse typos. I will go back after I release it and fix mistakes and then refresh the page. Thanks!
.
The General Markets, seen here using The SPX, continued to sell off. It should be noted that the last 2 drops into a dcl did break below the 34 sma (& the 50 sma too). Also, we do have time to chop & drop into the Fed Mtg next week. So I’m thinking that…
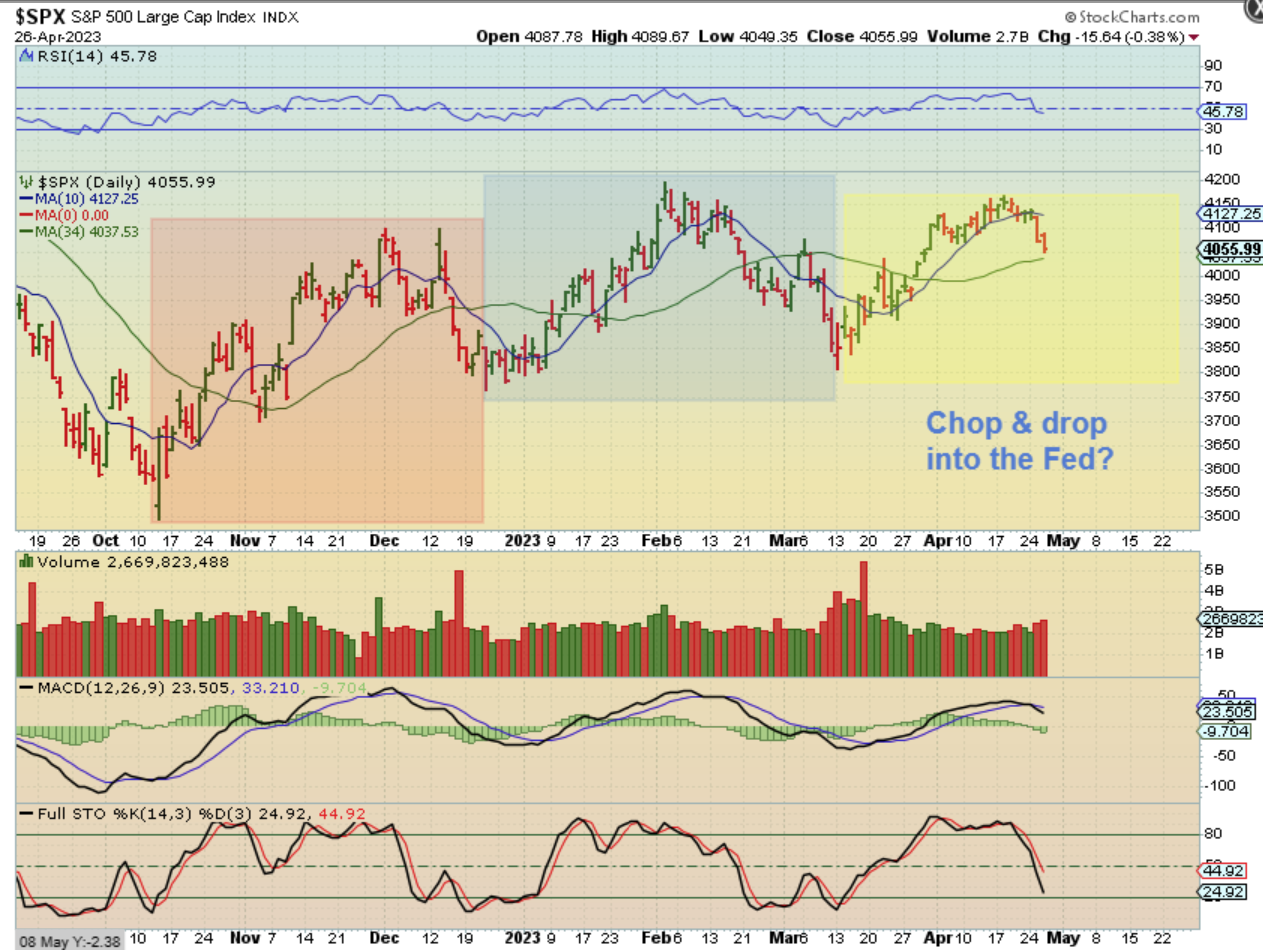
So I’m thinking that we could see a break of the 34 & 50 sma, bounce for a back test, and then a dcl to that trend line? This is just a guess at this point, since we do have time to chop & drop further.

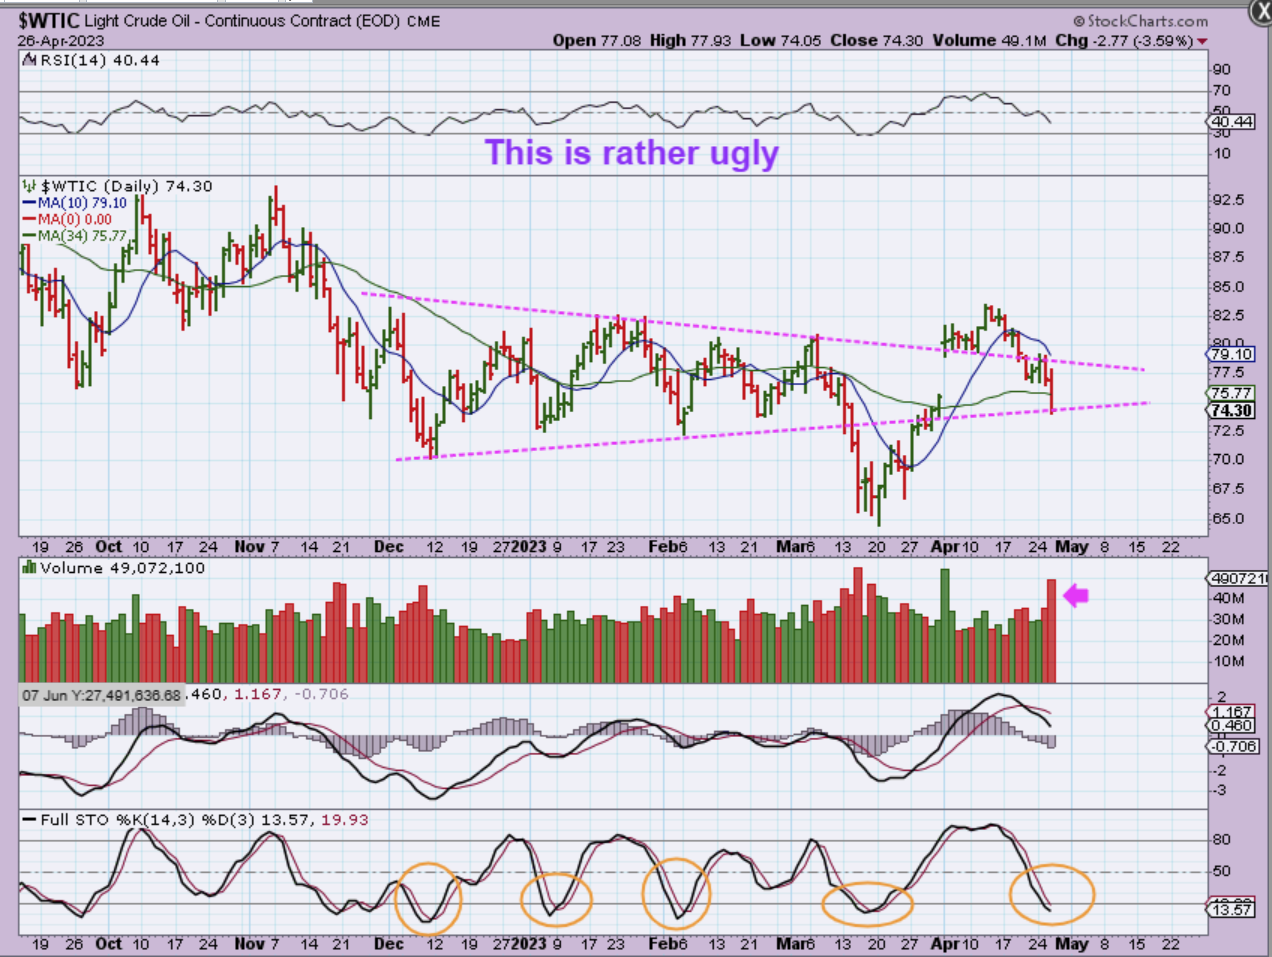
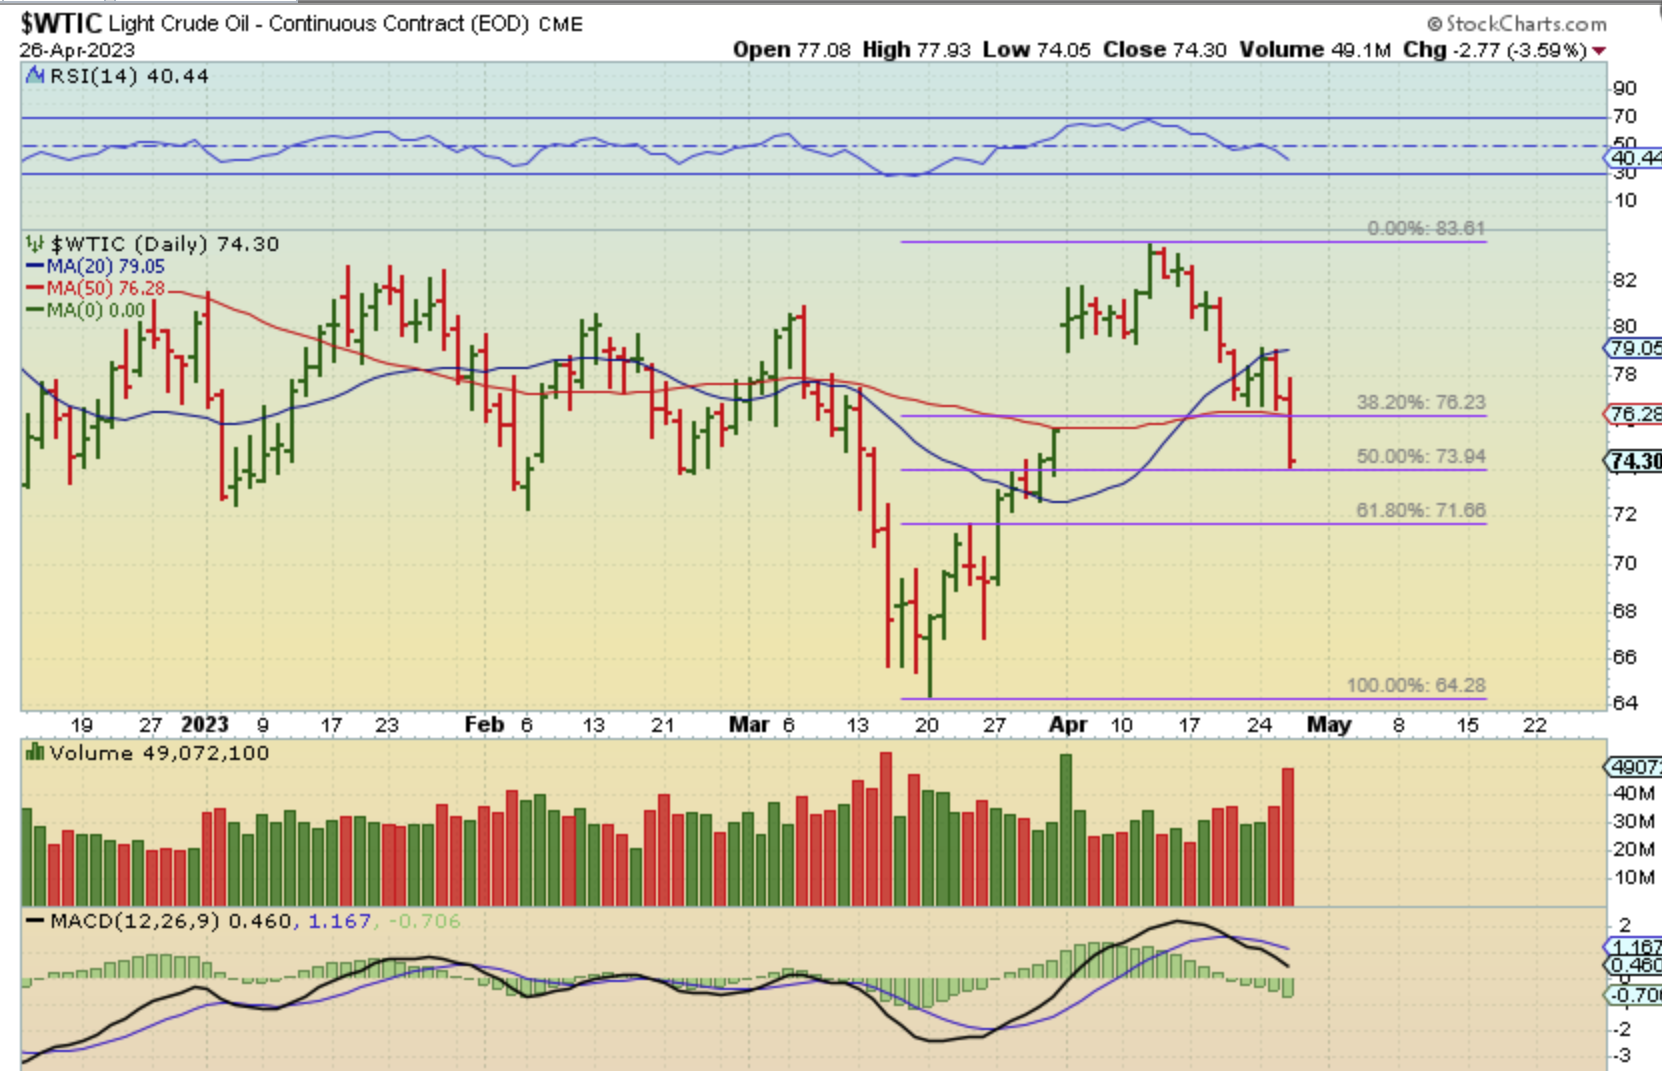
WTIC – 3 weeks ago Oil gapped open with the announcement from OPEC that they would be cutting production. I expected price to hold up better, but we are now at the lower trend line. Let me show you something else…
.
Let me show you something else.
.
So far the drop might appear to be a normal 50% dip, but the Volume did pick up and the drop yesterday was a big 3.5% drop, and the RSI lost 50%, so this is a bit more concerning than just a normal 50% dip. This needs to turn higher soon.
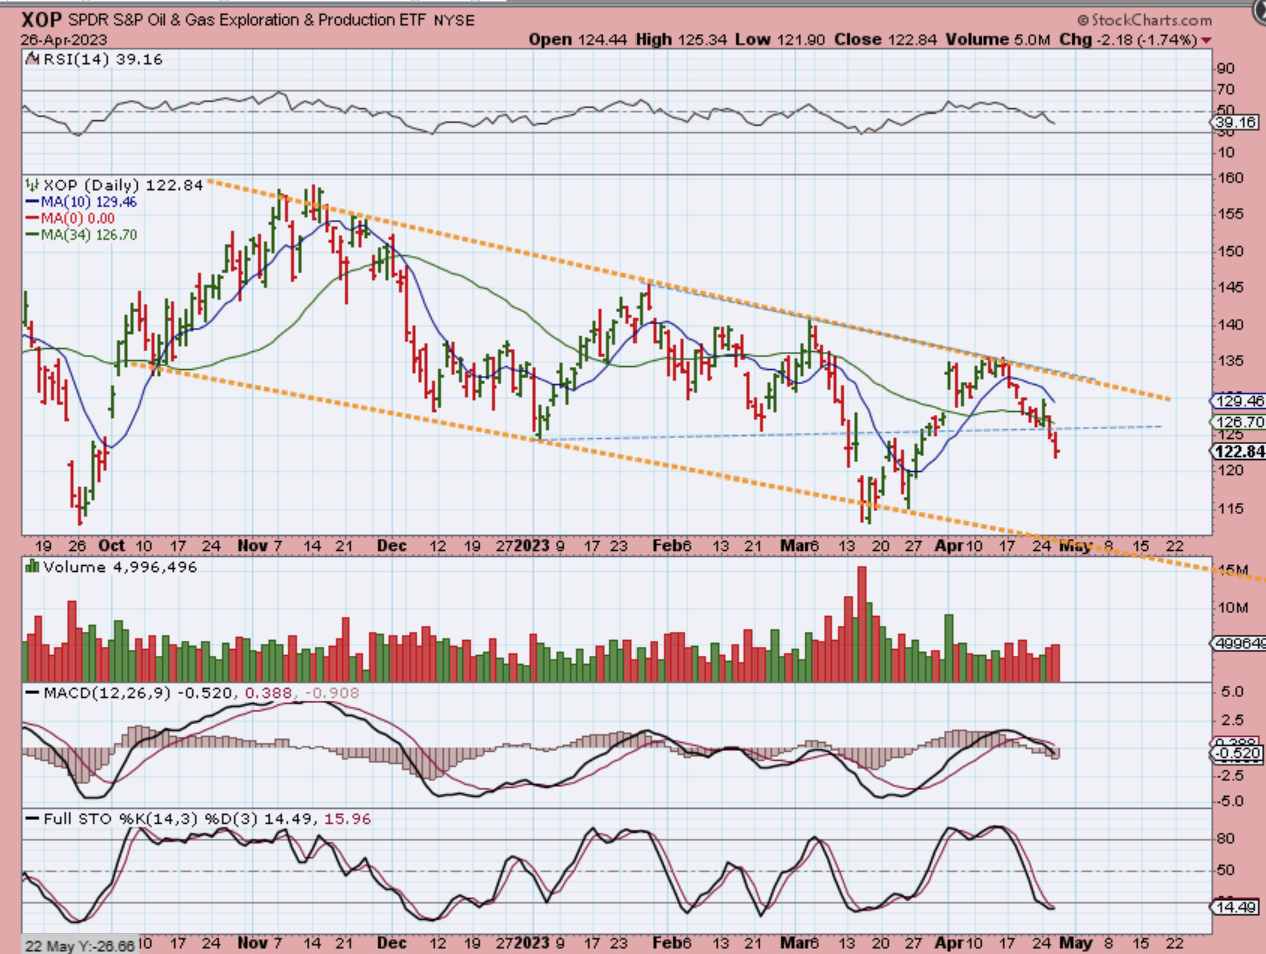
THE XOP pretty much had to sell off yesterday with the General Markets and Oil Selling down. Unfortunately, this down-channel was never broken. Is this also a 50% dip?…
.
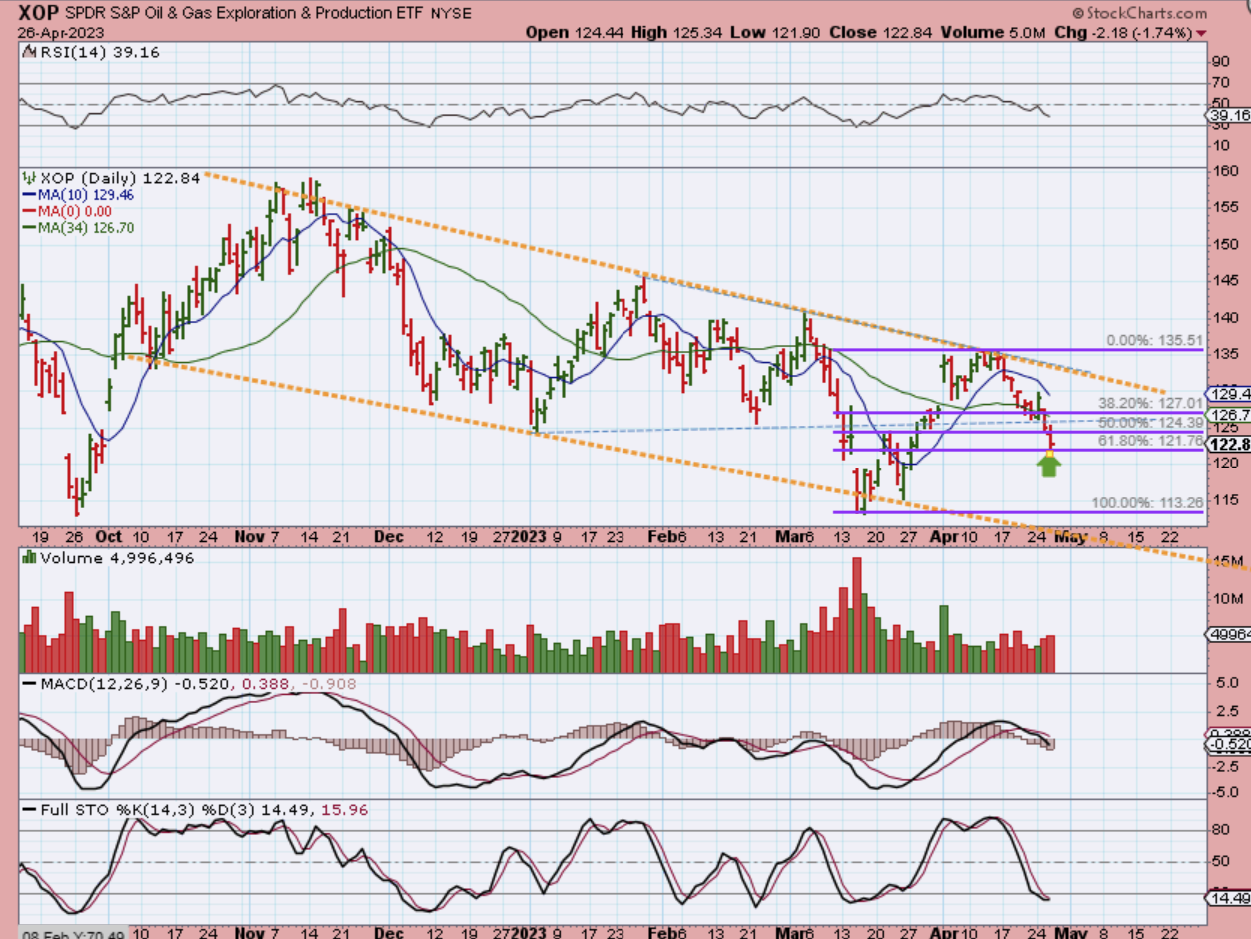
The XOP is a deeper 61.8% Fib drop so far, and this downtrend did not end with a breakout yet. The MACD is now crossing lower here too. I was looking to buy NOG at the back test of 50sma for a possible buy and hold on a breakout, but now I have my doubts with the General Market having more time to sell. This could dip to the lows again, since Oil and Oil Stocks have been sideways chopping for quite a while.
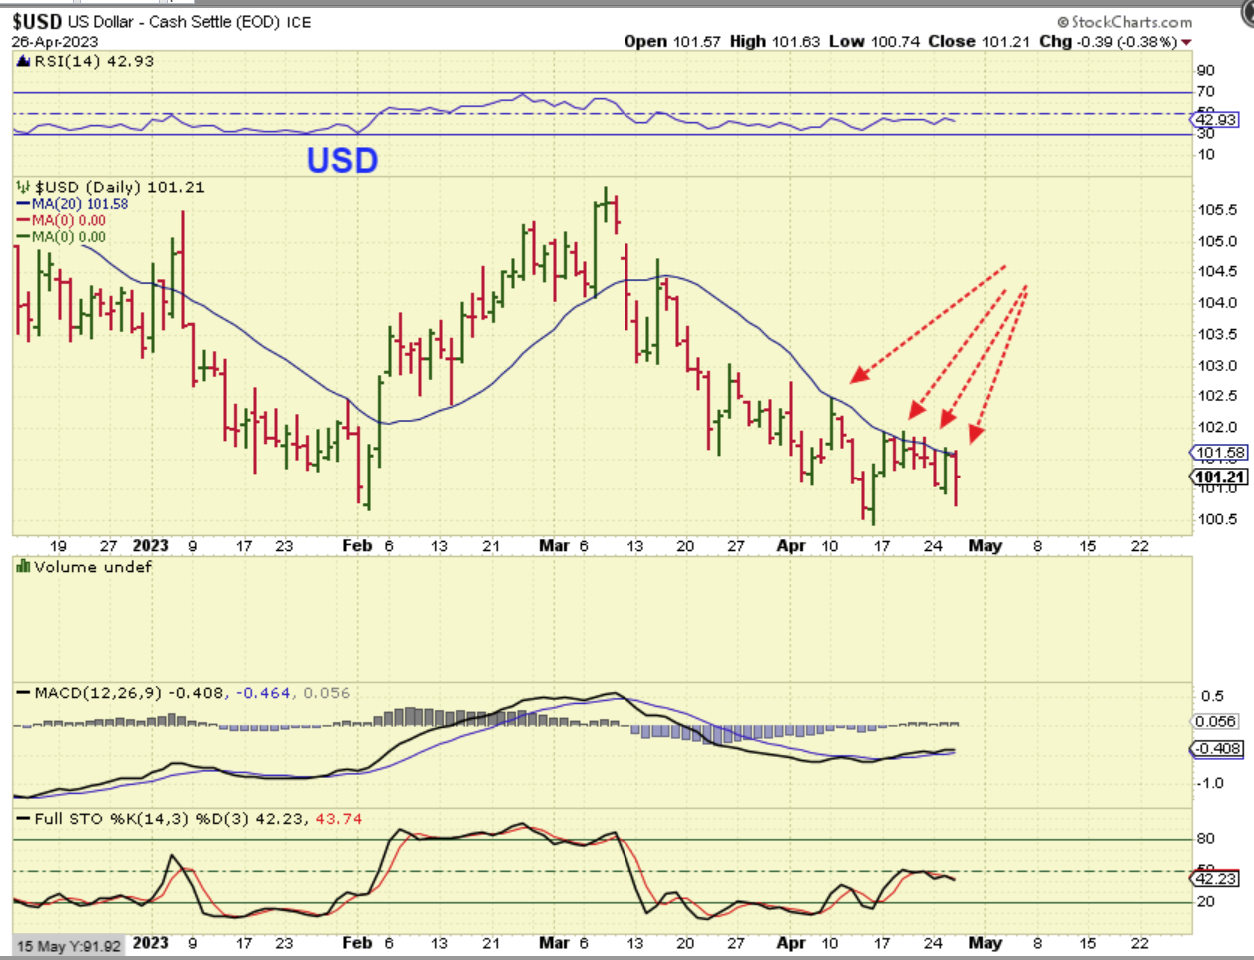
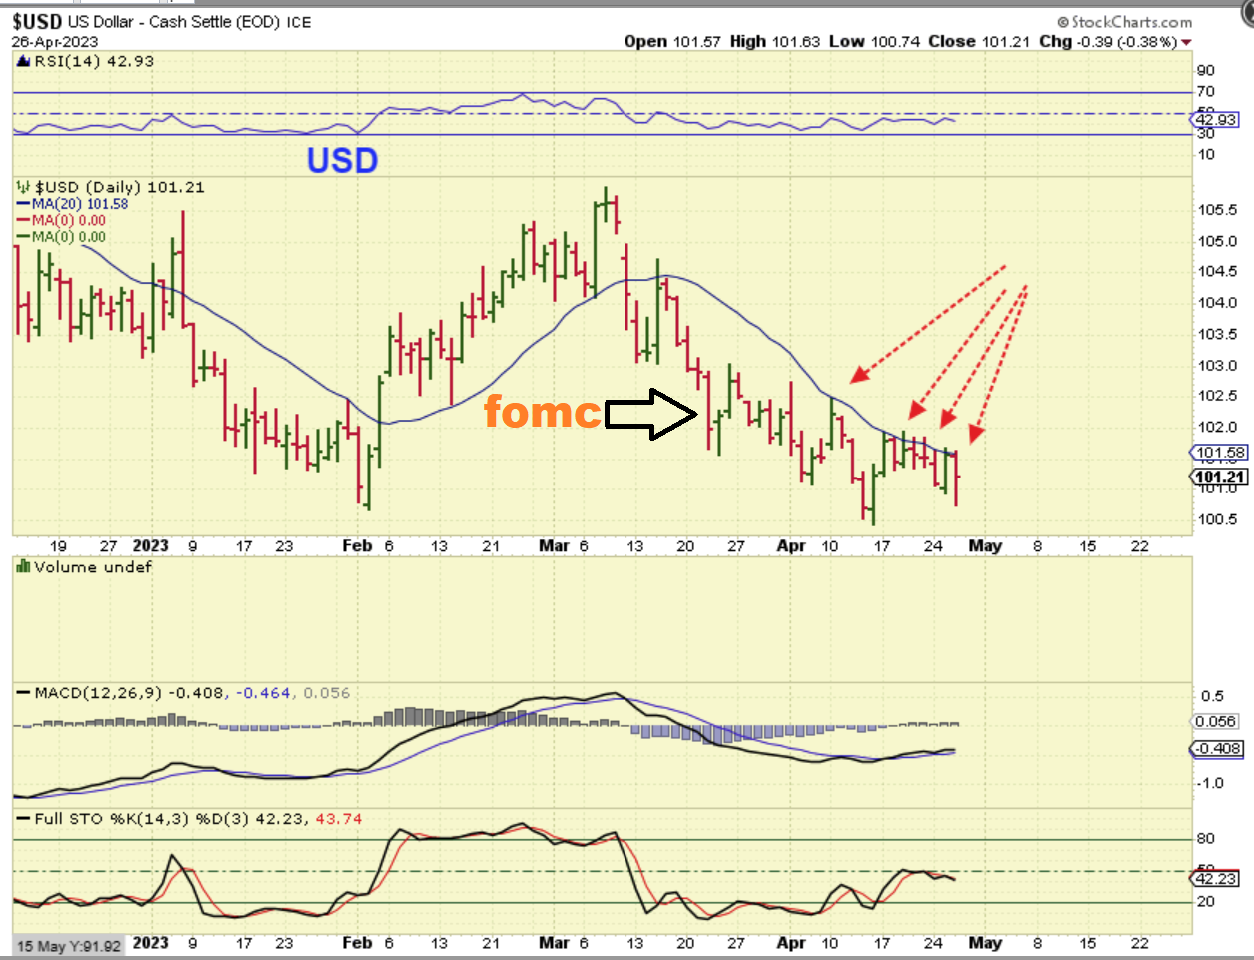
THE USD is choppy and that just seems to be affecting everything else.
.
Just in case you are wondering what happened at the last FOMC Meeting, THE USD dropped on Mon-Wed and closed at the lows on Wednesday, March 22. It then bounced on Thursday and Friday, but sold off in a downtrend since then.
.
With Gold I have been saying for a while that:
It may be good to remember what I said about the similarities between Golds last run and now. I was trying to show you (us) that Gold may be choppy as we head into the Fed Mtg, because it was choppy after the first strong rally, triangle, and then chop.
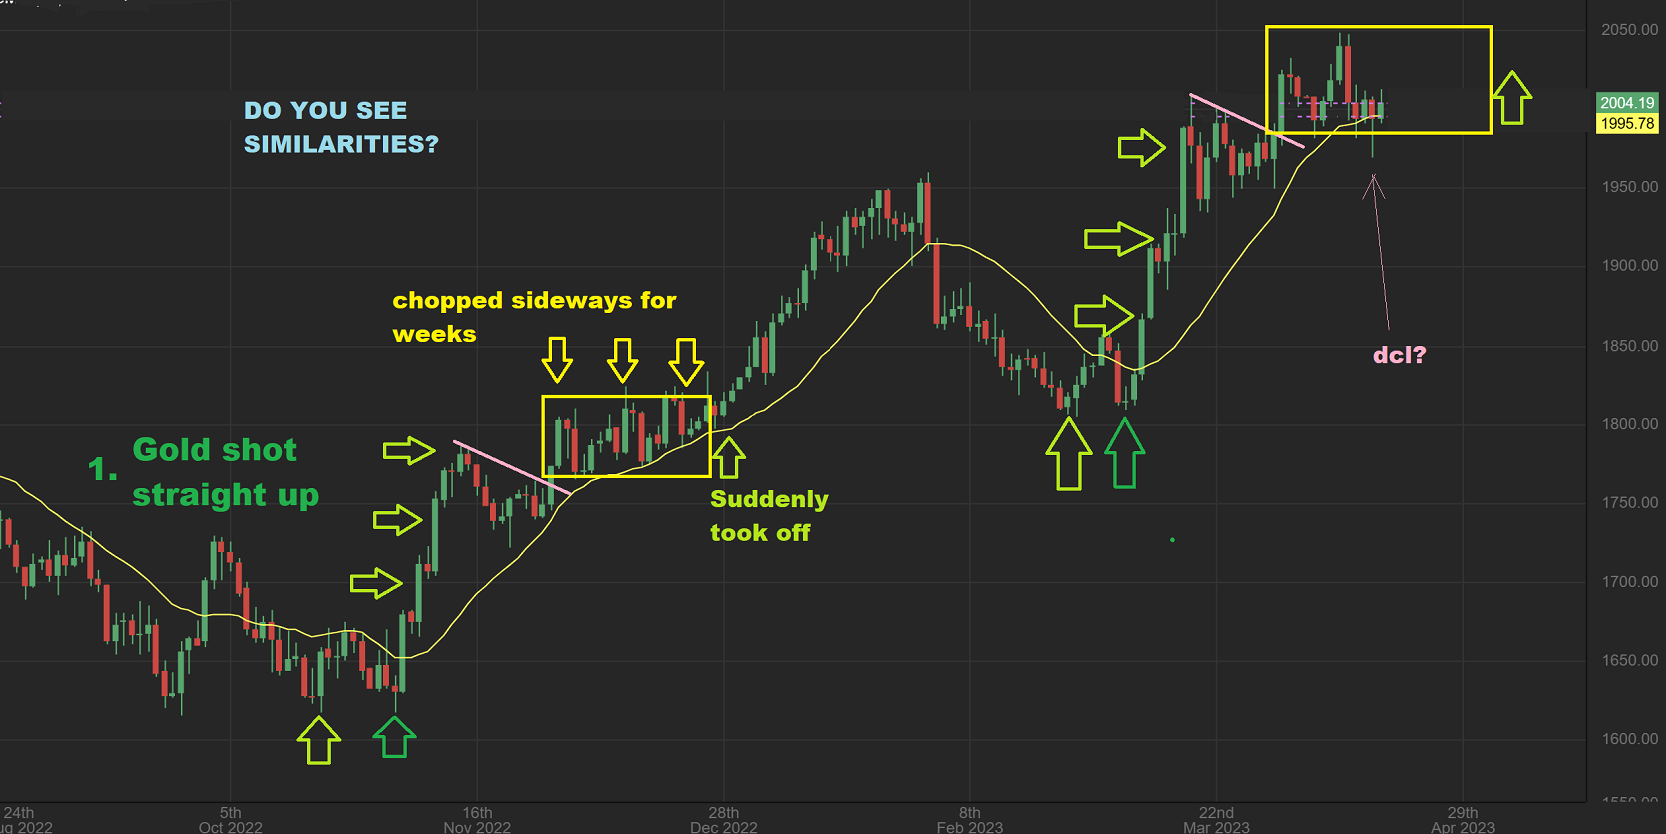
GOLD does just continue to chop sideways (that is frustrating, I know).
It still has the low on day 37 and that really should be the dcl. So Gold is simply chopping sideways at this point, and that MIGHT continue into the Fomc meeting.
.
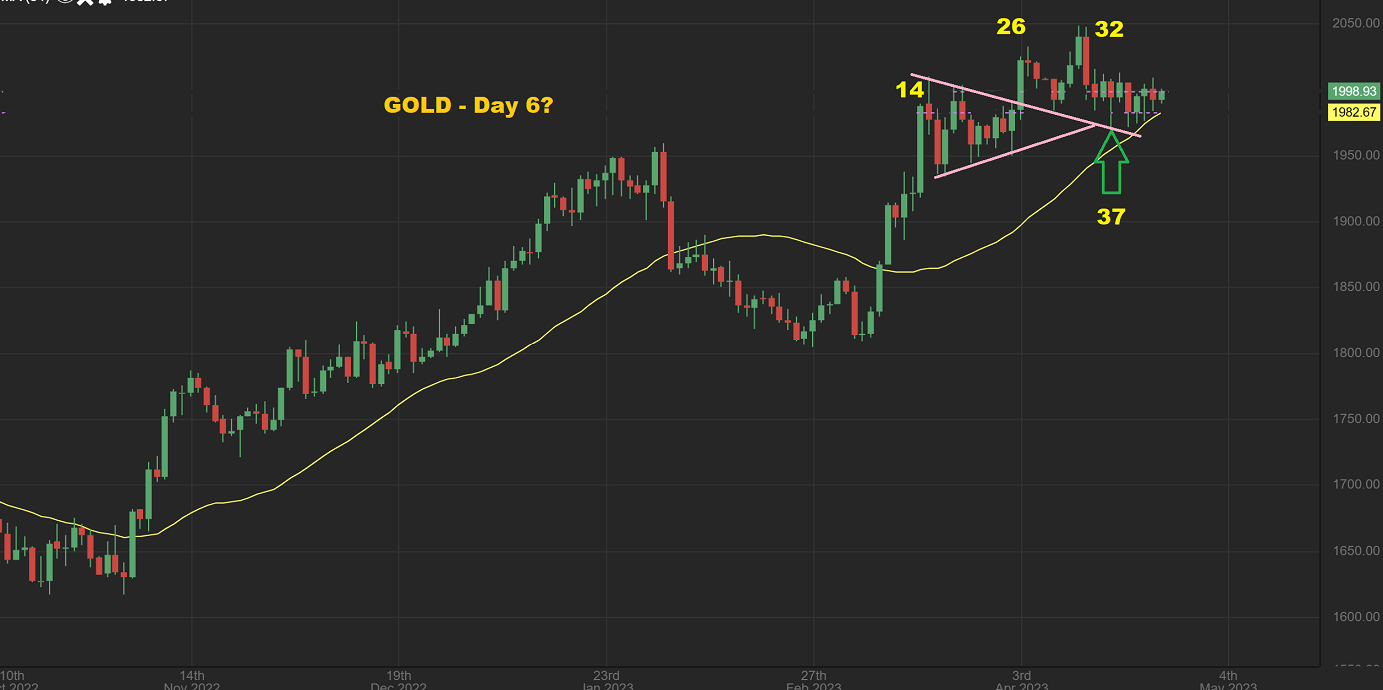
In case you were wondering, The March 22 fomc day for Gold was the week that the Triangle started. Day 14 seen here was the Friday surge before the Fed mtg. Gold dipped on Monday & Tuesday, ran up on Wednesday and Thursday, but then the triangle formed that week and the following week. It then broke higher and has been choppy ever since.
.
I should mention that conditions are different this time.
.
If you recall correctly, that strong surge into the Fed meeting was when the 2 Banks failed, so that run higher move into day 14, which was the Friday before the Fed Mtg, was actually bank failure and included discussions that the Fed may not even hike rates anymore.
Basically: Gold has chopped sideways ever since the Fed Mtg of March 22.
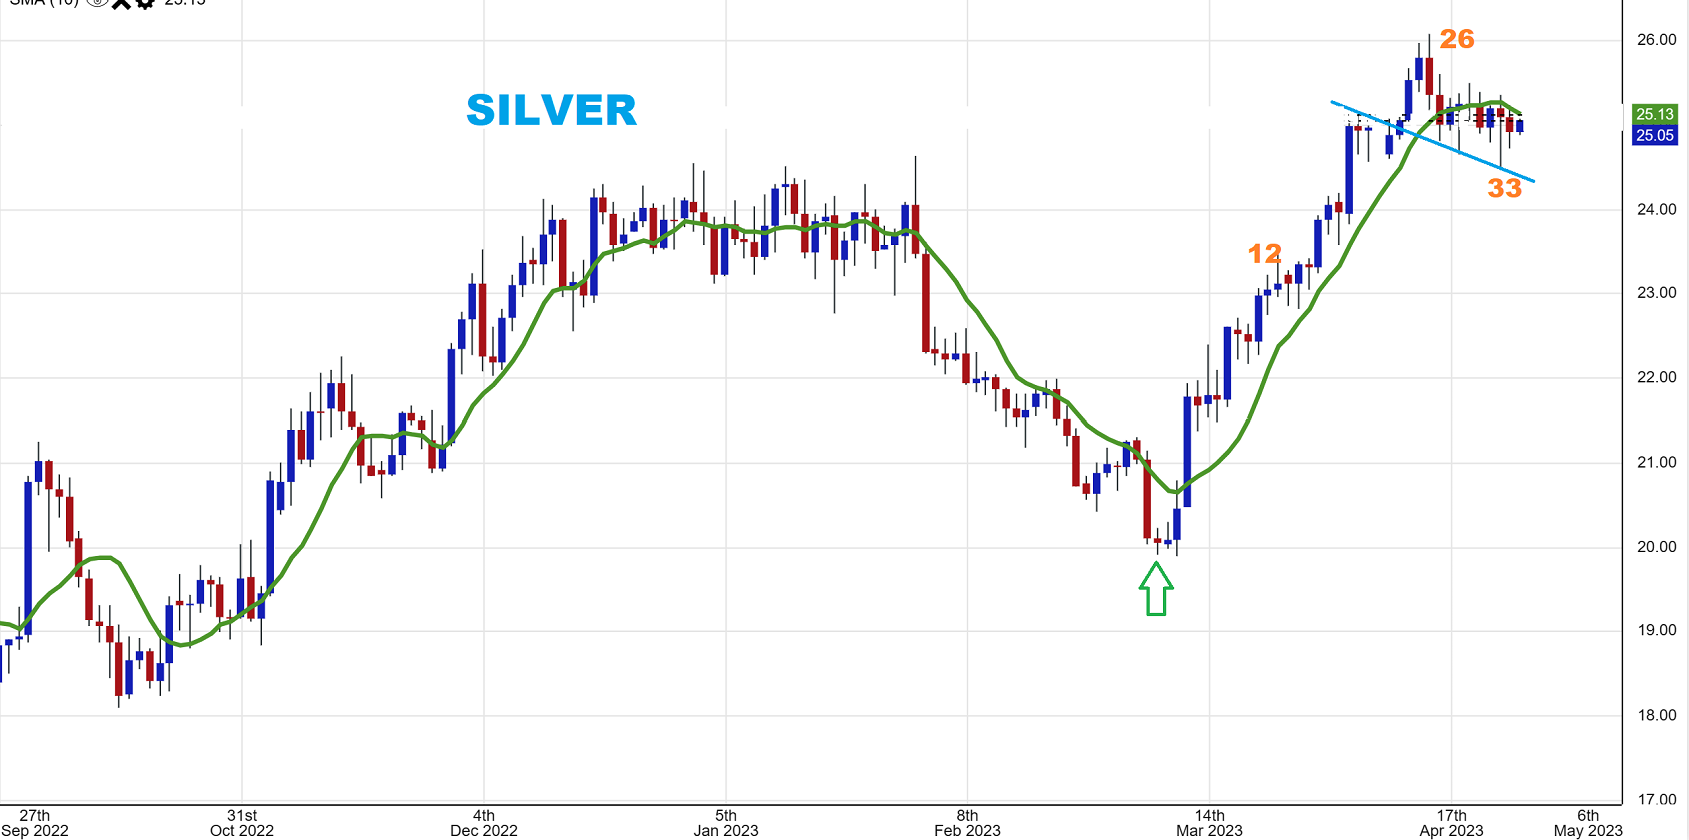
SILVER has also been chopping sideways ever since the Fed Mtg of March 22. These are consolidating that strong run higher when the 2 banks failed and day 33 might be the dcl for Silver.
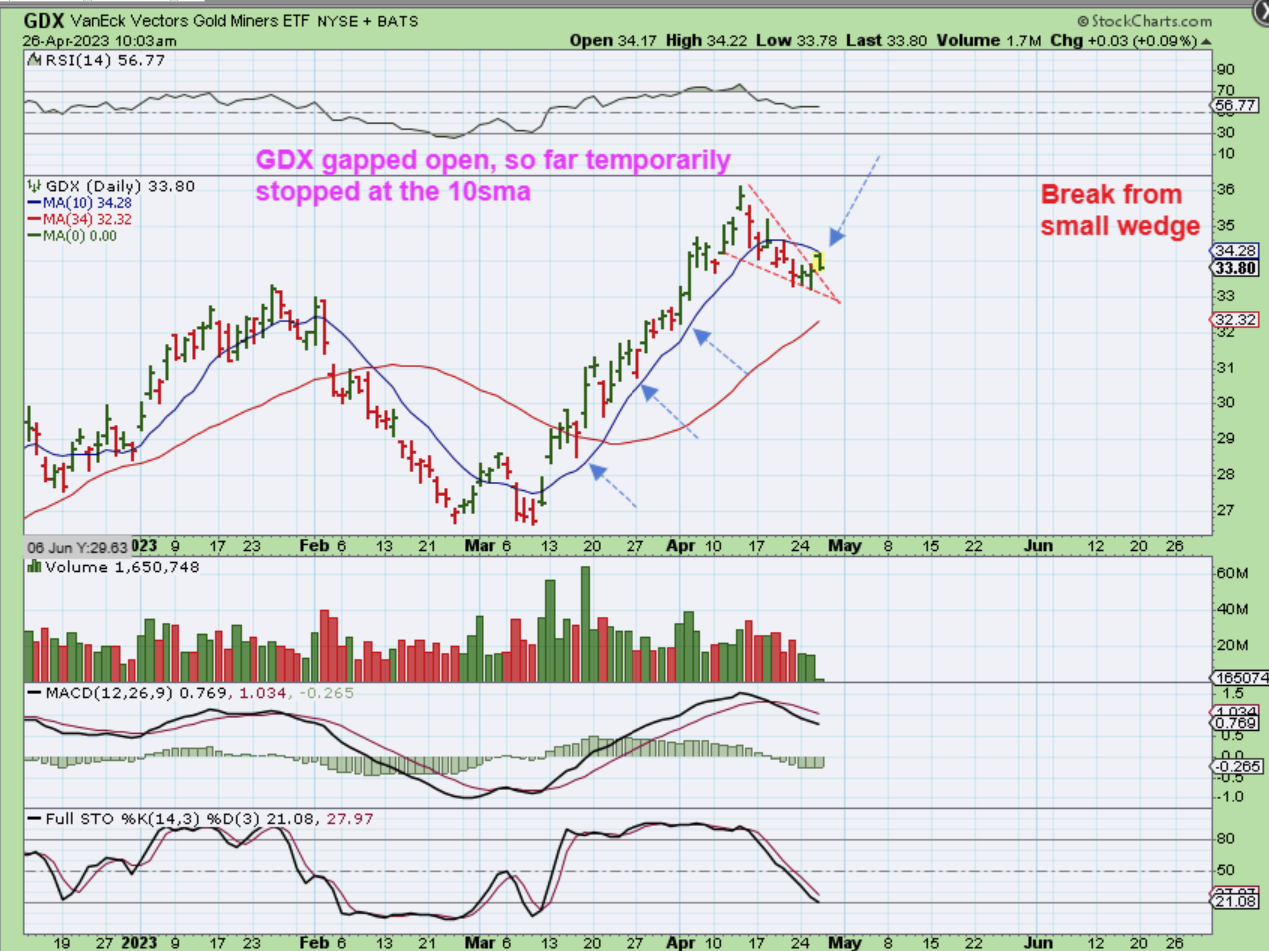
GDX gapped open yesterday, but was held down by the 10sma. I captured this 1/2 hr into trading hoping that we had a wedge break out, but it continued to sell lower all day long, back to the lows.
.
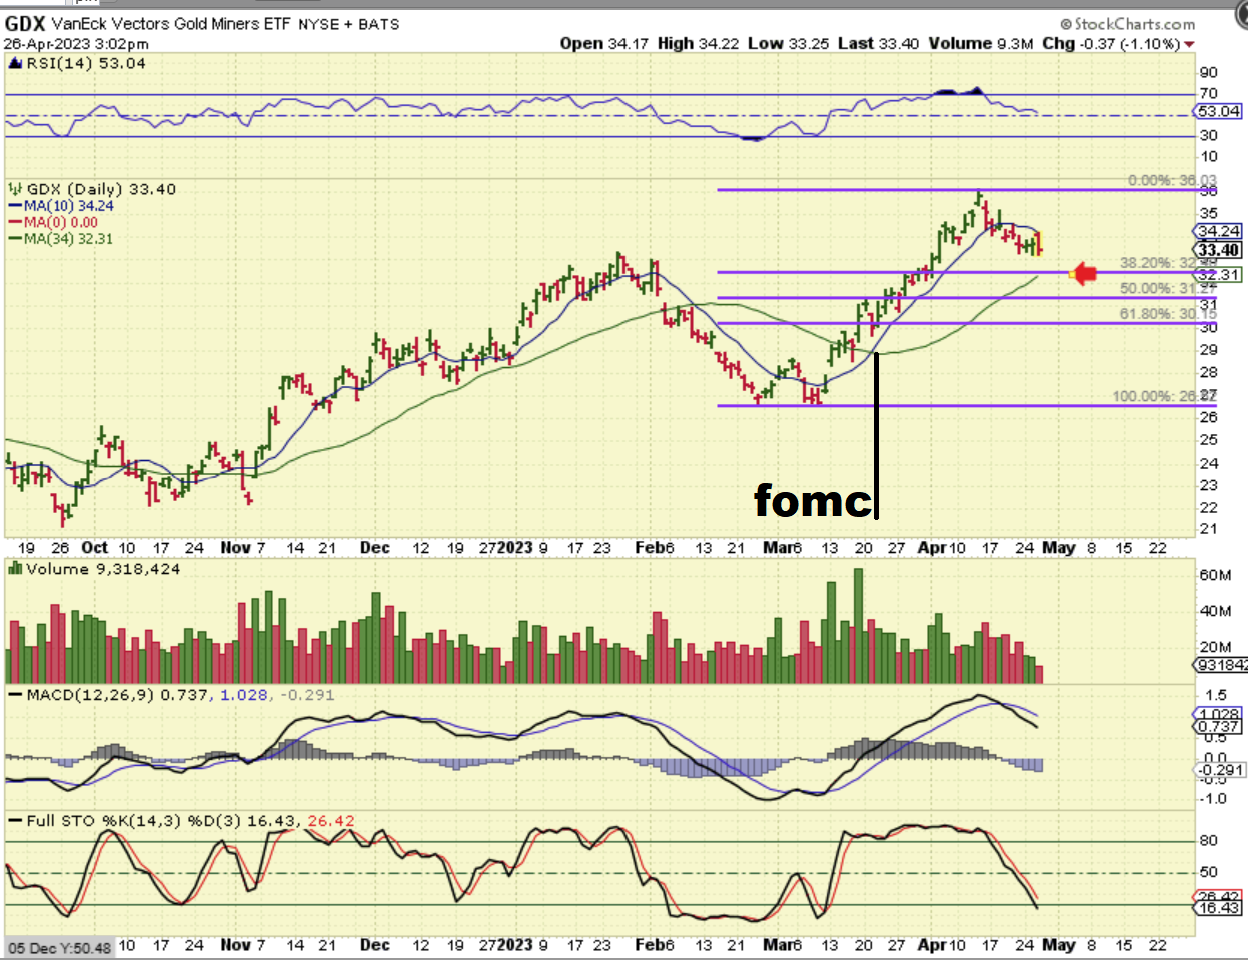
GDX was rejected at the 10sma as mentioned, and then dropped yesterday to the recent lows again. It can drop even lower, since the 38% Fib level has not even been tagged yet.
.
GDX was different than Gold as that Fed Mtg came due on March 22. Remember when the banks failed and Gold surged very quickly to the highs? The Miners lagged and didn’t rally back to the highs like Gold, so I said that we should be buying Miners around the 50 sma, and add after the Fed Mtg.
.
So on this chart March 21 is the red day that Miners dropped heading into the Fed Mtg. After that The Miners rallied for weeks with Silver and since Gold was already at the highs, it formed that sideways triangle.
.
As a quick summary:
– The General Markets were coming due for a dip into the DCL, and I think we see that dip occurring as we head into the Fed mtg here.
– Oil is finding it hard to gain ground again, so it has dropped to a 50% dip, but the XOP is at 61.8% and they look weak again. The XOP ( the oil stocks) could remain choppy until it breaks out form the downtrend.
– The USD is bouncing around and that is causing the Precious Metals to chop sideways.
.
– In fact, we discussed that Gold formed a triangle at the last Fed Mtg and ever since then it has simply chopped sideways (and is actually roughly at the same price that it was at the last mtg). Miners, however, rallied higher post Fed.
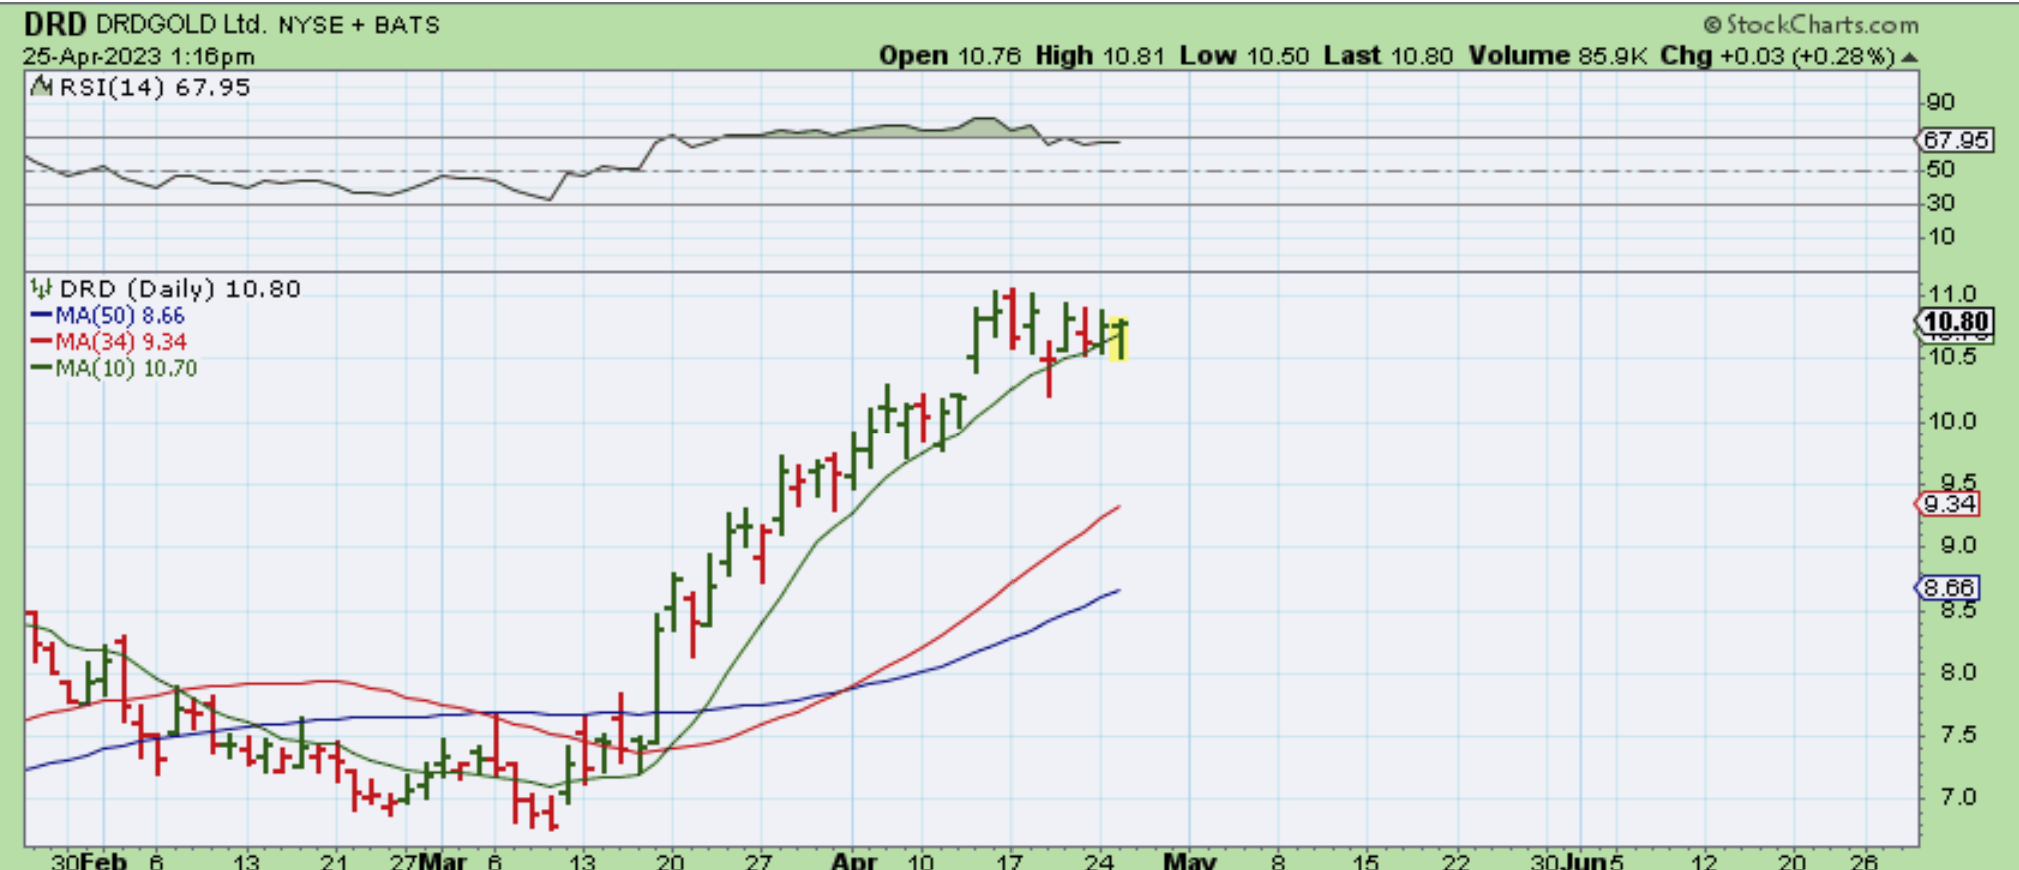
So things have been choppy for Gold and that is always boring and difficult, but I also discussed how strongly Miners rallied and then how well DRD, HMY, GFI, AU, KGC, etc are holding up during this time. I posted this yesterday…
I was looking at the S. African Miners like DRD, HMY, AU, etc again. What pull back? These are holding up well.
.
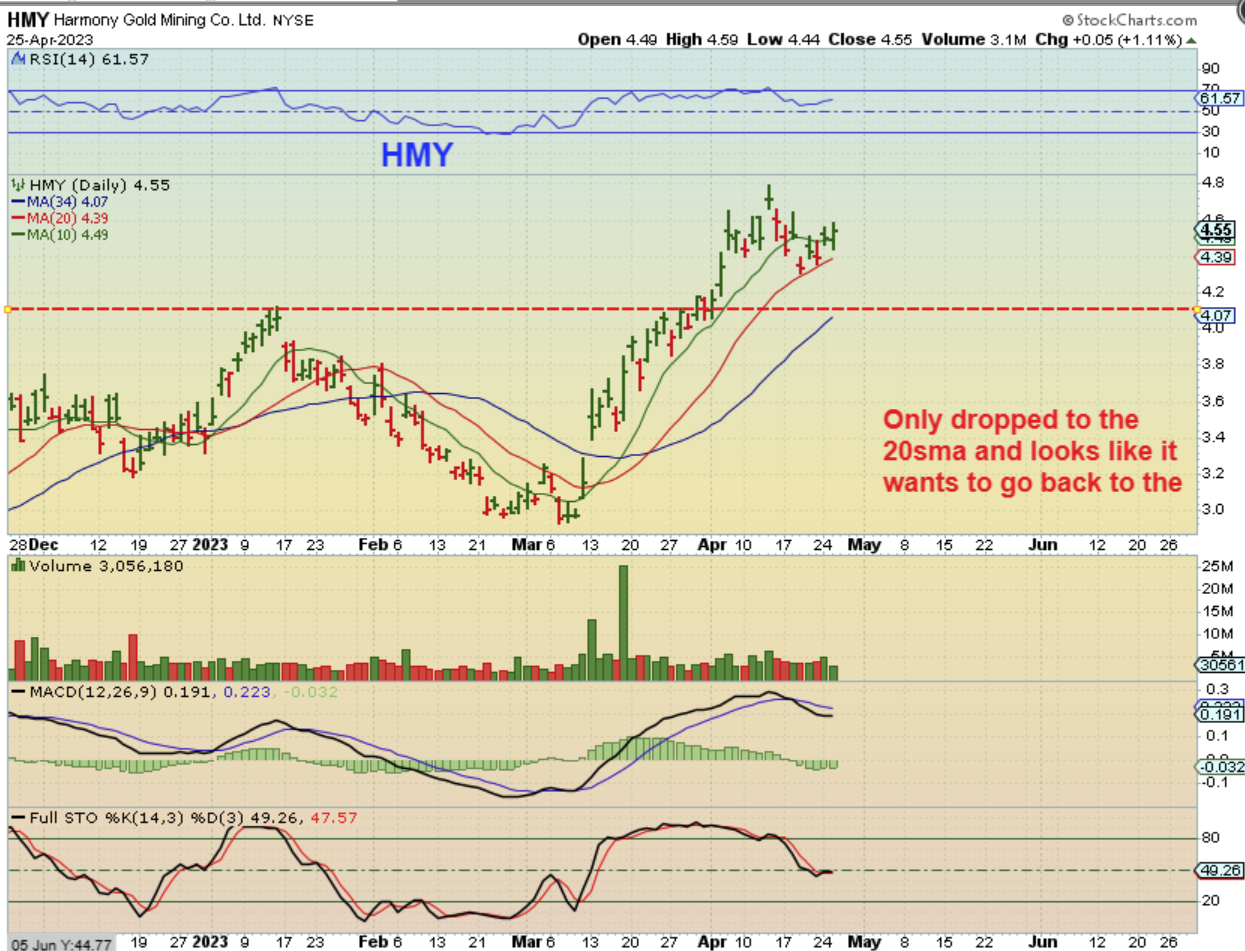
HMY is another S. African Miner. It only dipped to the 20sma. I would have expected a drop to support at the prior highs and the 34 sma (blue line), but at this point we may just see these continue higher. It has been a choppy 2-3 weeks, but this is quite a bullish pullback.
.
So the Miners continue to look bullish as we await the Fed mtg. I do think that a dcl is in place for Gold, so it is good to remember that the Precious Metals sector might start to push higher at any time too. Enjoy your Thursday trading, I’ll have a bit on Bitcoin below.
.
~ALEX
.
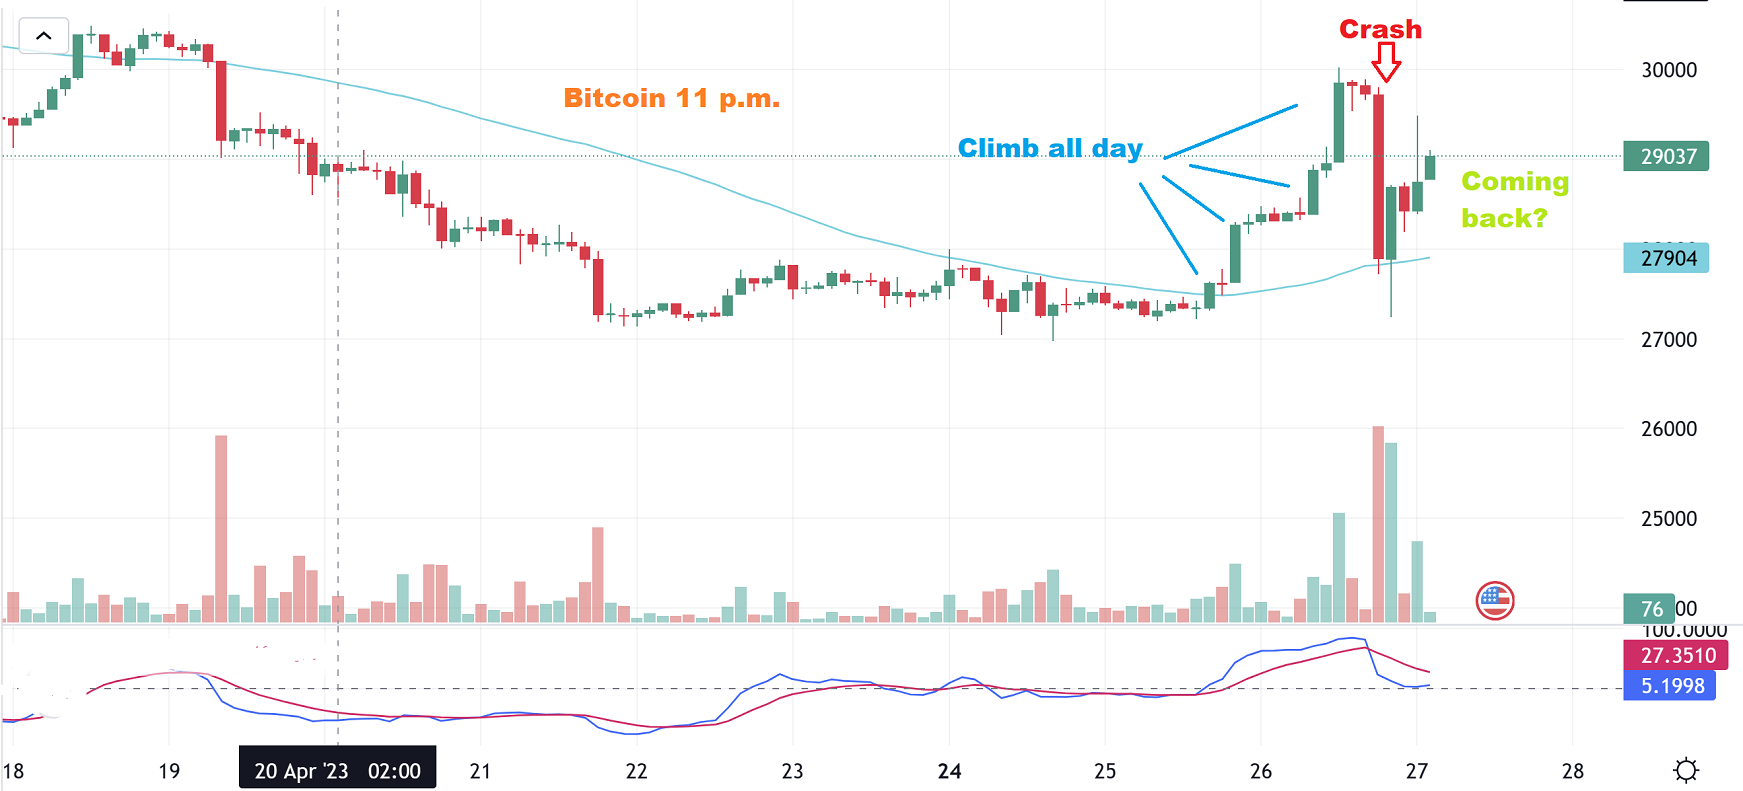
BITCOIN had a strong rally yesterday and then suddenly it sold off. This is a 2 hr chart (intraday). So this looked dreadful, but on a daily chart it was still holding on above the 50sma.
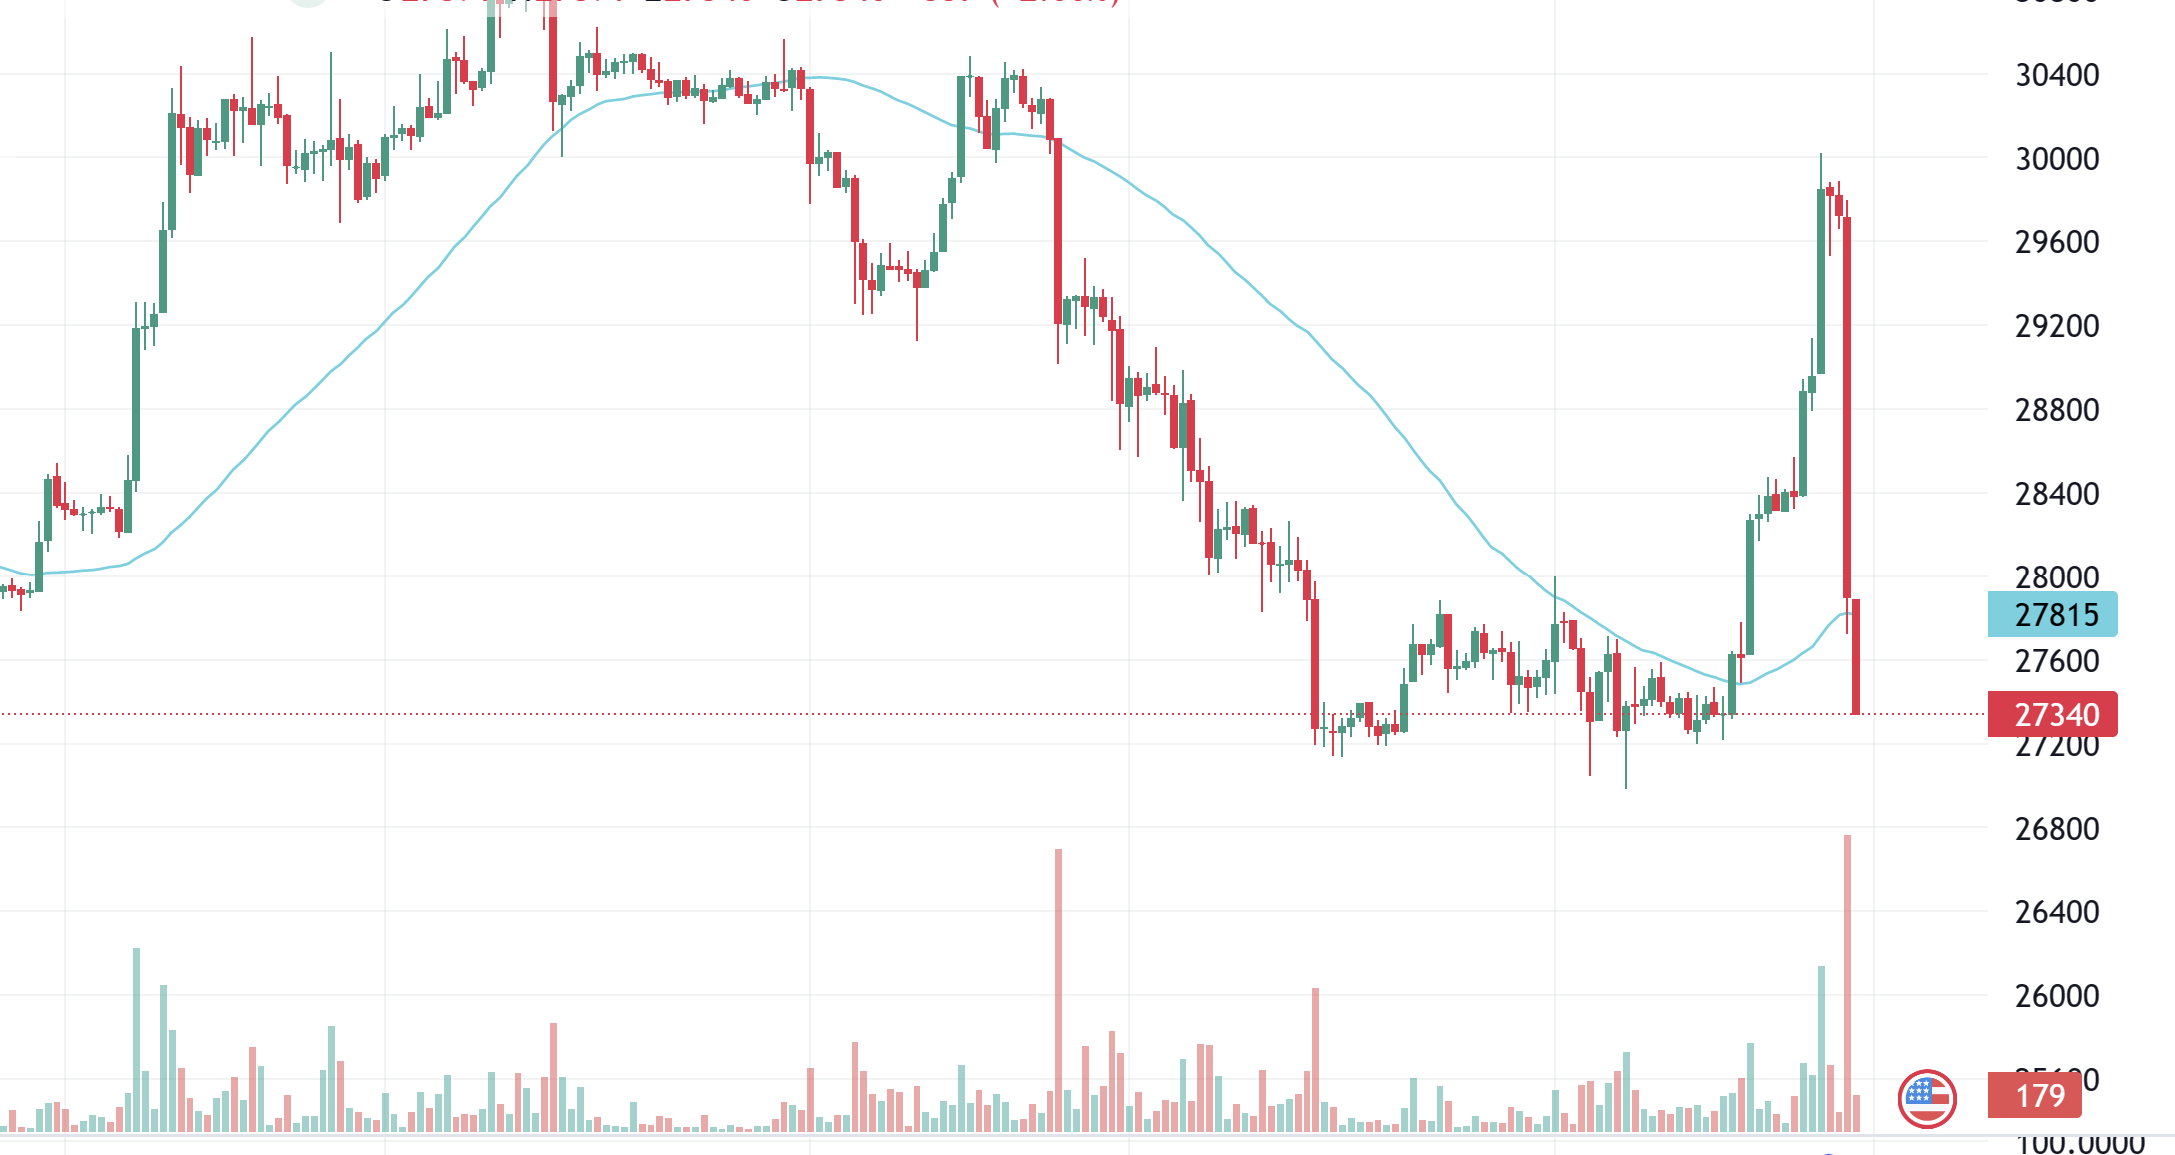
BITCOIN- As of 11 p.m., That rally and drop was slowly starting to try to recover. This is what makes Bitcoin and crypto stocks so hard to hold. How is Bitcoin doing now on a daily?
.
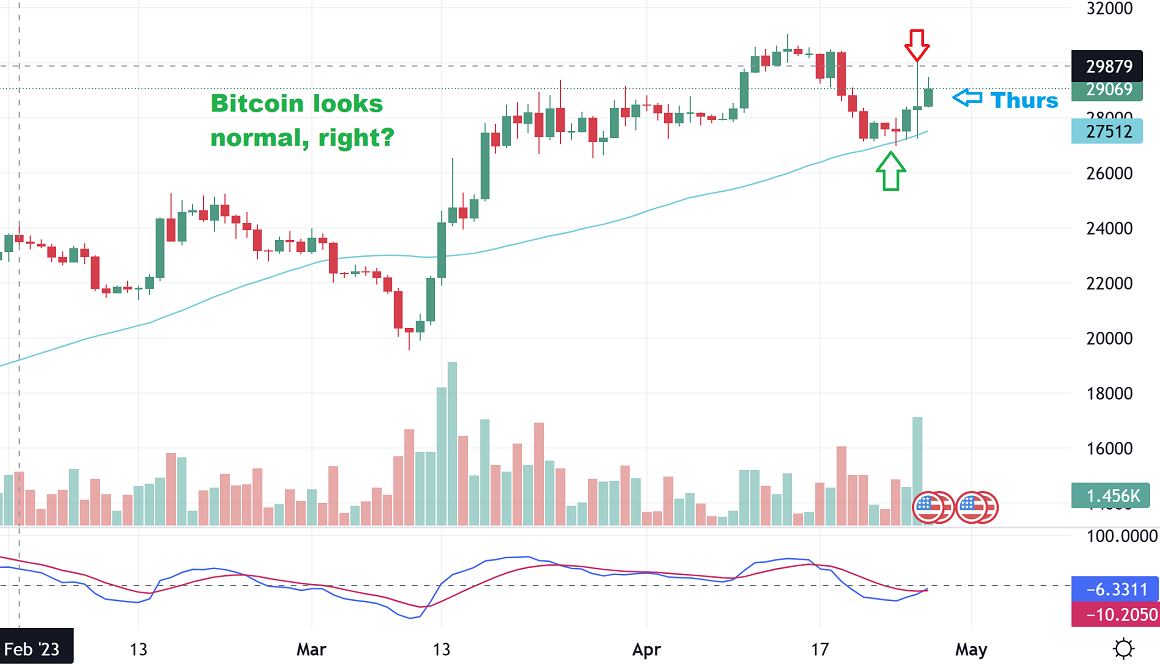
Bitcoin now looks normal again (I captured this on Thursday morning). The red arrow is Wednesdays Pop and drop, and today it is trying to recover. Hard to hold? YES!
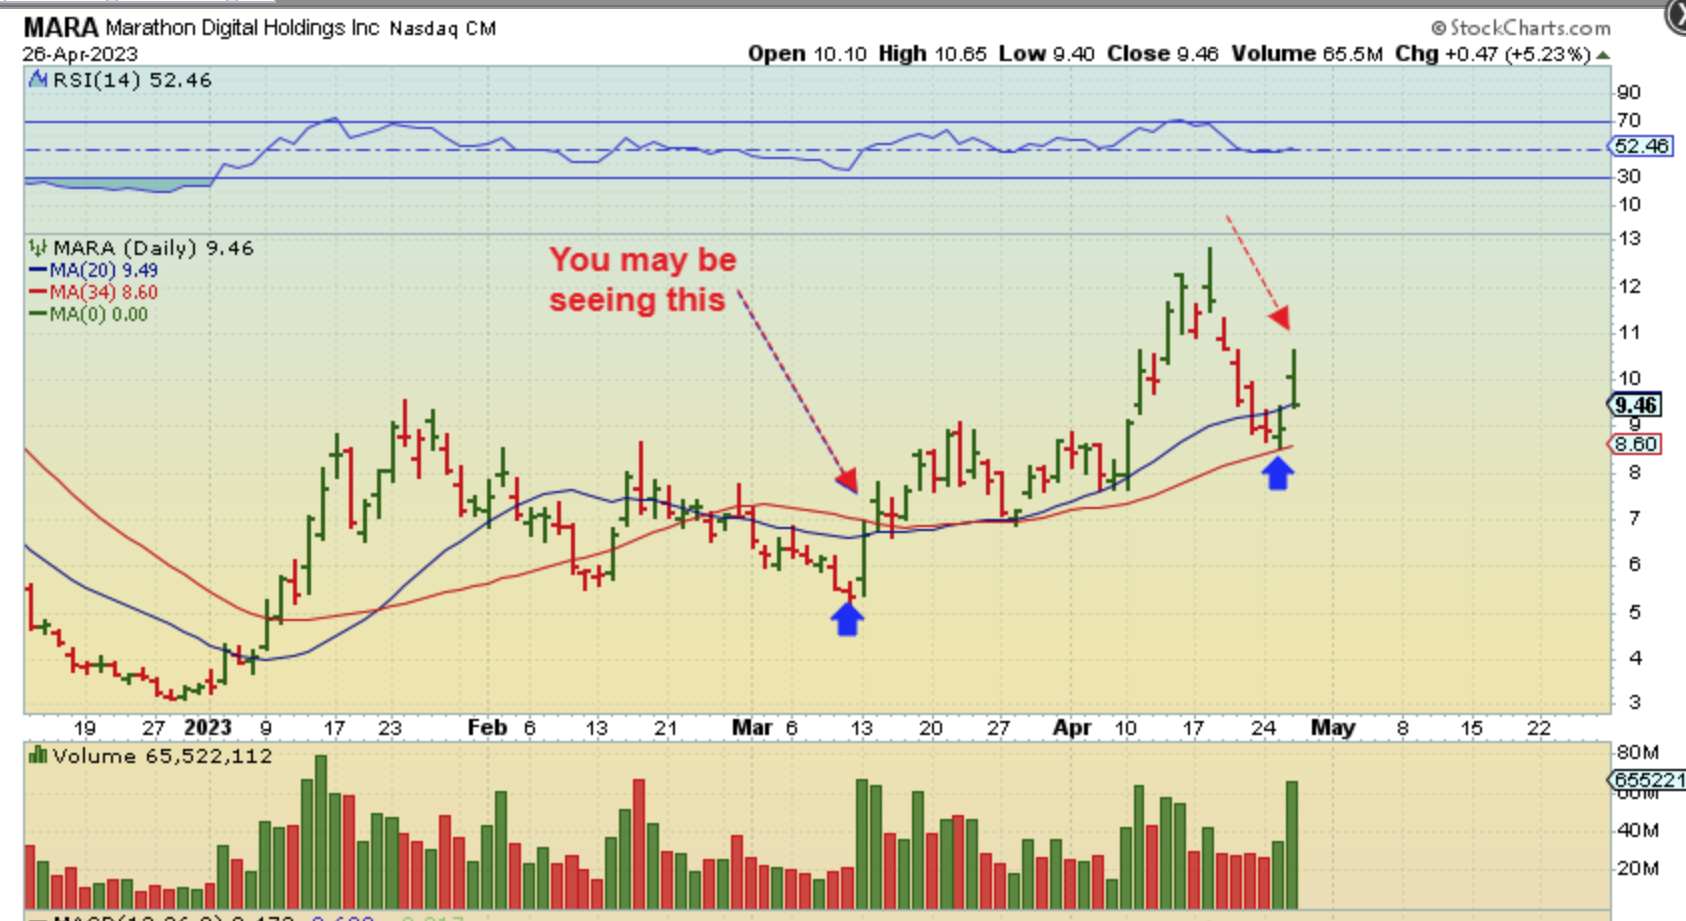
MARA gapped open so I was watching for a gap fill (it does this at times)…
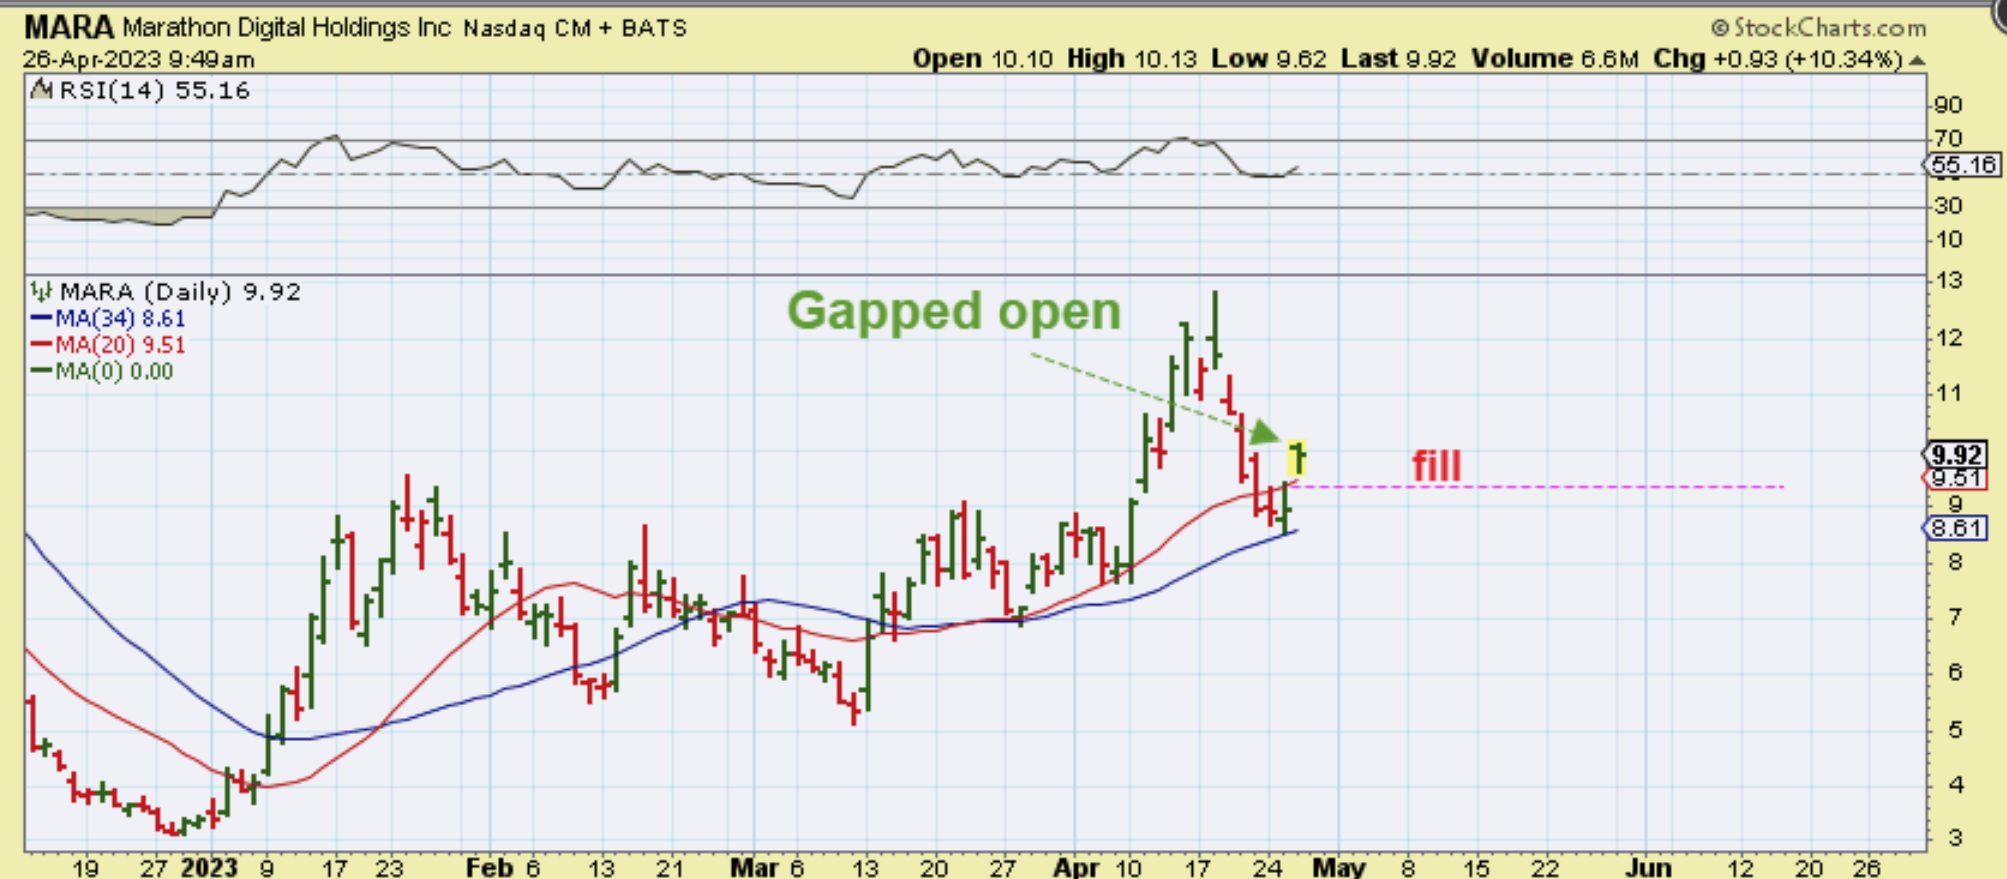
MARA we got that gap fill and reversal, but then Bitcoin sold off into the close, so…
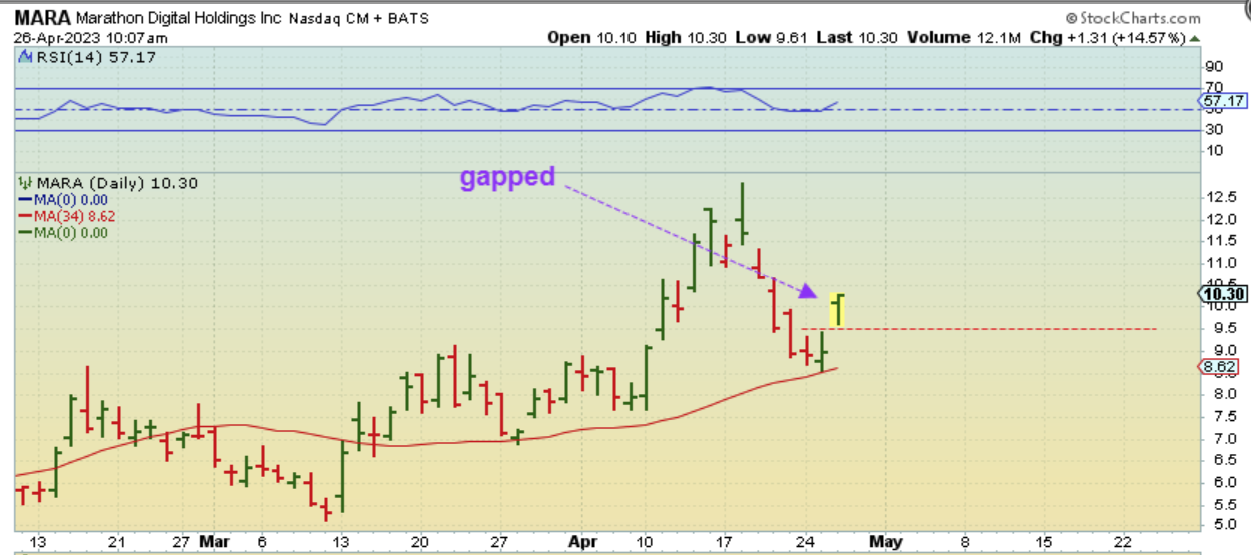
MARA has a reversal candle, but it remained up 5%. It landed on the 20sma, but does this reversal mean that the selling must continue? No, actually we have seen this before, these are very hard to buy and hold, but over time it can pay off.