June 15th – ALL EYES ON THE FED – F.O.M.C.
Today is known as either Fed Wednesday or the day of the FOMC Decision. When I look at the charts, they are a mess and that is because there is so much uncertainty taking place. We all know that a Fed Wednesday can lead to major volatility, and I’ve often used intraday charts on a fed Wednesday to point that volatility out in the live area and then again in the following days report. Most of you have been with me for a while, so I really hope that you remember those charts. I found a few, so I’ll just put them in this report now to emphasize that in the past, DESPITE THE FEDS DECISION ALREADY PRETTY MUCH BEING KNOWN, we saw sharp price action in Gold anyway. Take a look…
.
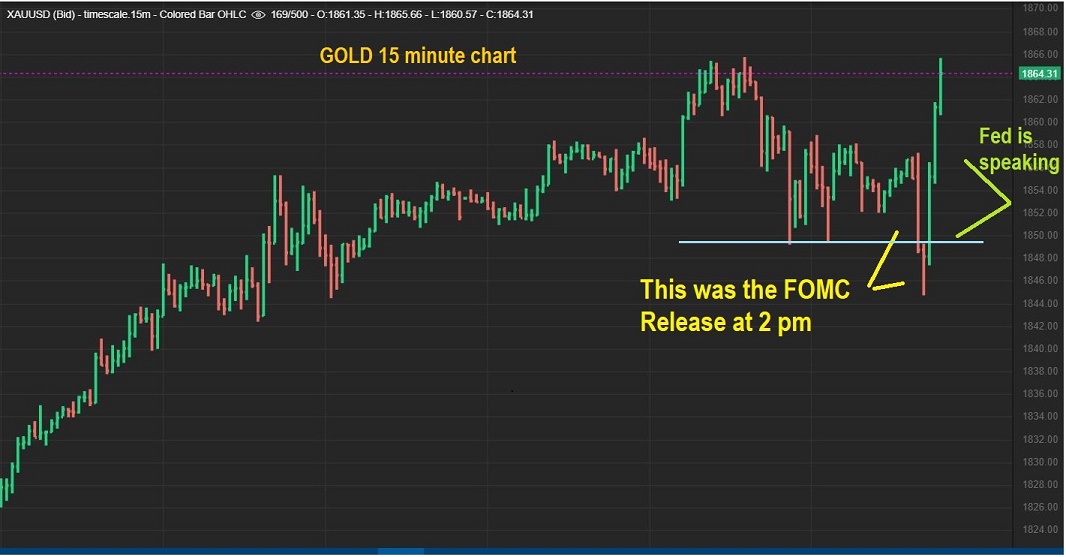
On one Fed day on December 17,2020, Gold sold off sharply at 2 p.m. on the 15 minute chart, broke the lows, and rallied back sharply after the Fed started speaking at 2:30 . VOLATILITY took price in both directions.
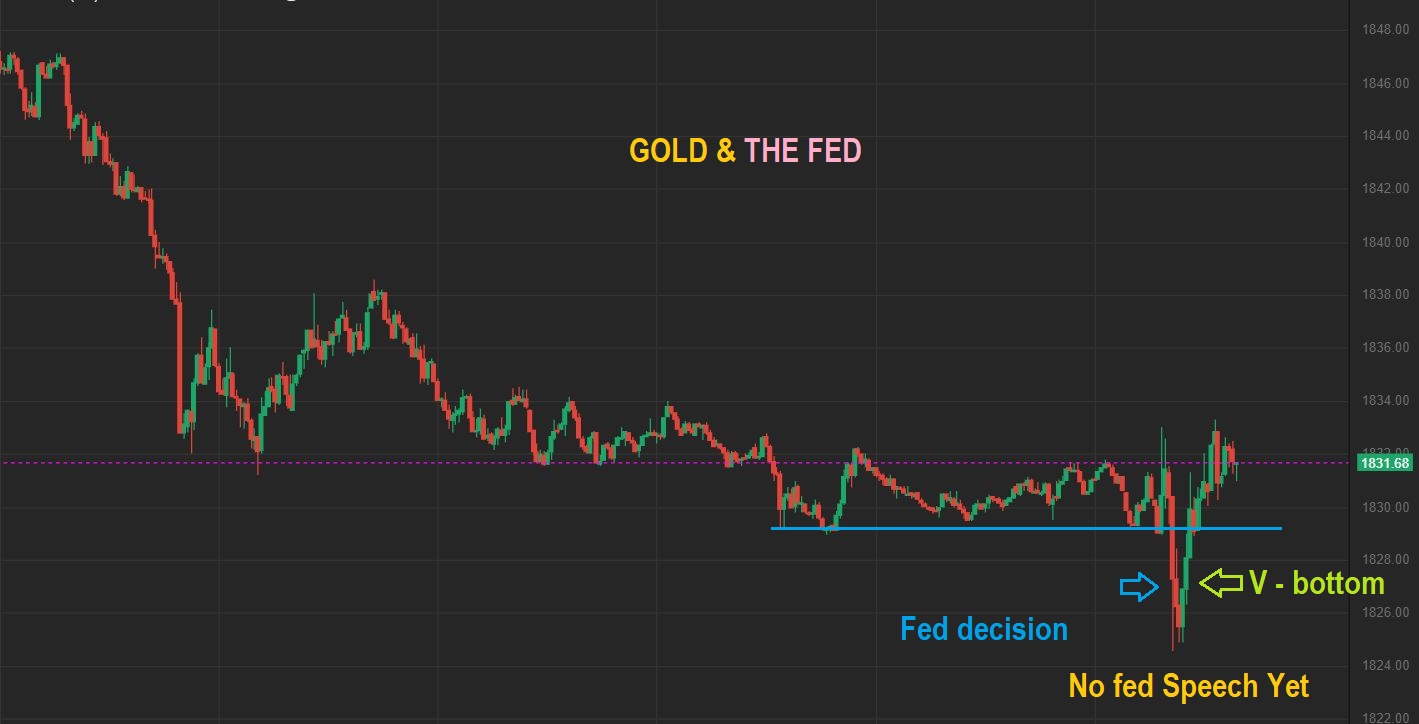
Here on September 21, 2021 we saw Gold take off higher and looked like a rally was unfolding, but then it quickly rolled over and Broke the lows. Volatility in both directions. Gold sold off for 5 days, bottomed, and then rallied for weeks.
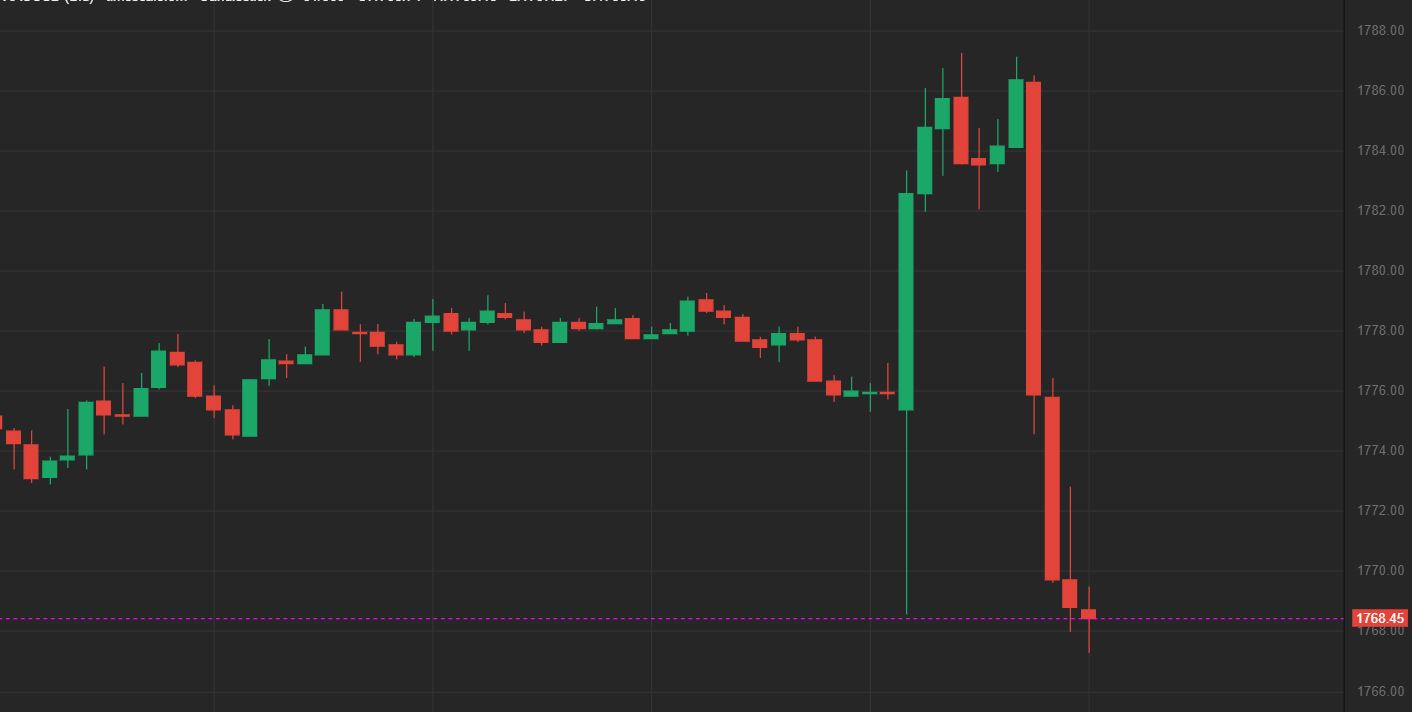
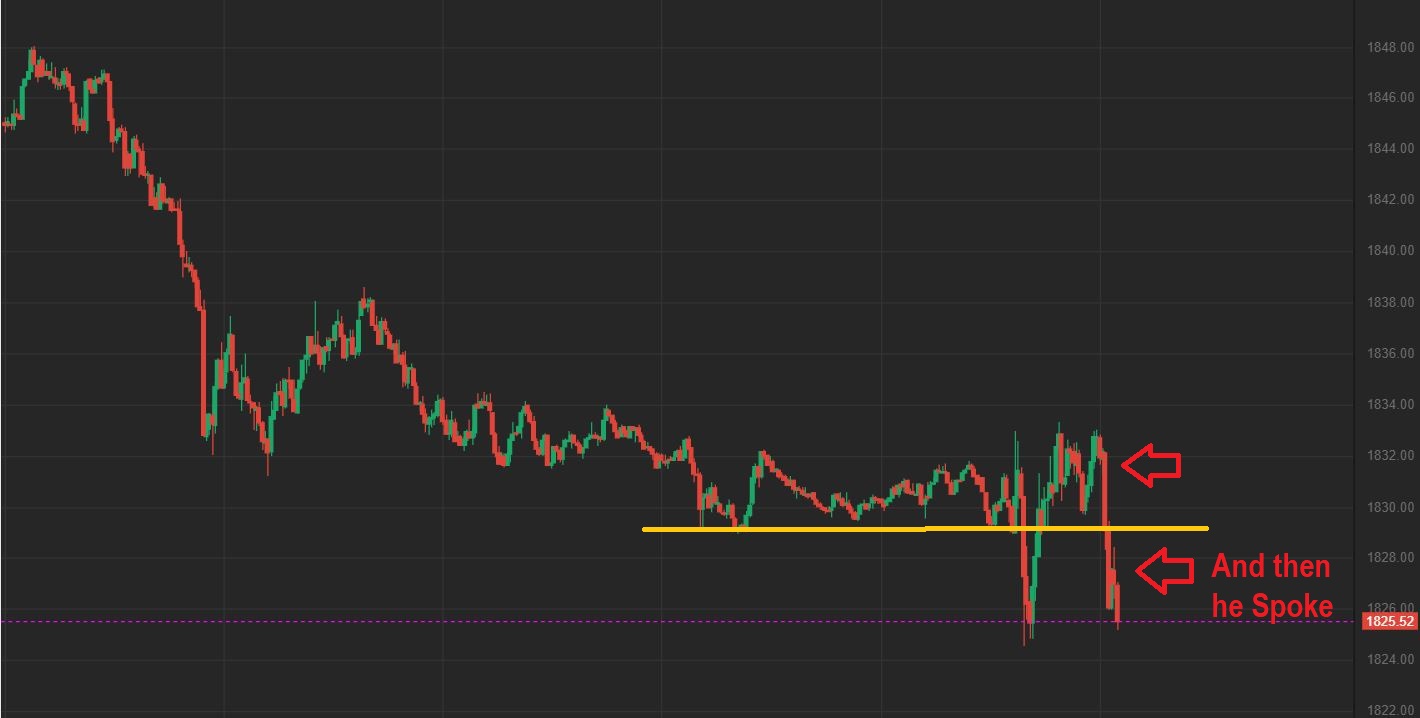
JANUARY 2022 – Gold here was very choppy heading into that Fed Decision. At 2 p.m. Gold crashed to new lows, but then recovered right before the Fed Speech. This looked very good as an intraday slam down ‘shake out’, a possible ‘V-bottom’ right after the decision was released, this looked like a buy! So what happened when Powell spoke?…
JANUARY 2022 – Gold crashed as he spoke. THIS IS WHY THE 2 p.m. onward time period is just simply tricky and often very Volatile.
THE MESSAGE HERE? I have more charts, but I think that you get the point. Despite the rate hikes being fairly well known ahead of time, the markets (Gold shown above on different Fed Days) still became volatile and short term unpredictable. Now lets just quickly discuss our current sector set ups and go from there.
.
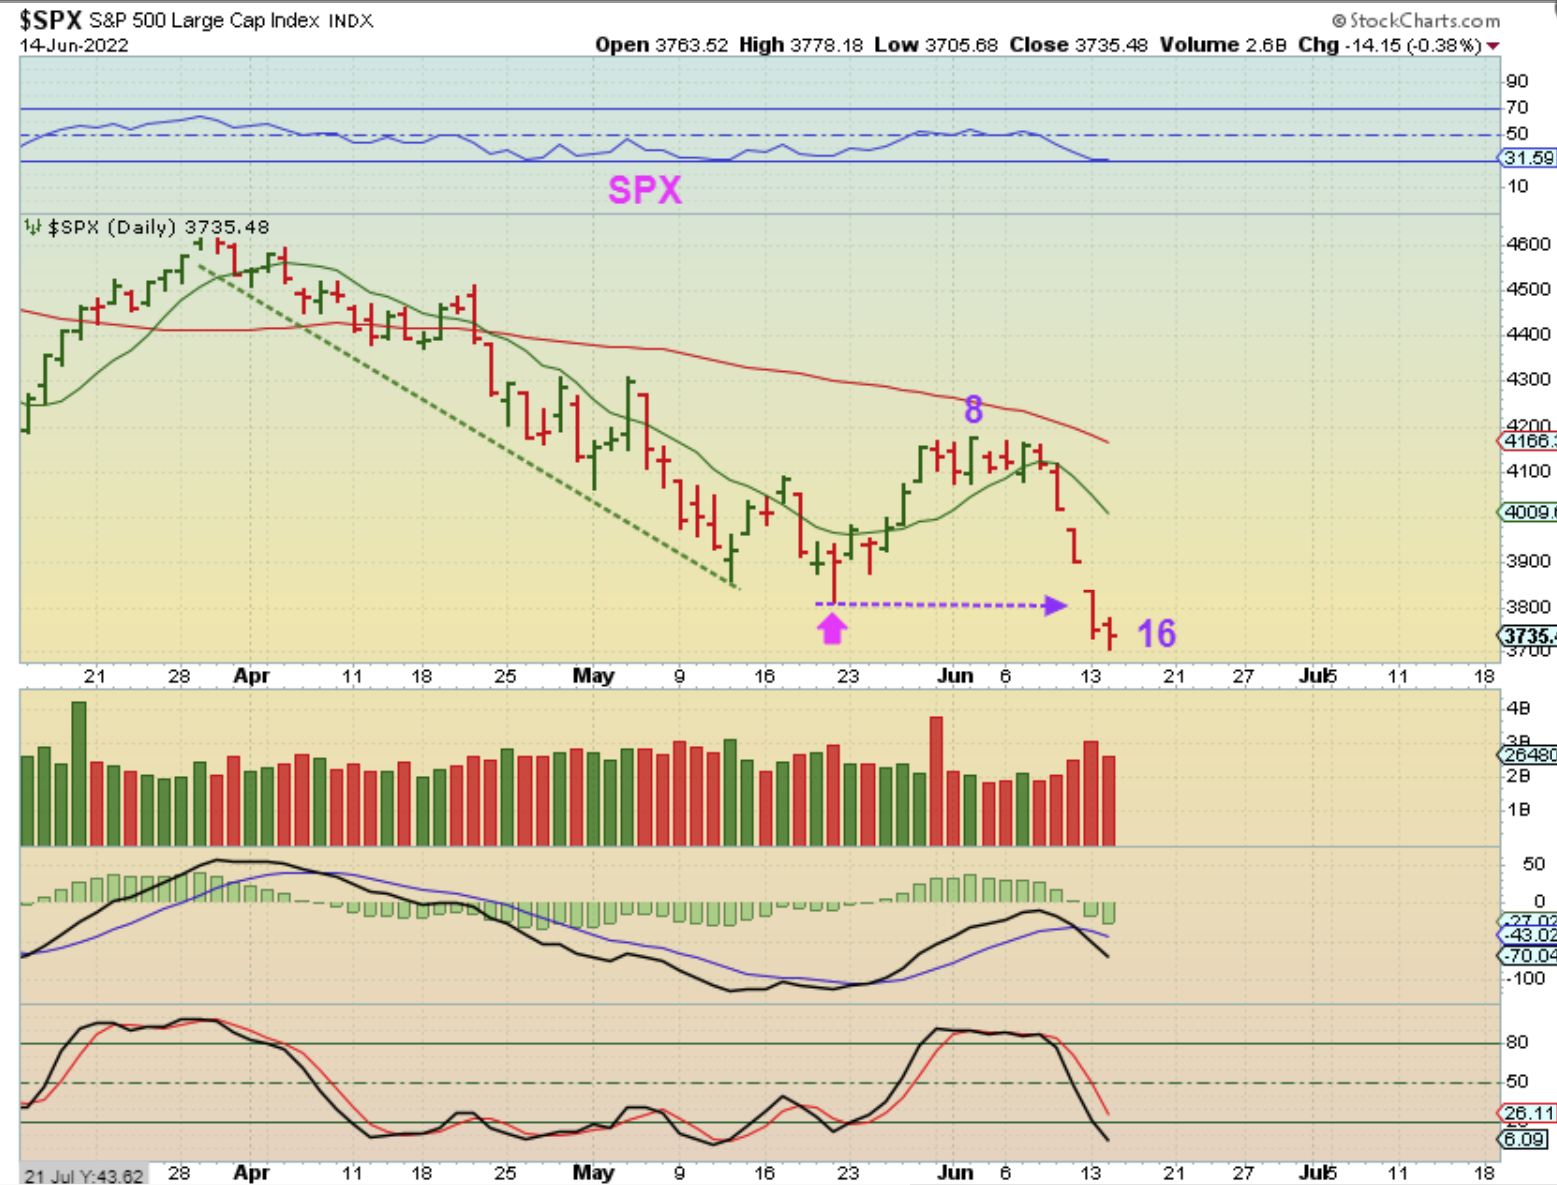
THE SPX bottomed in May, rallied to only a day 8 peak, and rolled over into day 16. IF this rallies with a Fed Decision, it will likely just be a bear market bounce. We would see a false rally, because this is only the 1/2 way point through a daily cycle and it is very L.T. That said, it also could just keep selling off and get really ugly. Let’s discuss both scenarios …
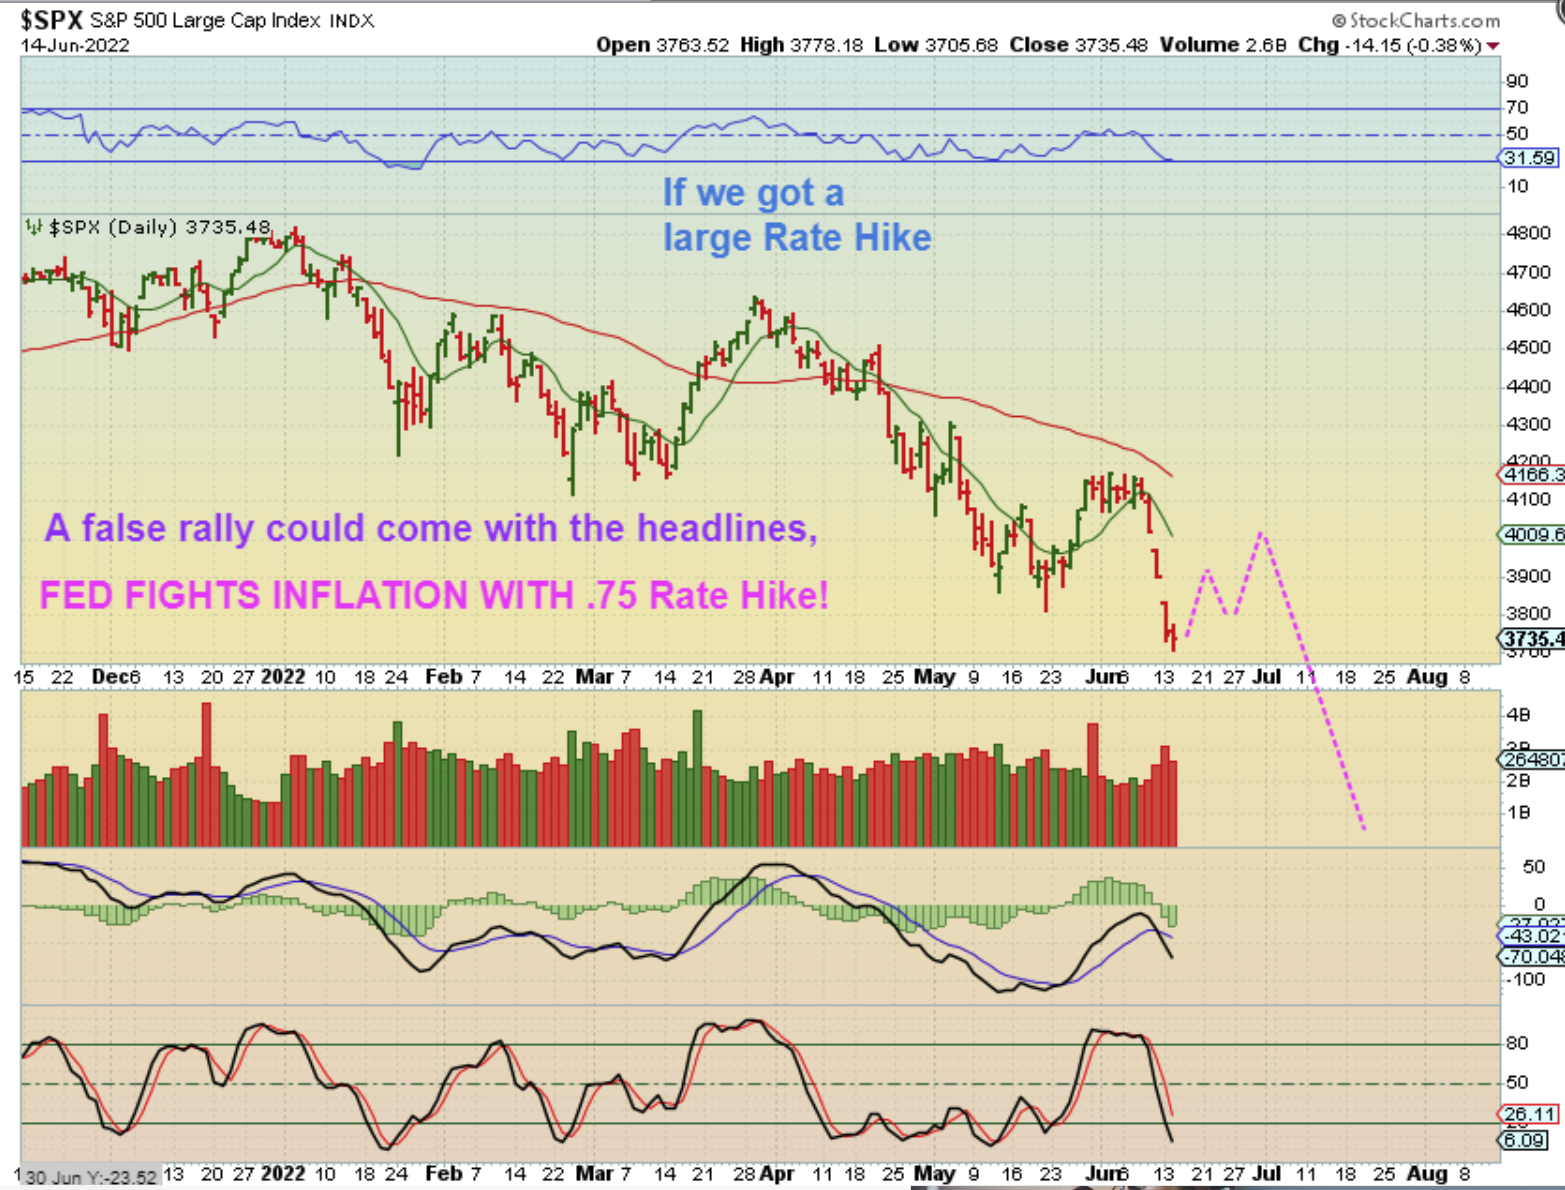
THE SPX : If we saw a .75 rate hike, the news could seem bullish, as though “The Fed is acting to save the day and stop inflation! Yay!” And then a small bounce might follow as shown. This is one scenario where, if the markets bounce, they will most likely become a new area to go short.
.
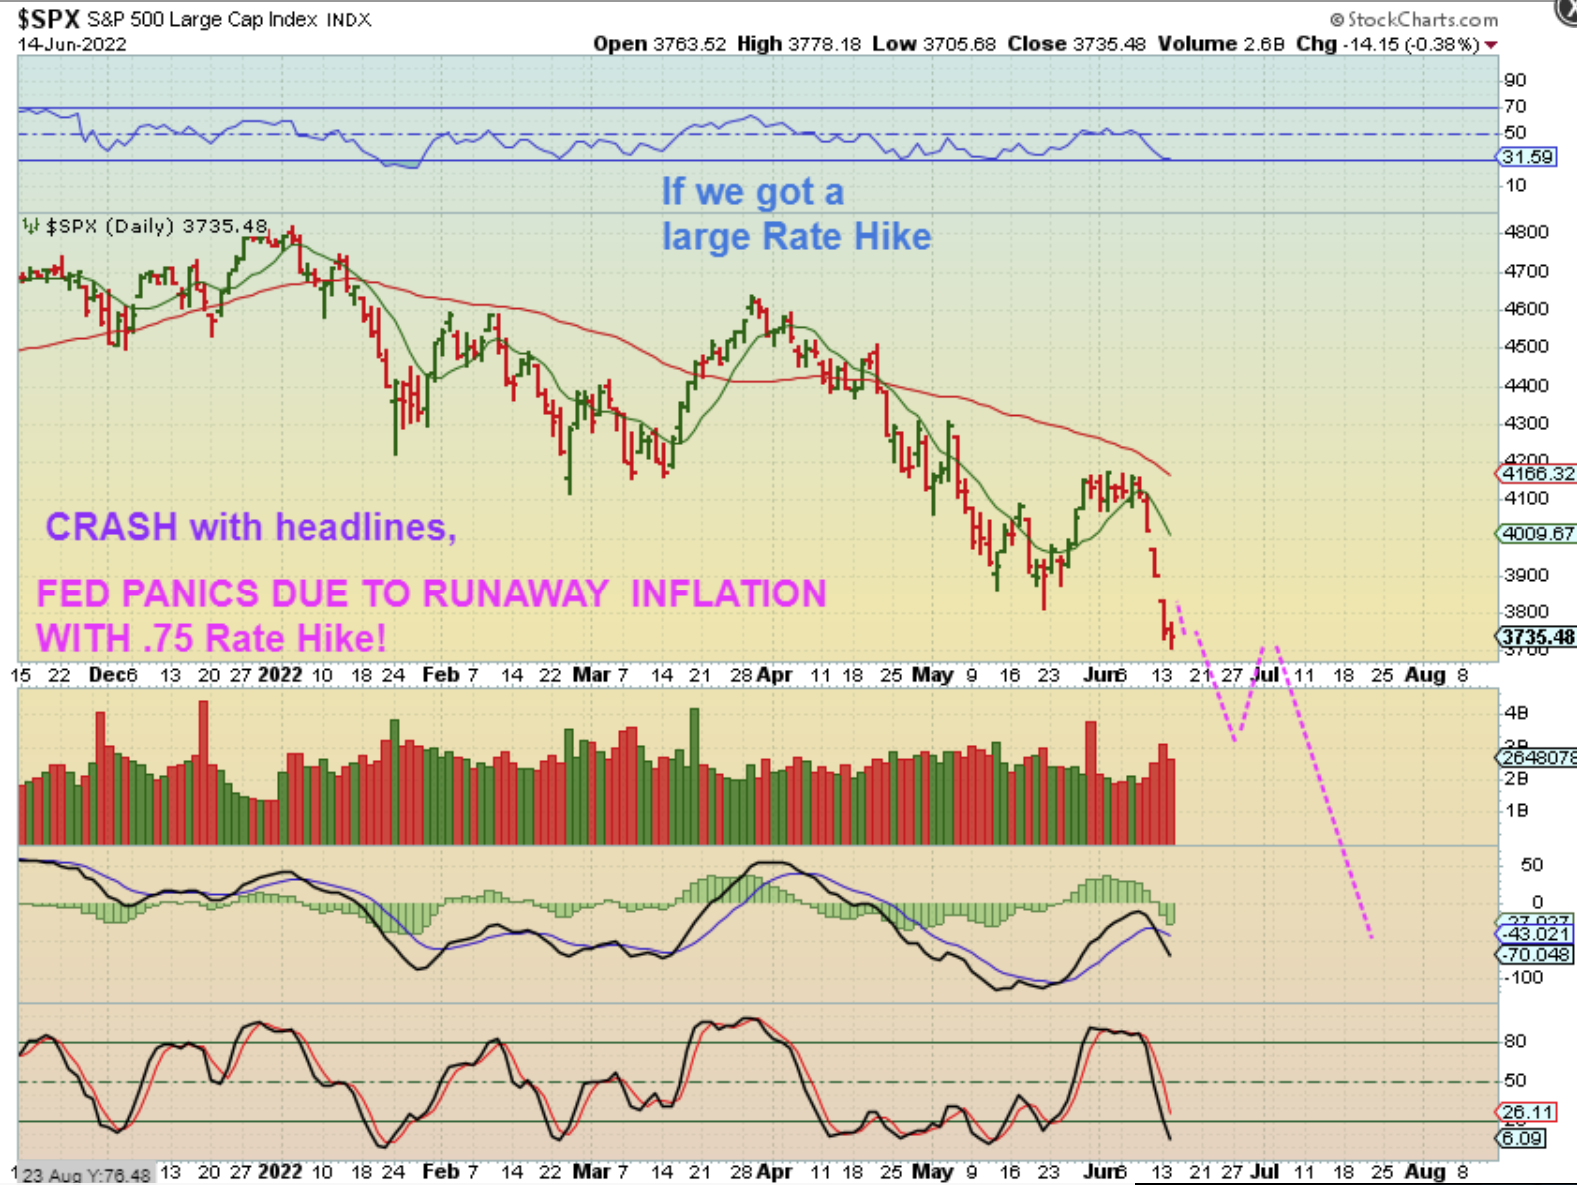
THE SPX : That very same rate hike might be perceived as a panic or desperate move in a dire inflationary situation. In that case, these markets might just flush down immediately. This is possible because we are on day 16 and that is 3 weeks or so away from when a dcl would be due, so right now things just look bearish in the big picture for the General Markets, even if we see a bounce.
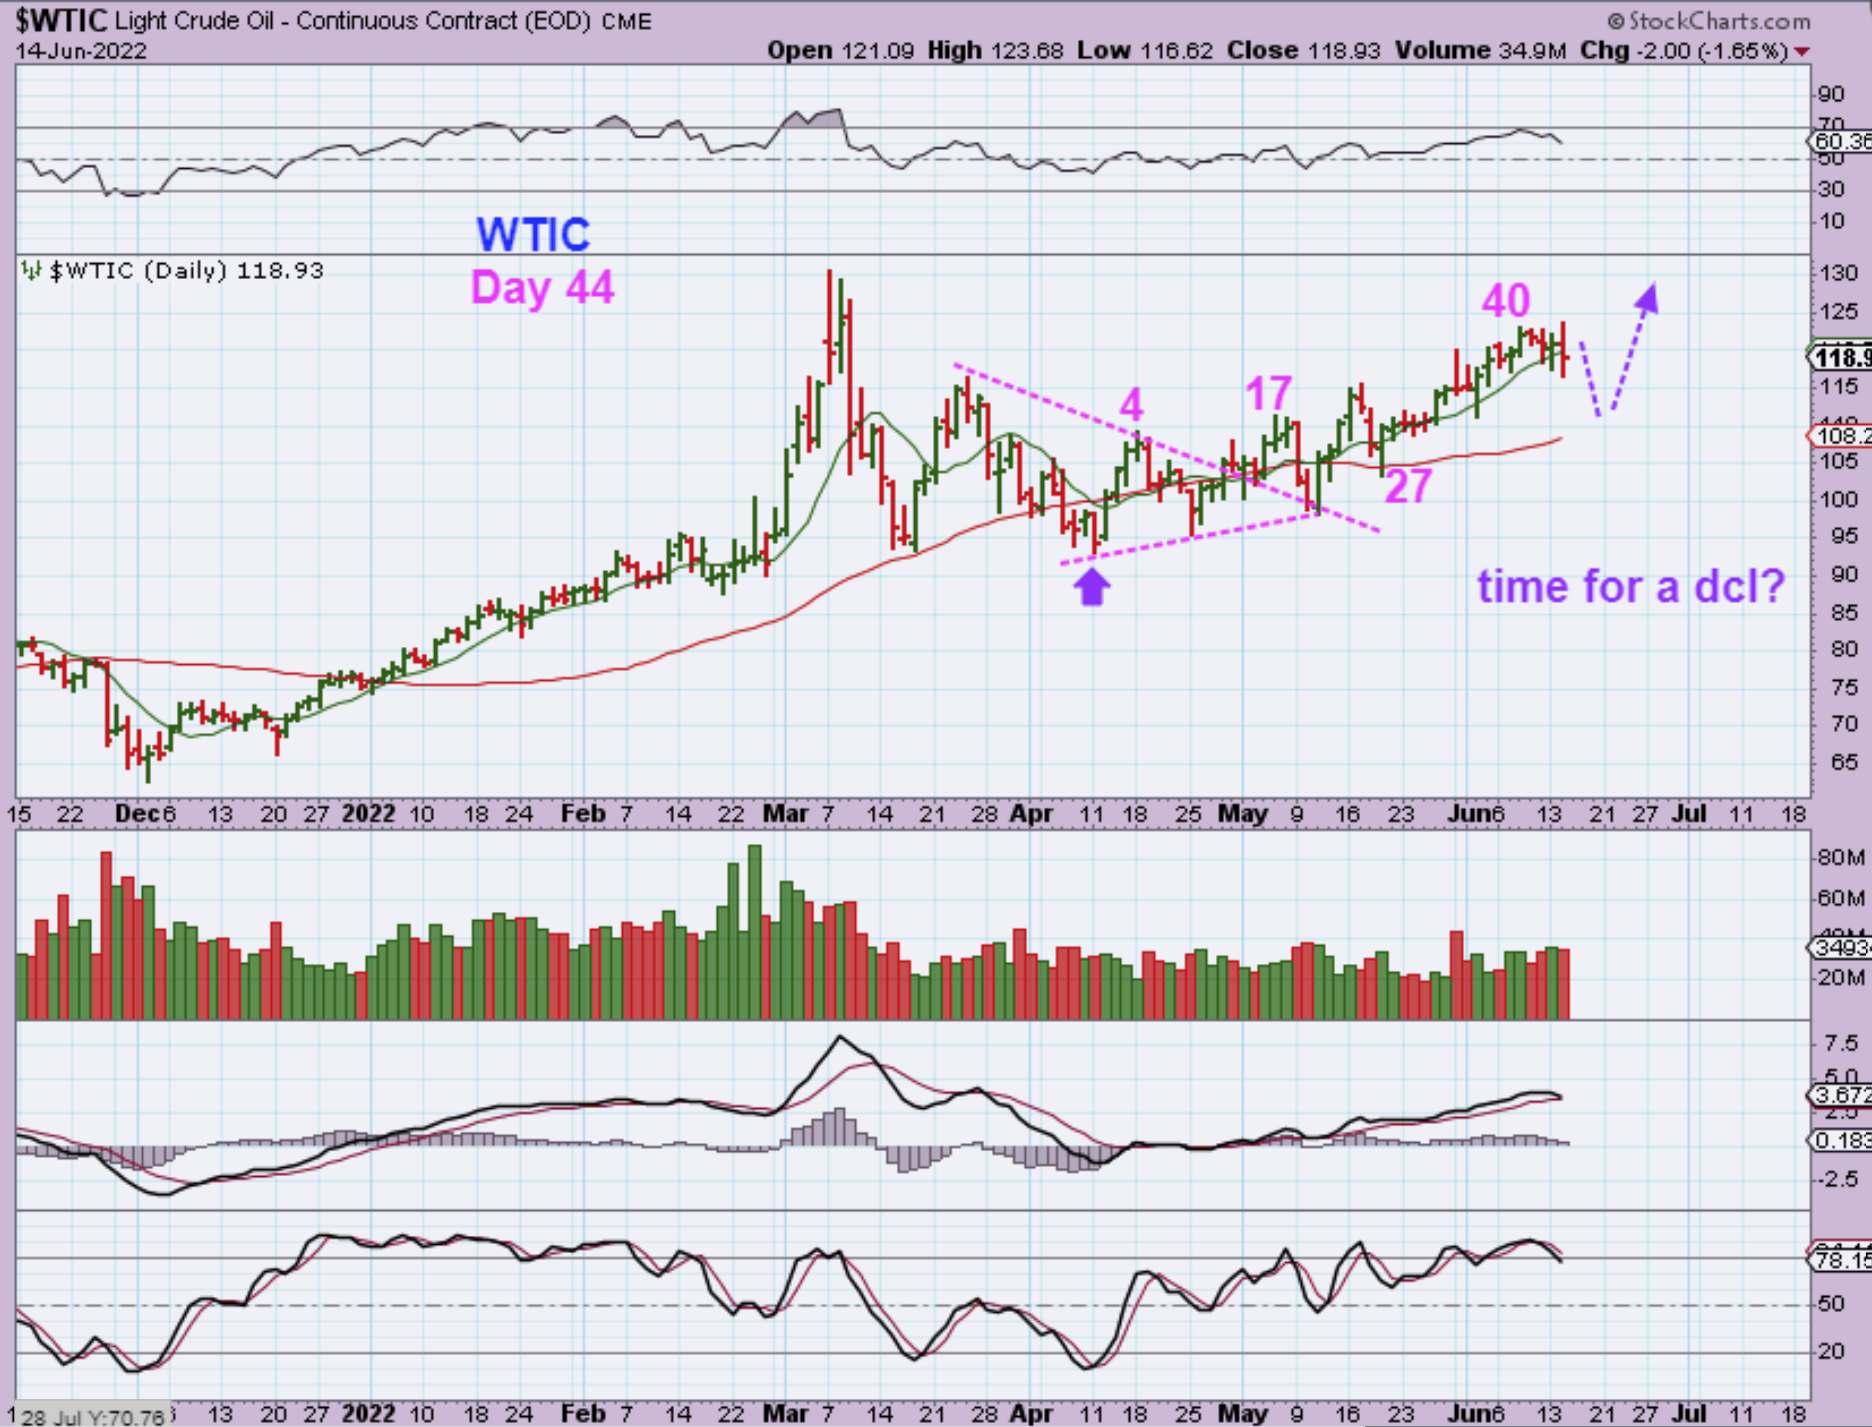
WTIC has been chopping higher and eventually it will come due for a bit of a deeper dip into a dcl. These daily cycles can be 40-50+ days long, so a dcl is coming due, but we still have time to tag $130 before then too. This is one area that has been choppy, but chopping higher& bullish.
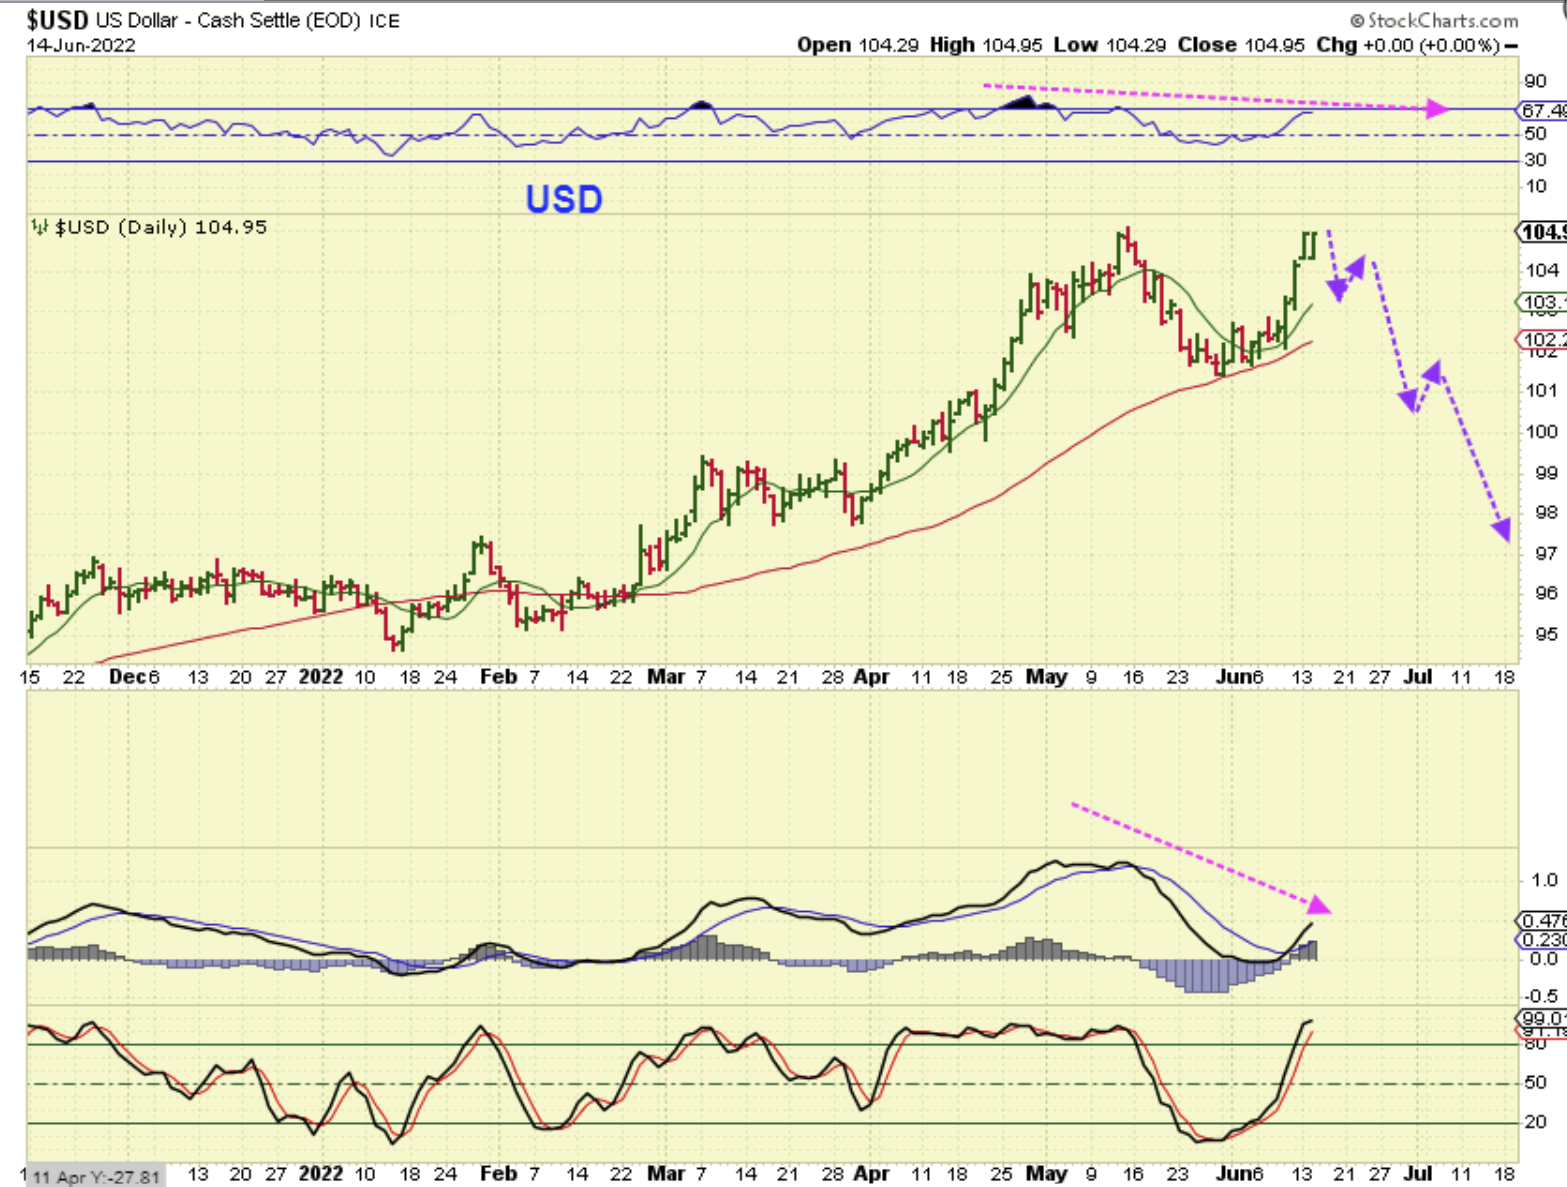
THE USD raced back up to the May highs and we are on day 10. This is kind of a critical point for both The USD & Gold, even though they can push higher in an inflationary environment. I just want to say that that is miner divergence with the RSI (Not a big deal really) and larger divergence with the MACD, but that can be viewed as a ‘reset’. So…
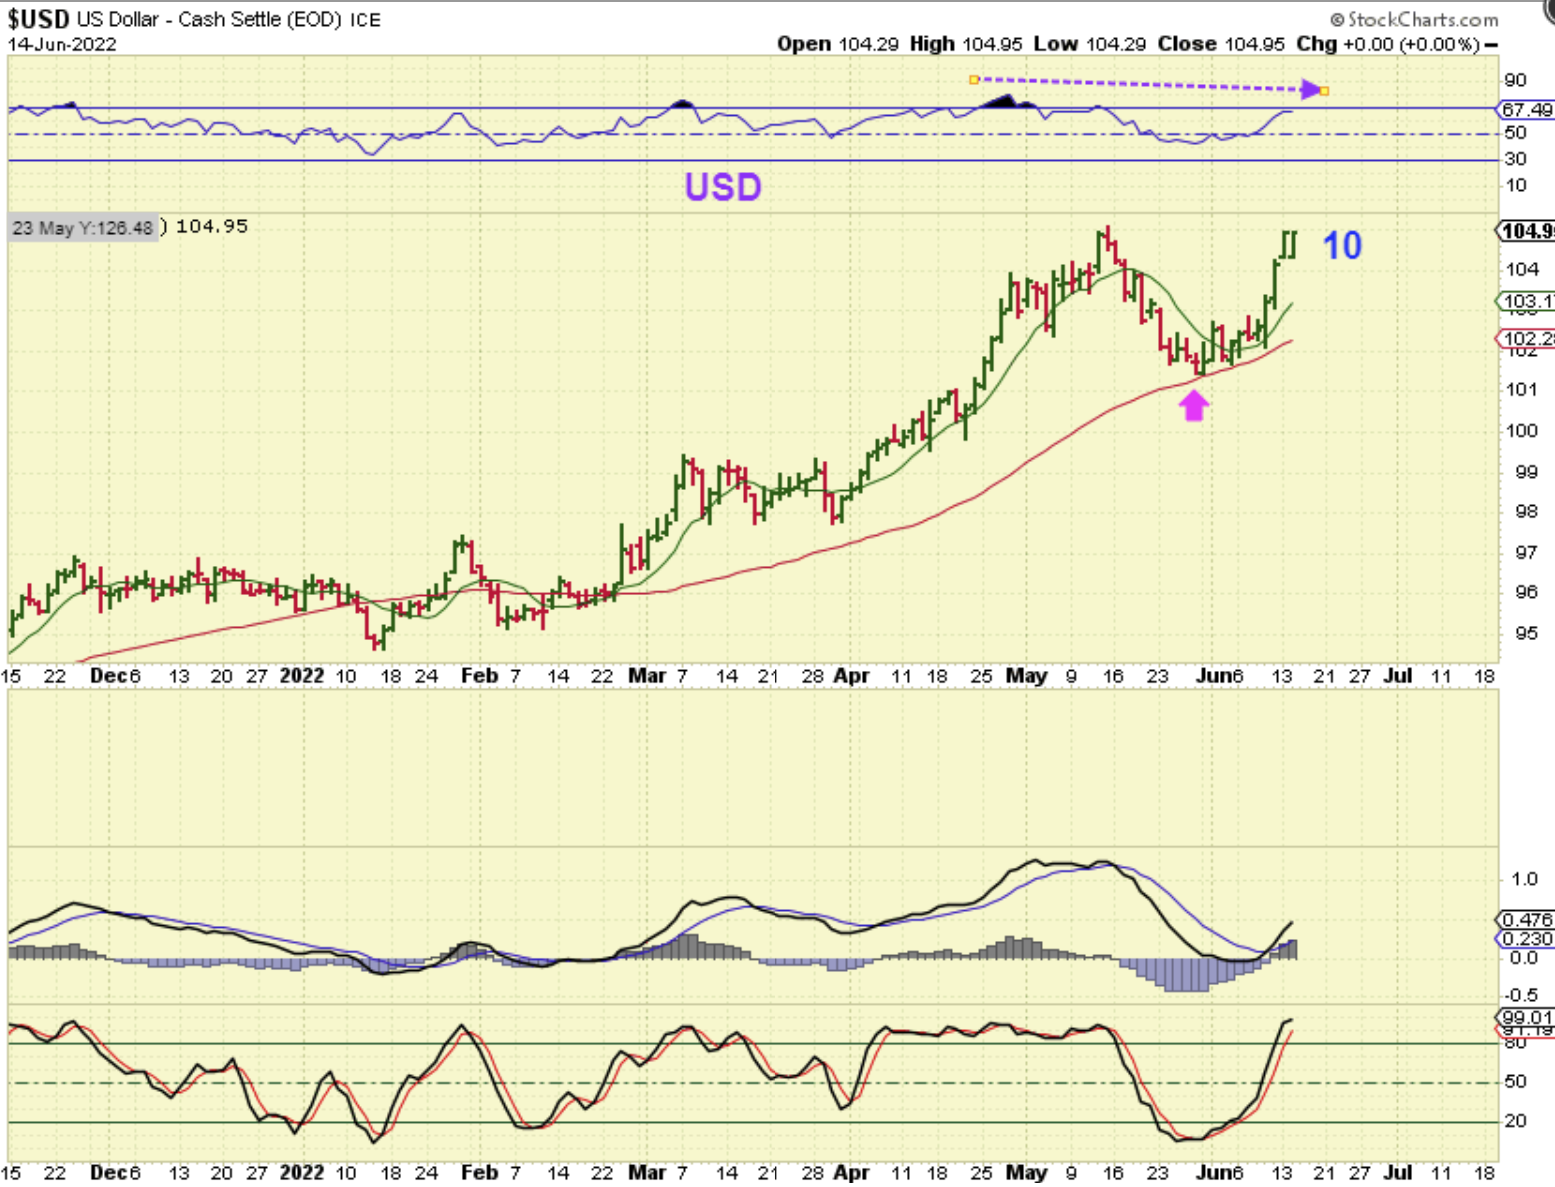
THE USD could chop and allow the MACD to rise and the USD can push higher and back test for that to happen too. In other words, the USD can still move higher. It does fit that bigger picture idea on the next chart.
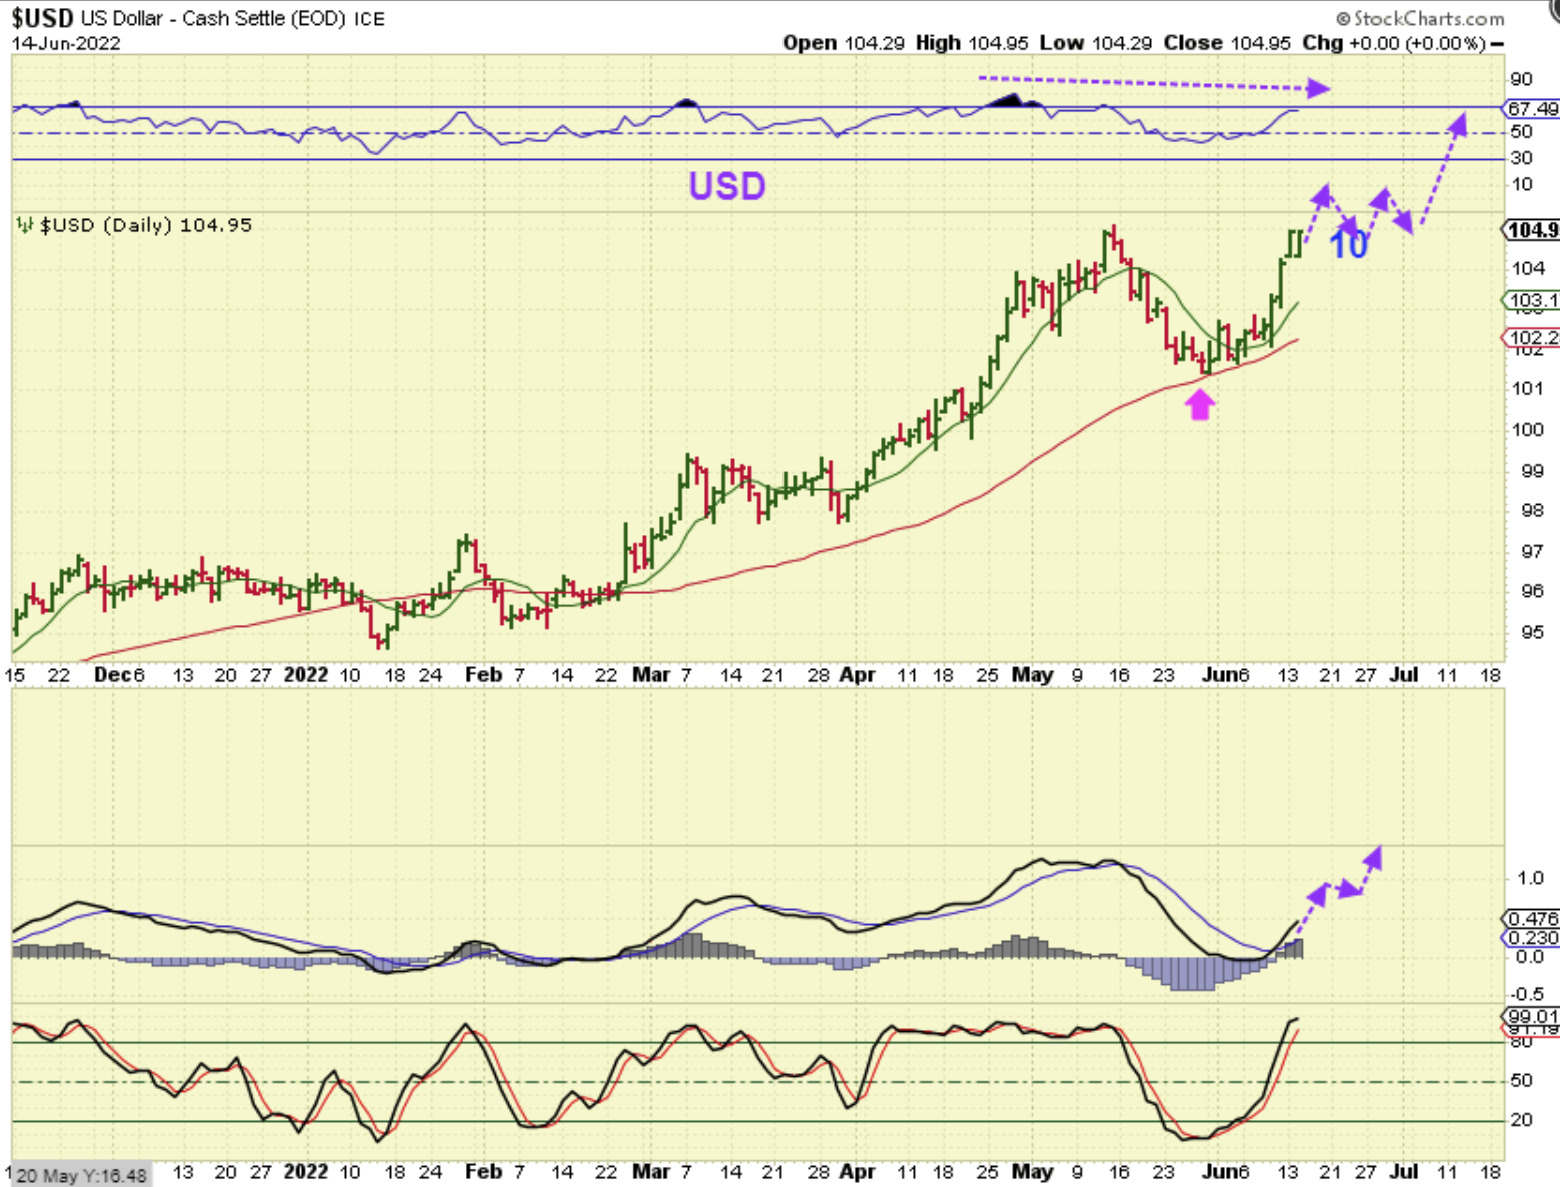
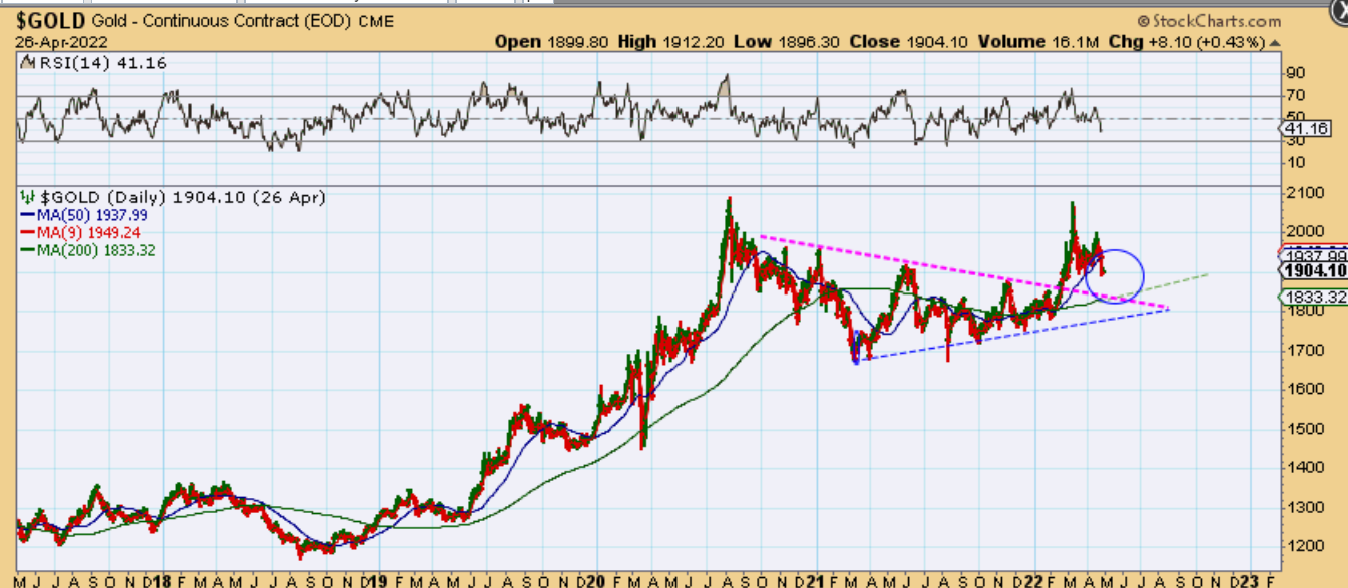
ON JUNE 3 I showed THE LONG TERM 3 yr cycle chart for THE USD. I was expecting a peak here, and we may get that with this double top, but notice that price can continue higher if it breaks out here. OR…
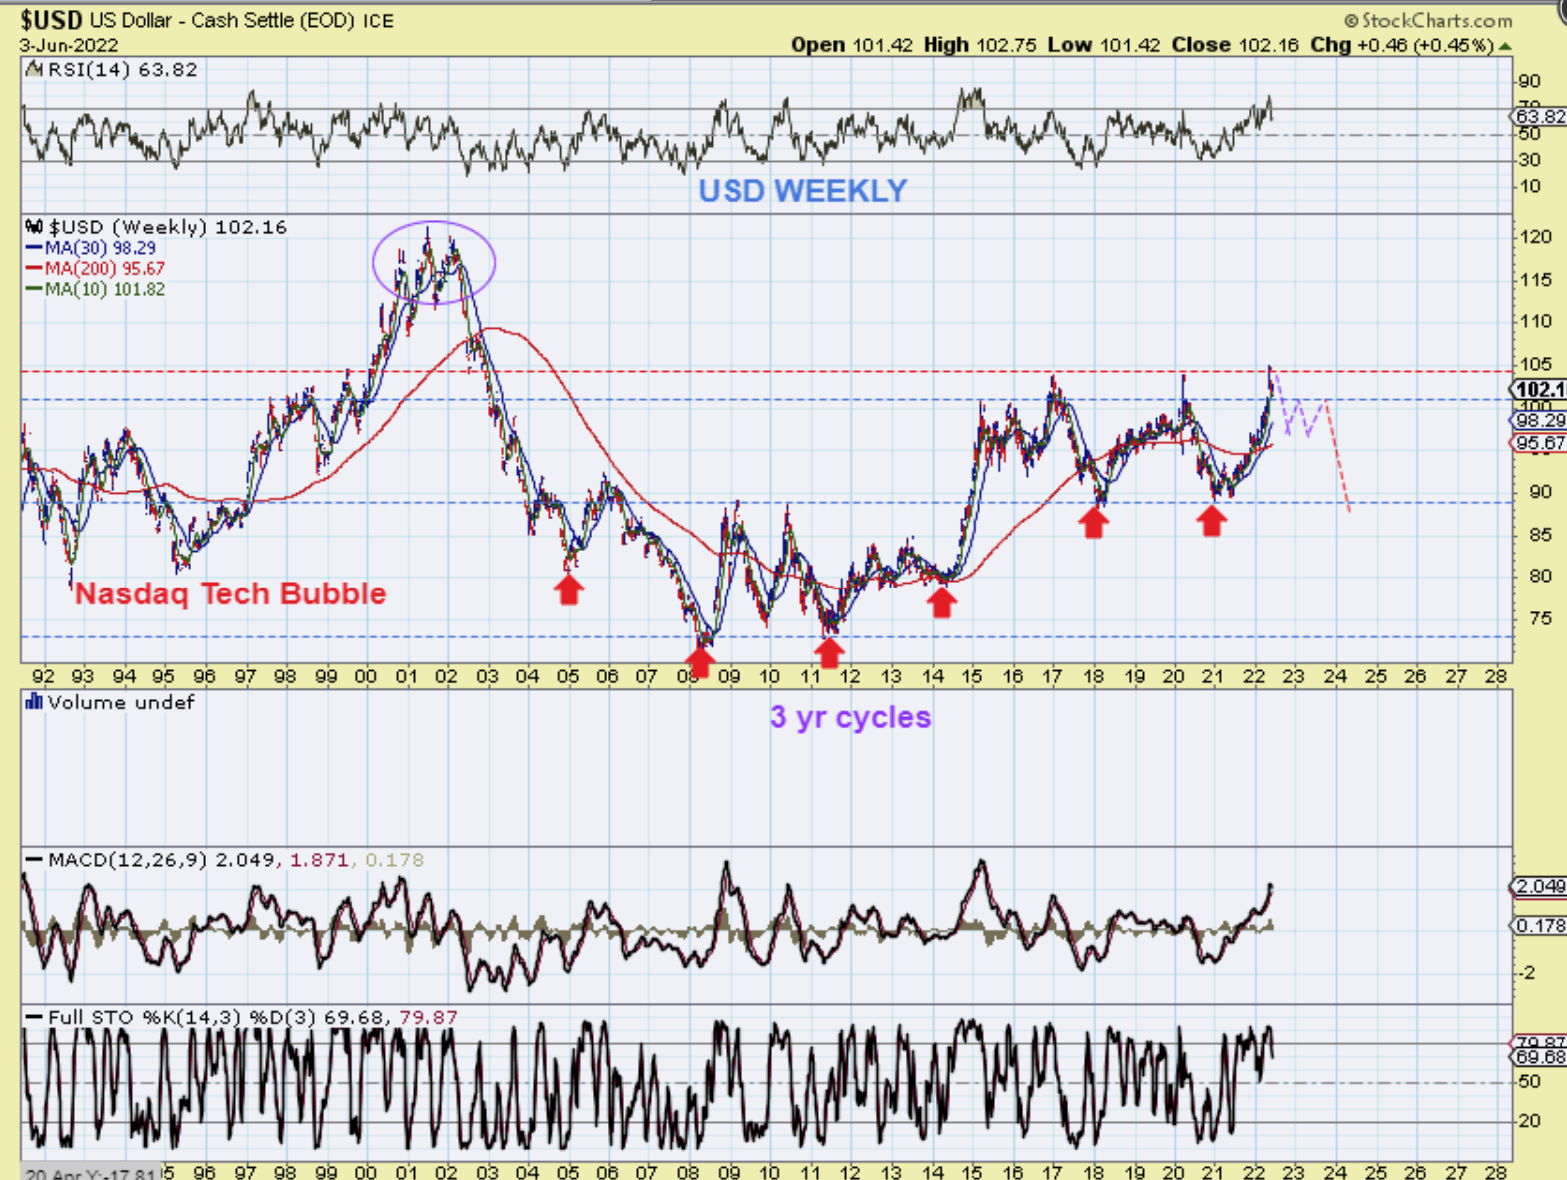
THE USD could get choppy and start to drop lower over time. This idea would help Gold, but the ABOVE break out idea may cause Gold to run into head winds again.
So now we get to GOLD.
The idea was that Gold was coming due for an ICL and I thought that we could see one in May. I was looking for this drop in April and thought we could get a MAY ICL.
We then got our drop and it was much faster and quicker than I expected into that dcl. That became a buy with a stop, and see if it plays out as an ICL or do we have 1 more drop to an ICL. THE BIG PICTURE CHARTS Looked like an ICL.
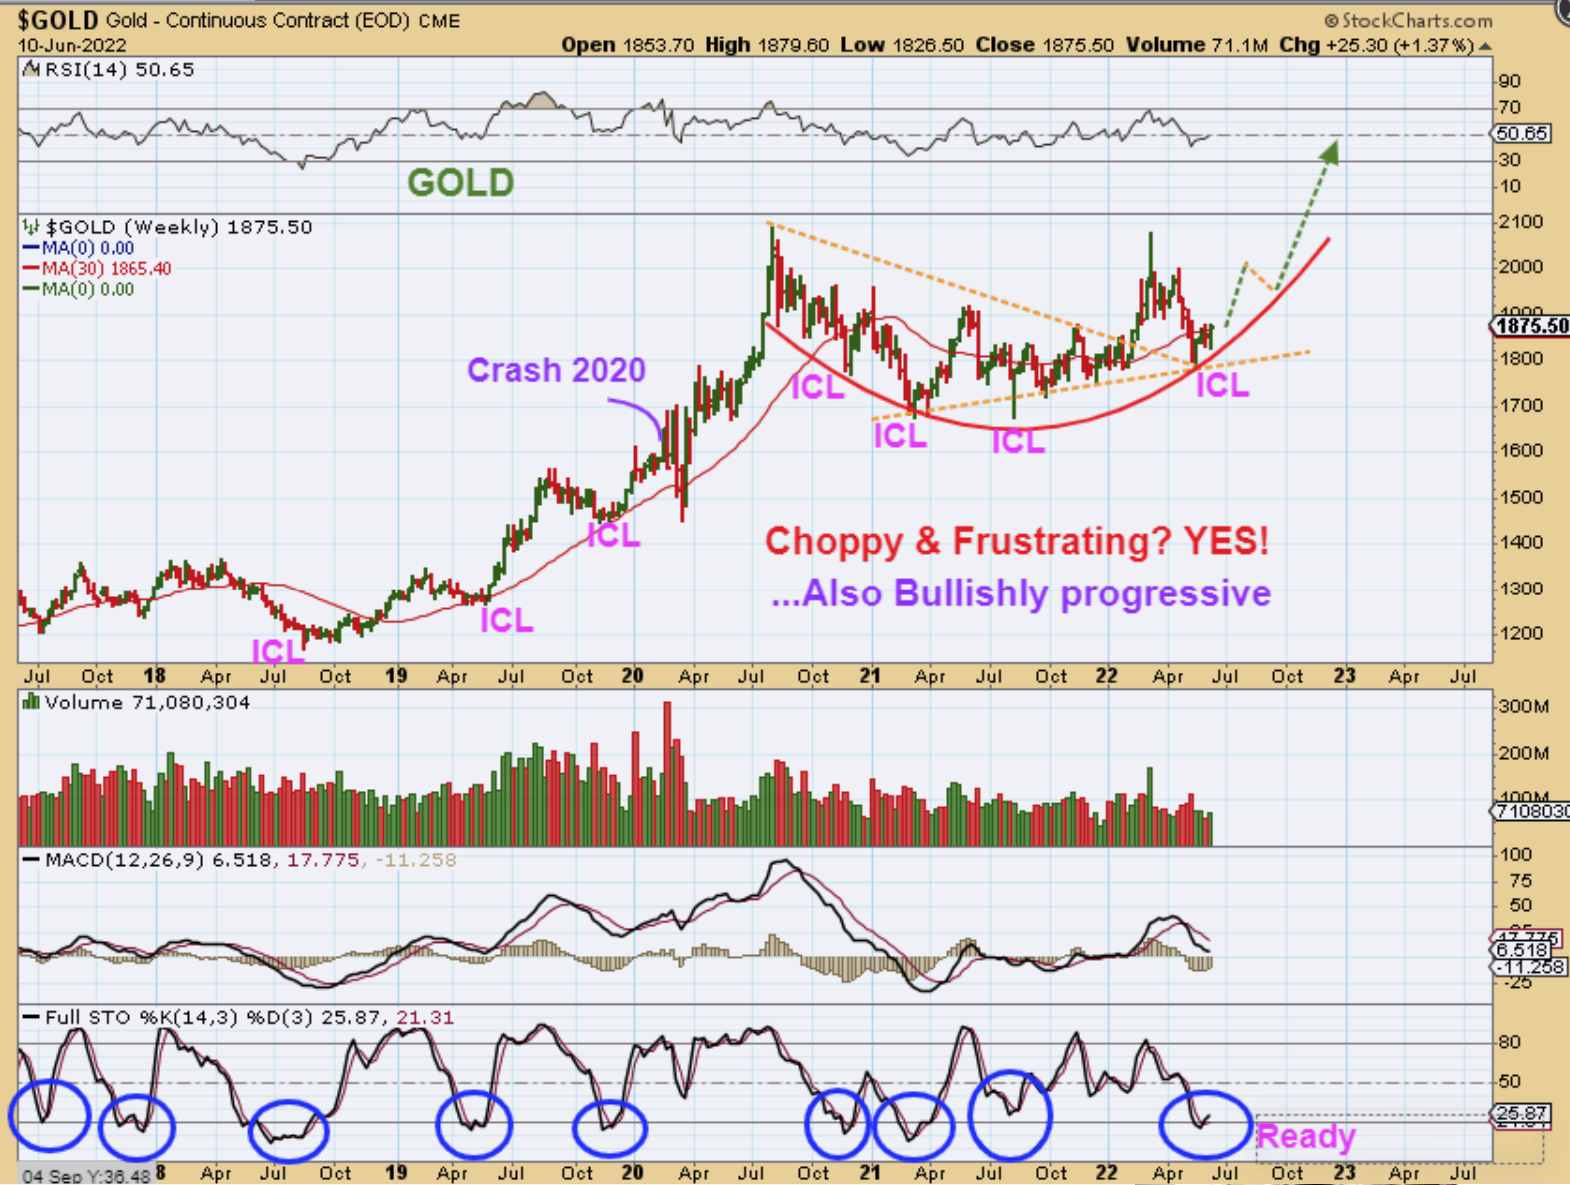
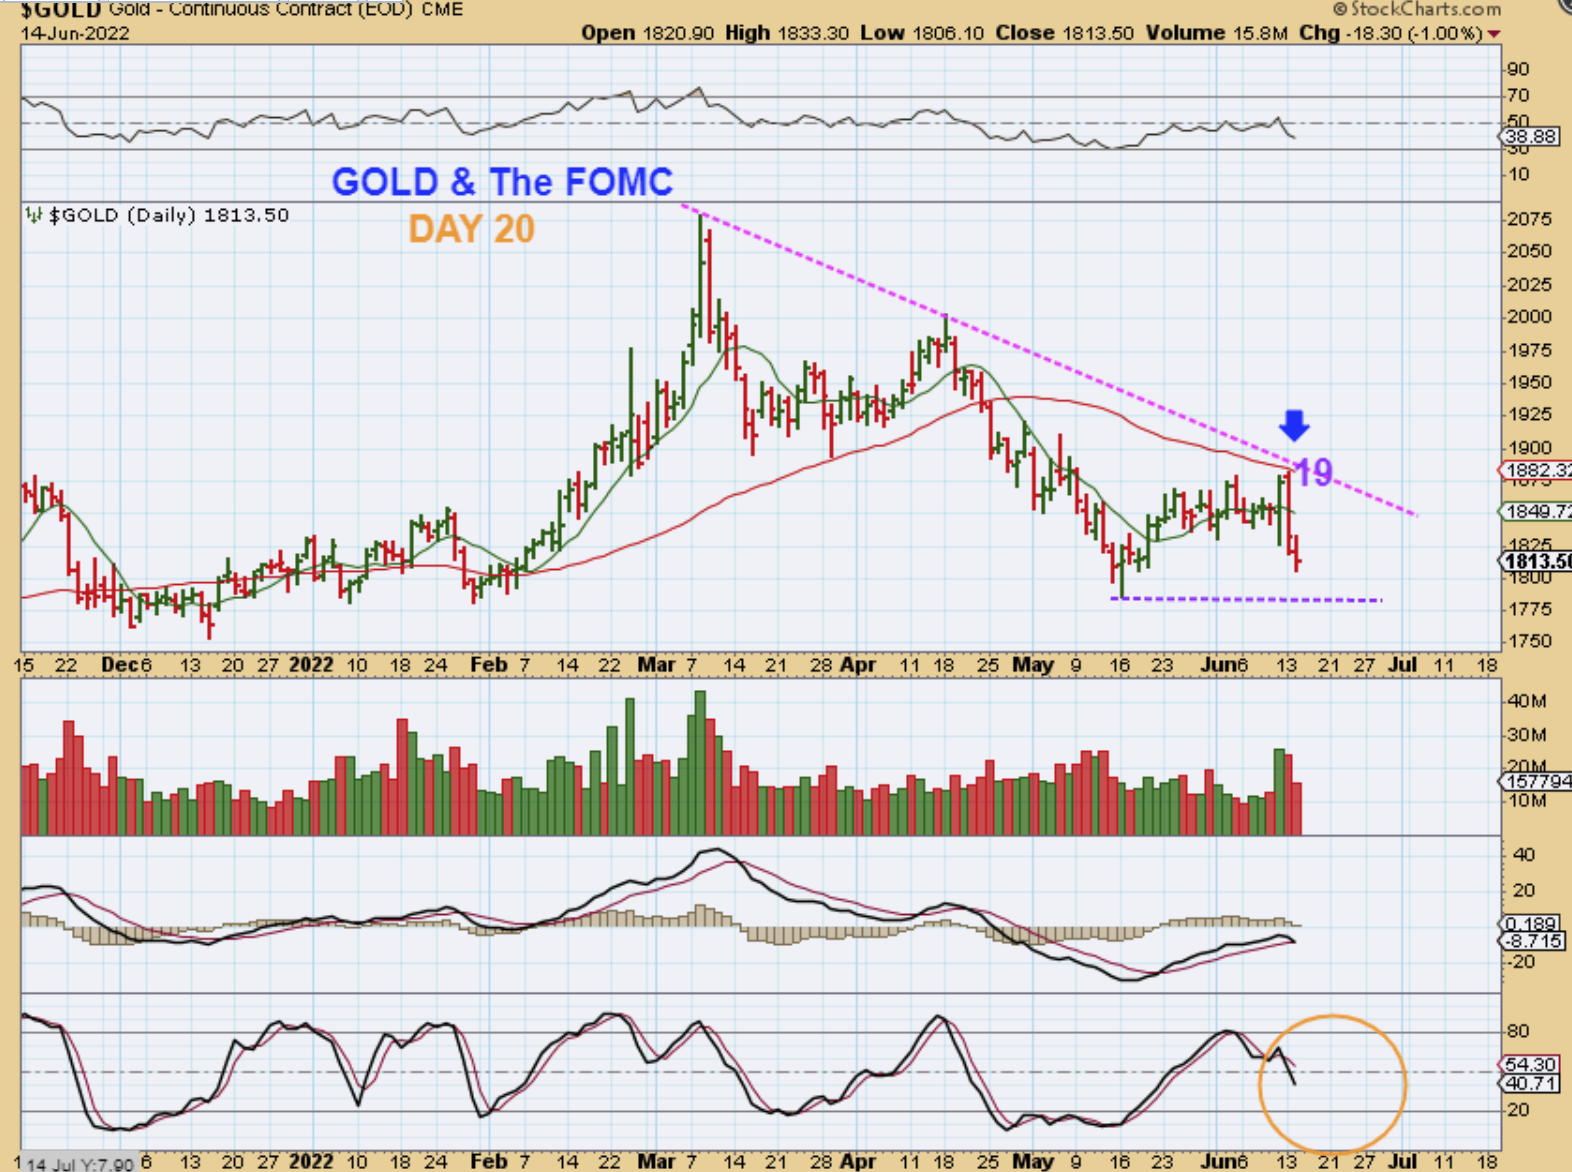
At this point: We’ll see if the Fed Rate Hike causes Gold to rally or roll over.
.
RIGHT NOW the set up looked really strong last Friday with that massive reversal higher, and this looked ready to confirm that ICL with a downtrend break out. On Monday Gold was unable to break the 50 sma or that major downtrend. An ICL will break that downtrend. Lets see what the Fed does.
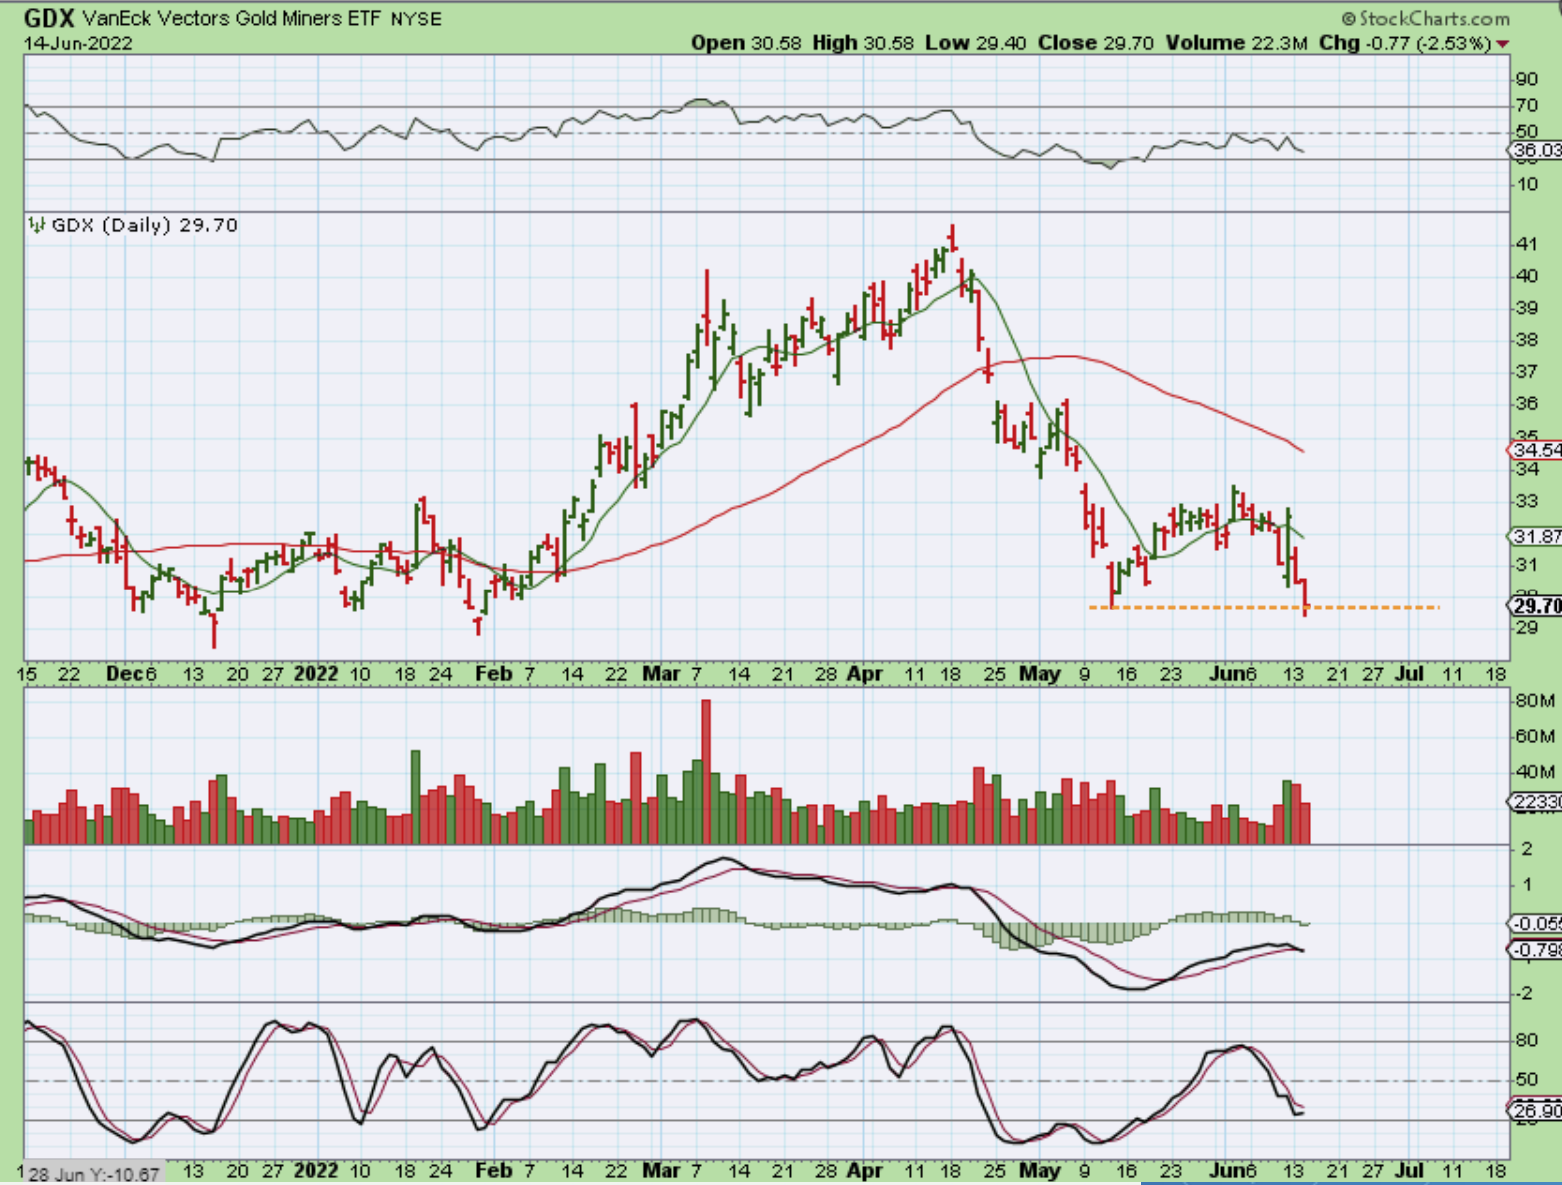
GDX : Miners always seem to overreact and even though the GDX broke the lows, Gold has not broken the lows. Again, Fed Wednesday will probably let us know if the Gold set up will hold up or not, but in the past I have seen Miners do a shake out with follow through.
.
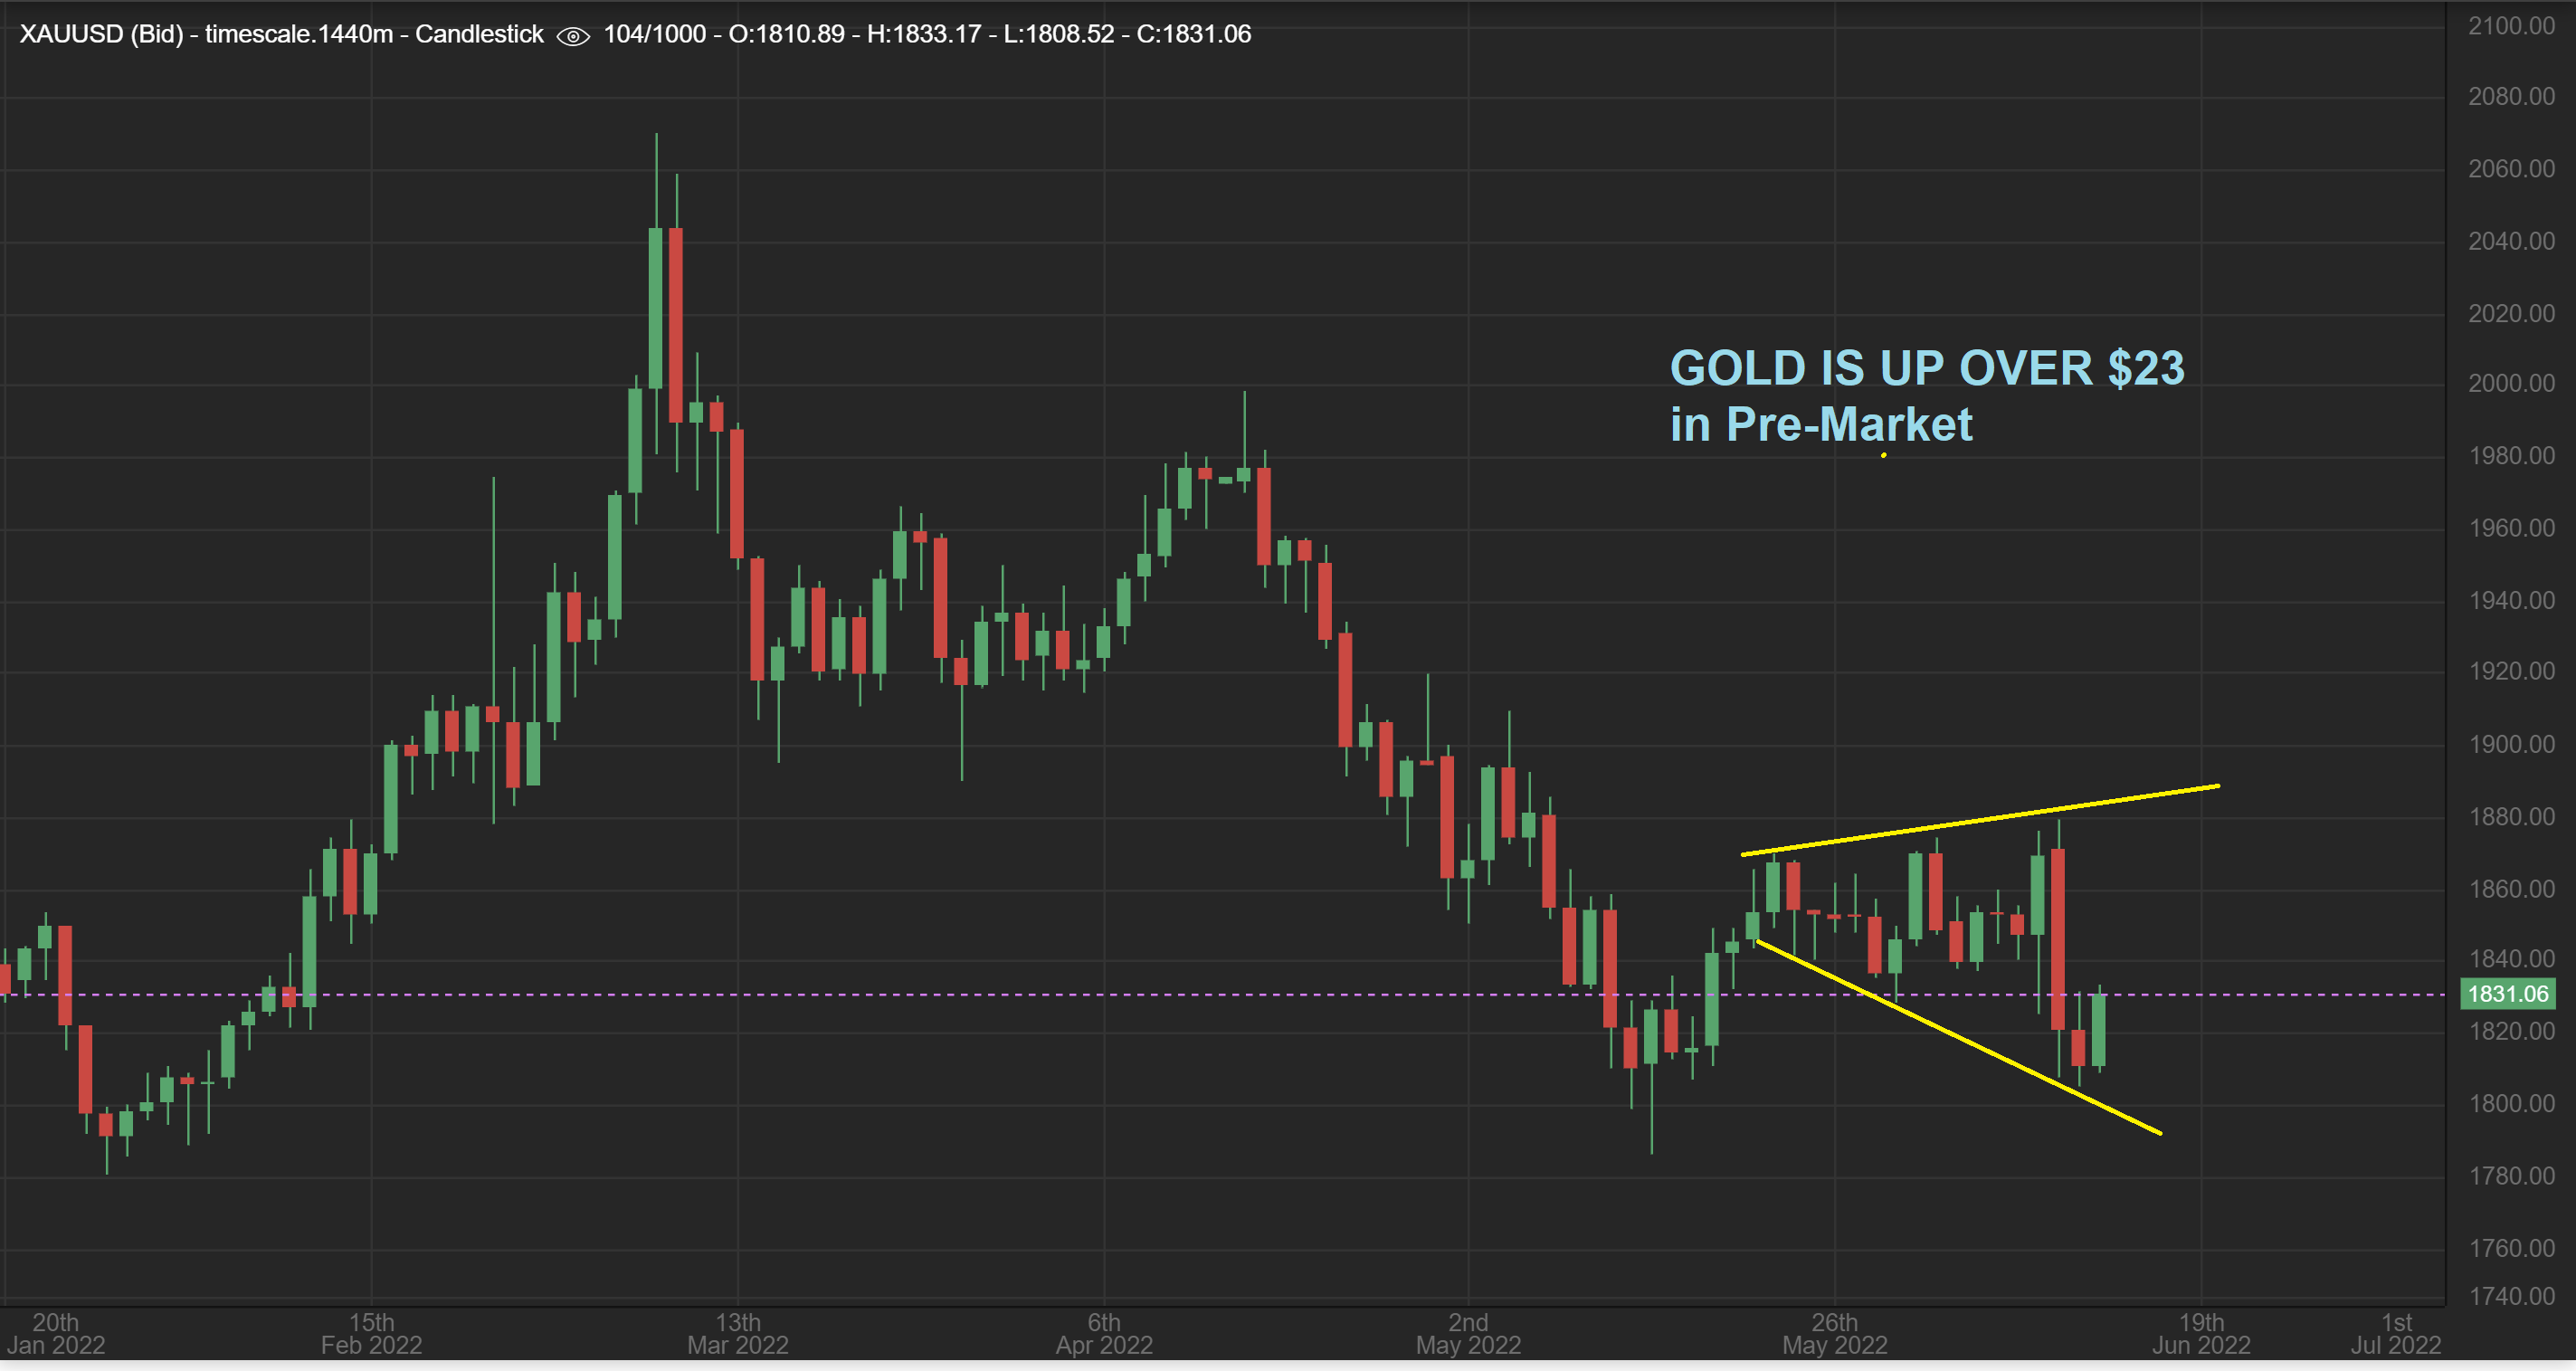
GOLD IS UP OVER $23 Pre-Market.
.
Its Fed Wednesday, and all we can do is wait and see how this possible .75 Rate Hike affects basically all sectors. As seen in the first set of charts, the volatility in both directions should be expected and is not an easy ride or a safe ‘buy’ when we get that first move at 2 p.m. Stay safe, use stops, and we’ll all just have to Stay Frosty and look for clues. Happy fed day 🙁
.
~ALEX
.
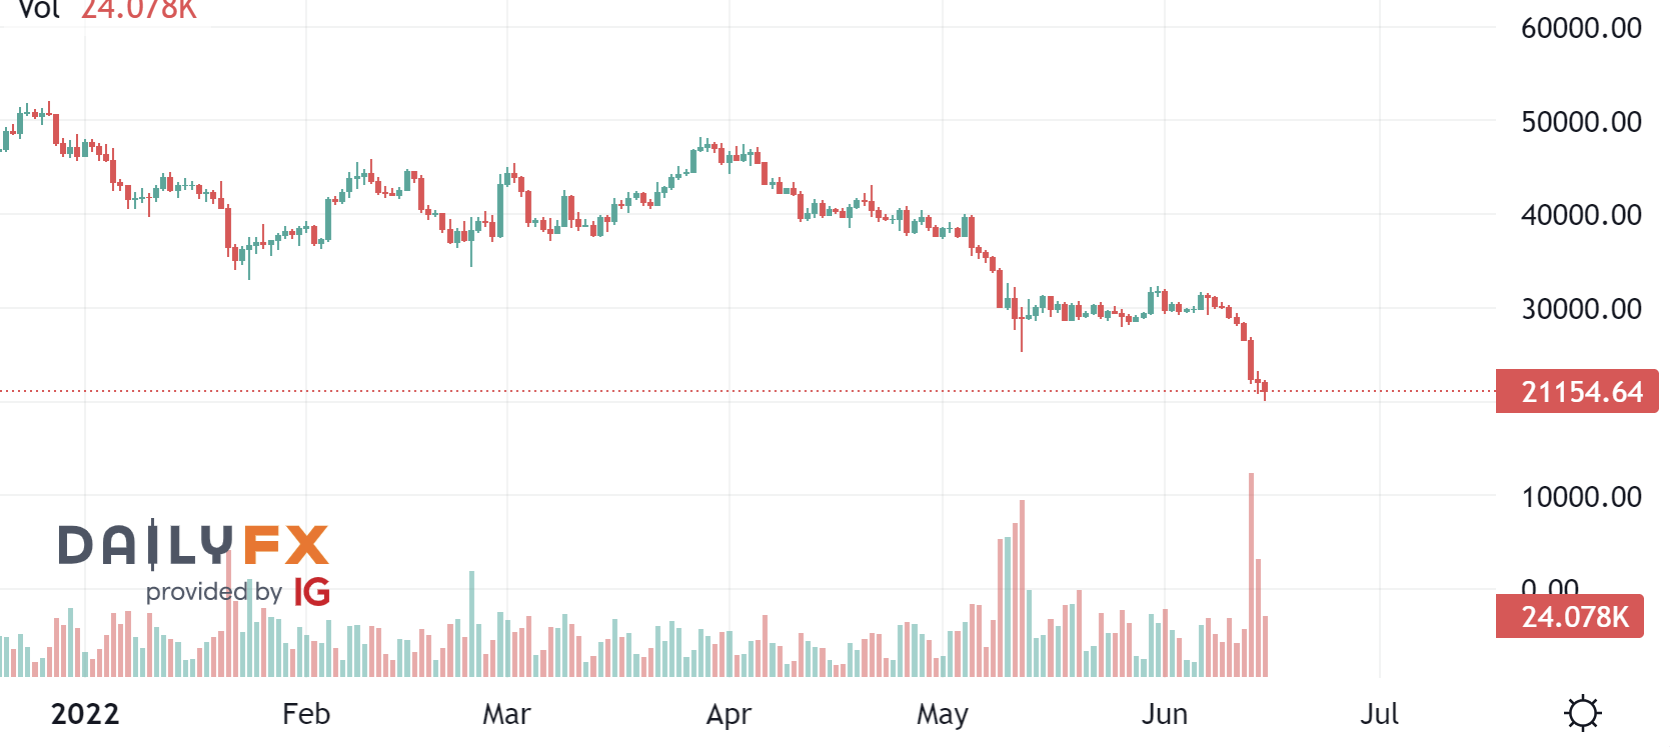
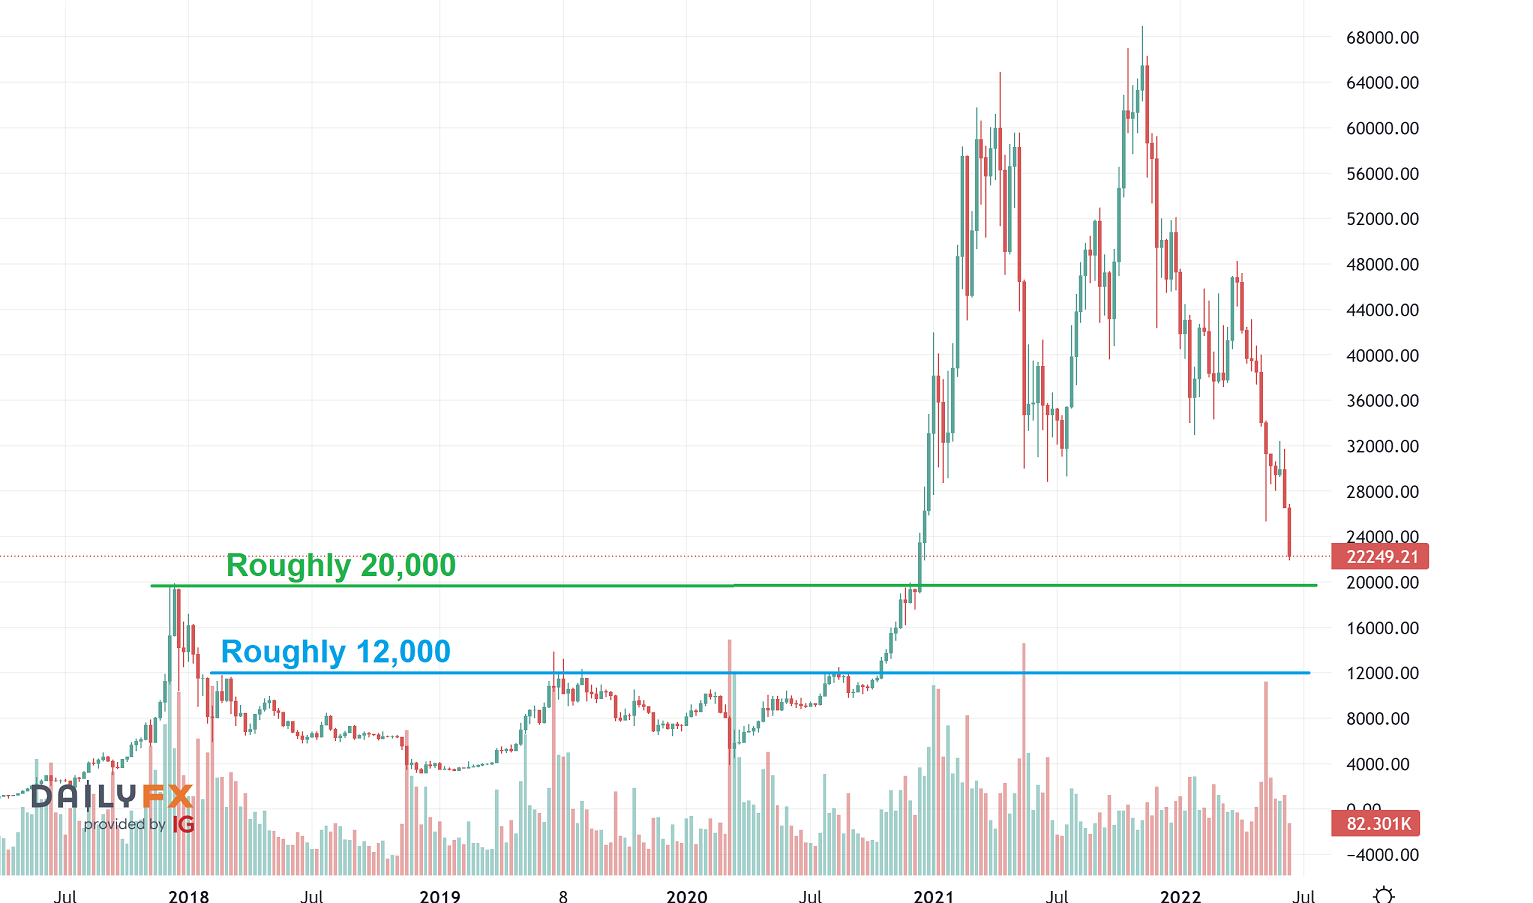
YESTERDAY I SAID ABOUT BITCOIN – Bitcoin lost support and really sold off quickly to the 22,000 area. There are areas of support near (Roughly) $20,000 and $12,000, so we may see a bounce after price tags the 20,000+ area, but people really should be patient with the crypto area now that it broke down. I think that we could see a bounce at the 20,000+ area, but let me show you something…
.
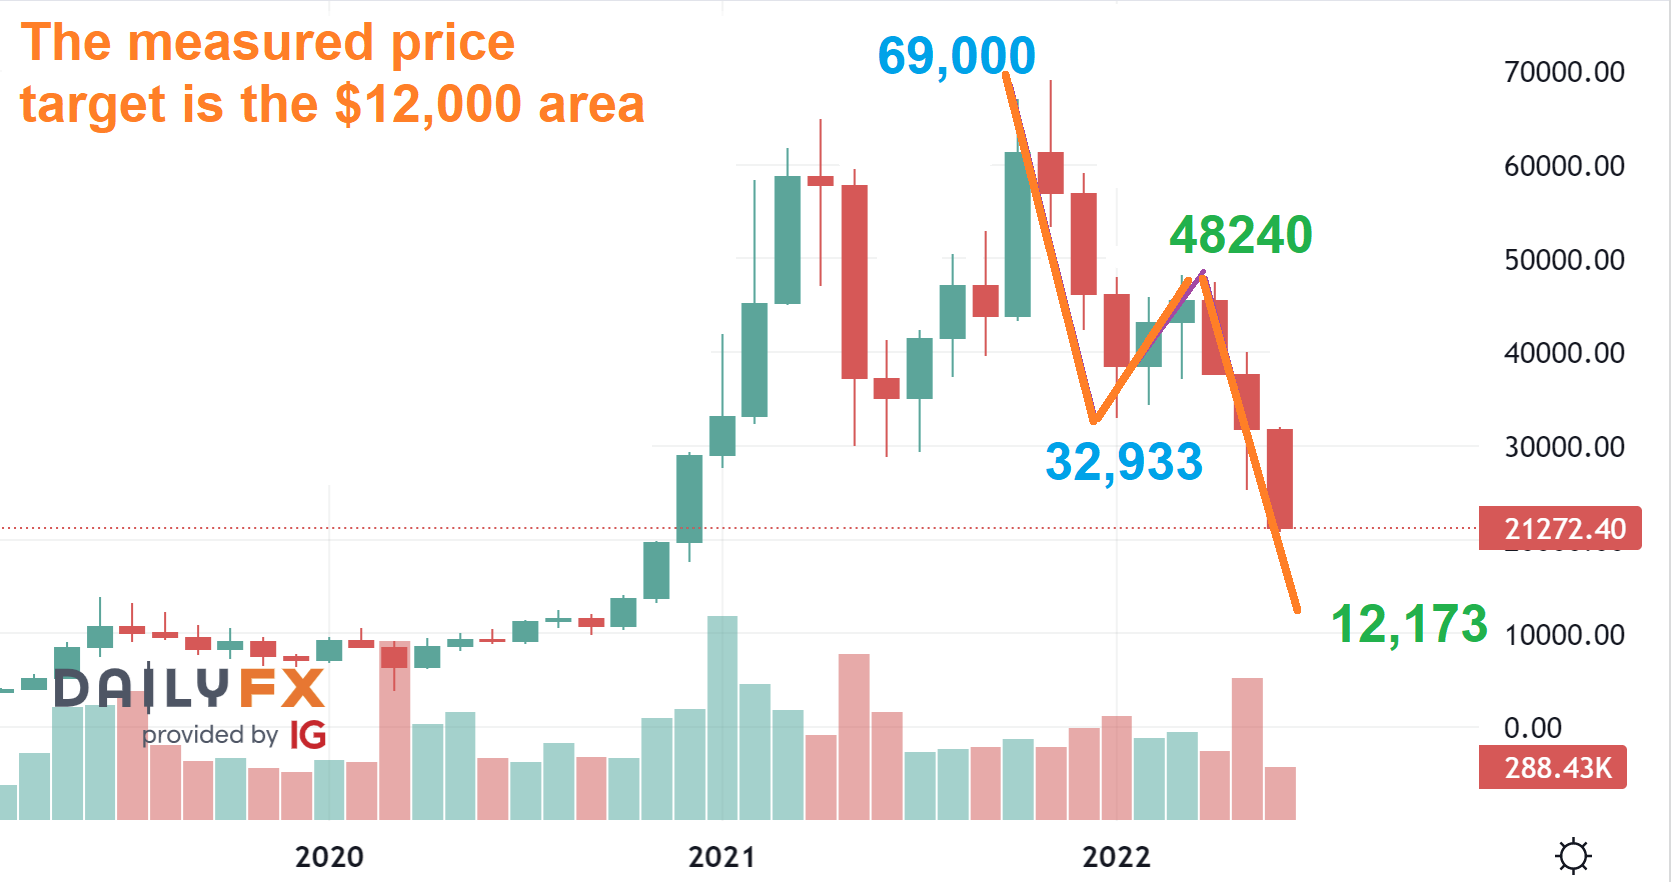
I’ll just use a Monthly BITCOIN CHART to make it easier to see. A measured move a-b-c lands in that $12,173 area. That does not have to happen, but the danger of that target getting hit is very real, especially since the stronger support doesn’t come in until that 12,000 area. It is best to let this play out.
BITCOIN – No Change, possible reversal and bounce.