JAN 2, 2021 – The Big Picture Weekend Review
In a January 2021 report I could actually go through every Daily, Weekly, Monthly Quarterly and now Yearly chart to see how we’ve done and where we are, but at this point I think we all know from past reports where we are. In this weekend report I’m going to cover a mixture of charts in this Big Picture Report as needed, and in the weekday reports I will cover the details as I usually do.
.
Please let me start with this warning though: A couple of weeks ago I mentioned that the markets are entering that point where they can eventually get unsustainable. You may recall me mentioning things like the ‘Put Call Ratio’ getting overly bullish, the Vix was at the lows, Sentiment and other indicators that I use are showing that as the markets continue to ramp higher, eventually it can top out in a parabolic blow off top type of manner. This is still true, because a steep ramp up can eventually become unsustainable. In other words, we could even eventually experience a crash in 2021. That said, These markets began to chop sideways for a bit and continued higher and they CAN keep going higher from here too.
Why do I mention this? I LOVE the enthusiasm of my readers, they are traders at heart, but I got an email where one reader here mentioned along with ‘Long Miners’, he has been shorting the General Markets too. To Quote: “I am shorting this fat bloated pig for the crash.” 🙂 LOL, like I said, I love the enthusiasm, but please know that I warned back a couple of week ago too that these markets can just keep stretching higher too. This is NOT YET a good place to go short. Why? There is solid risk in shorting any Bull Market since “surprises come to the upside.” So lets get to the charts and address that now! 😉
.
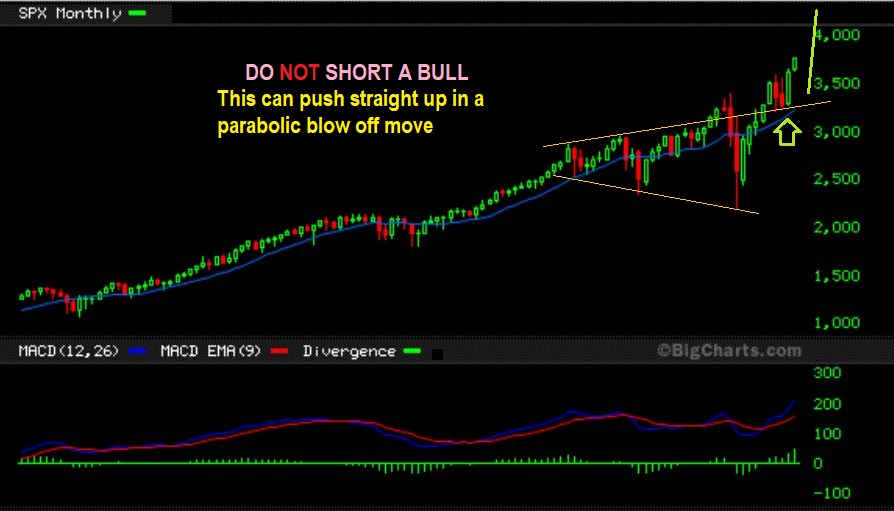
SPX MONTHLY – Using a Monthly chart you can see that we broke out from a megaphone and even back tested it at the last ICL (Intermediate Cycle Low). Coming out of an ICL gives us a likelihood of the ‘surprise to the upside’ and this CAN go higher for a month, 2 months, who knows. So…
.
The Same chart: It is even possible that the drop to back test the break out ( Green arrow) was only a 1/2 way mark in the run higher. It may not be, but it could be and if that is the case it can run higher for 2-3 more months, right? I’ll watch it day by day, but this is not a good ‘short’ if it goes parabolic. please read the chart.
.
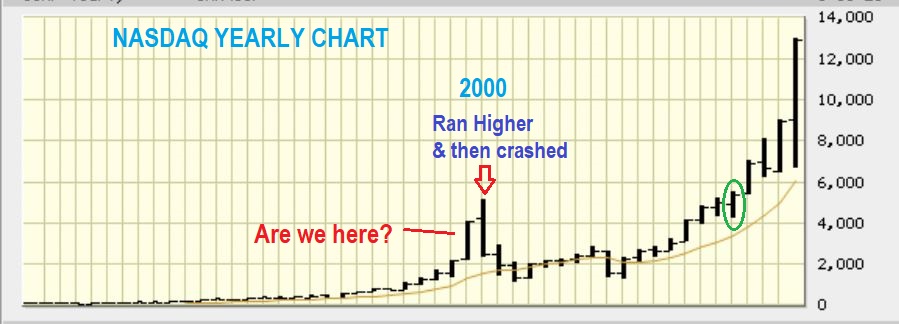
WOW! The NASDAQ YEARLY CHART is pretty amazing for a year like 2020, where many small businesses and restaurants, movie theatres, etc suffered from Covid slow down, but this is tech and this year was truly entering a blow off top phase. It is a yearly chart, so can this go on for 1 more year? Or will it top as seen in 2000? Time will tell, but I do think that this will enter exhaustion. Please read the chart.
.
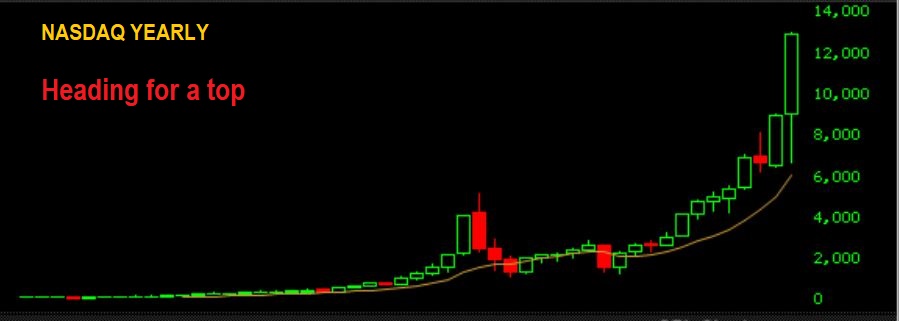
NASDAQ YEARLY – I just wanted to also show the candlestick pattern view too, on top of the SPX. Yes they look extended, but this just isn’t a great place to start a ‘short position’ without true signs of a top. This can run higher.
.
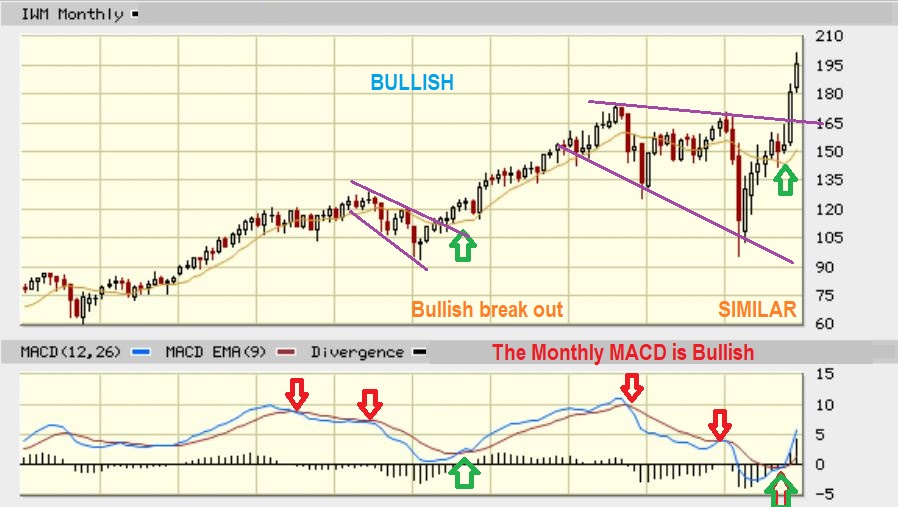
IWM MONTHLY – The small caps started to break out after a slower start this year. Well, for now I wanted you to look at the similarities between this break out and the one in 2016. Even the MACD is a perfect match and it ran higher from there. A straight up run is taking place this time, so it may exhaust quicker, but Small Caps can run higher too.
.
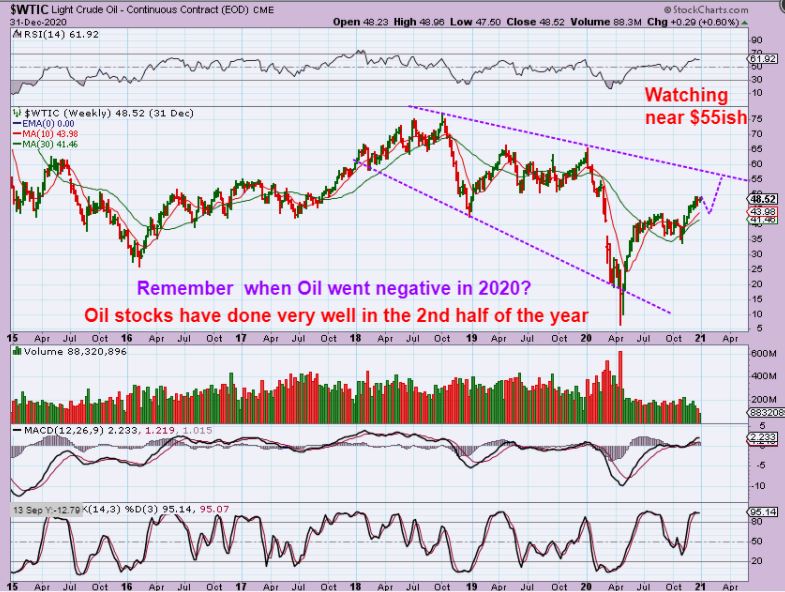
WTIC WEEKLY – Using a weekly chart for Oil, you know that I have been bullish Oil for the last couple of months in 2020. Some Oil stocks that we invested in actually doubled. I do expect a dip down into a dcl soon and I am thinking that it will take a run at $55 ish. Then it will need to be assessed from there. It may break out or it may stall.
.
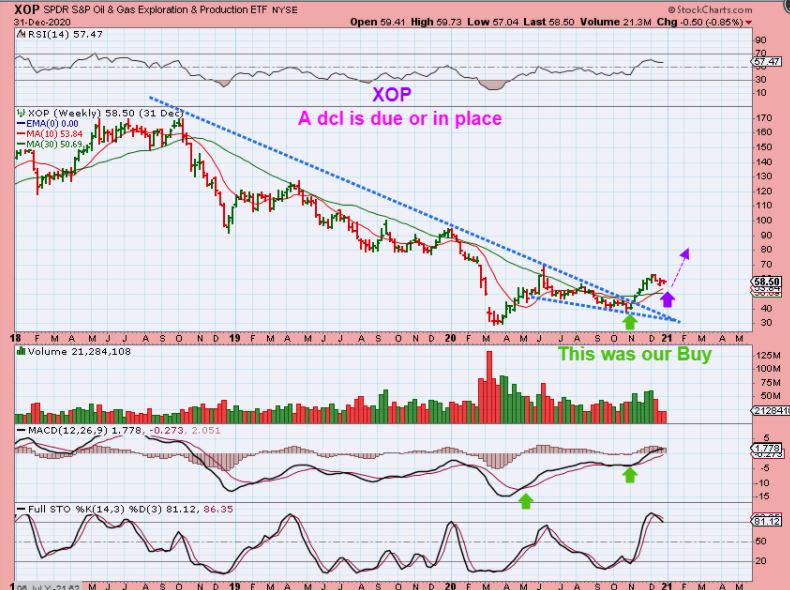
XOP WEEKLY – This Green Arrow is where oil stocks bottomed and the buy was the break out from the downtrend line. Many Oil stocks doubled. This sector is currently experiencing a chop sideways/ down into the first daily cycle low ( DCL). The second daily cycle should be bullish for this sector too…
,
NOTE: The second daily cycle for the Oil stocks should be bullish too, but based on emails that I get, I expect that many of us will be buying less in this area and more in the Miners. My focus will likely be more on the Miners since I expect that the gold stocks will begin to play catch up to our Silver stocks. IF YOU HAVE AN OIL STOCK THAT YOU WANT ME TO COVER, PLEASE FEEL FREE TO ASK. I covered MRO, VLO, ERF, WTI, CPE, APA, AROC, LPI, and a few others on the last run.
/
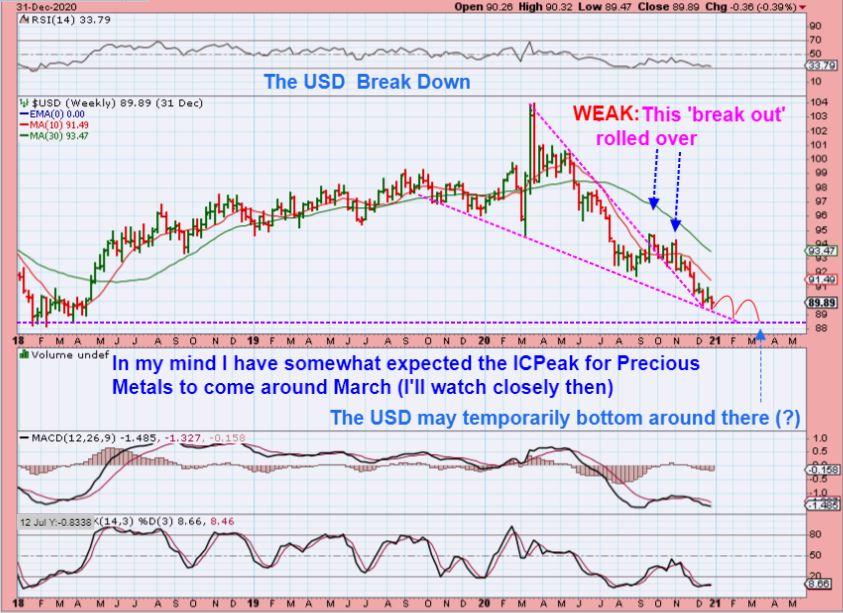
USD WEEKLY – The USD sold off all year. The USD actually broke out from a downtrend when it put in an ICL in September (and Gold stocks peaked and sold off into their ICL), but then the USD rolled over after that break out. Please read the chart.
.
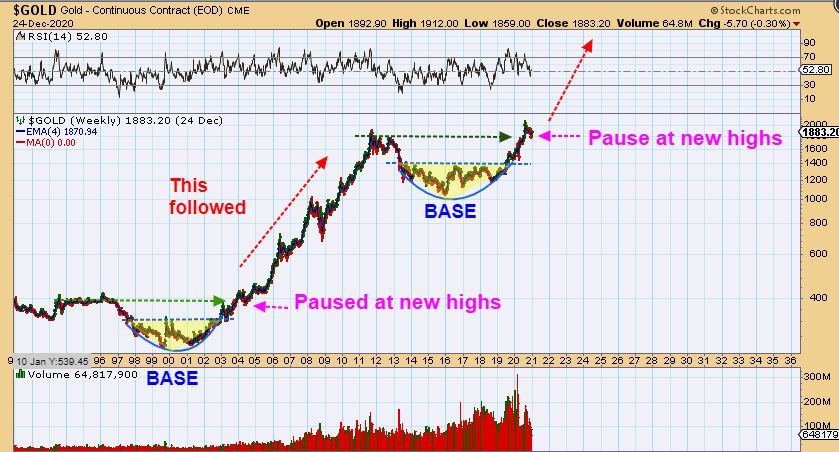
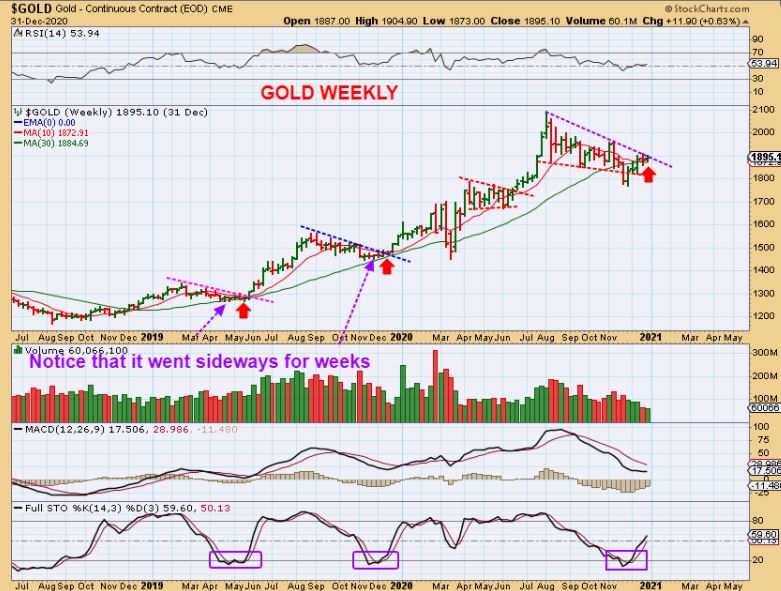
GOLD WEEKLY – This is a Bullish set up and an ICL should be in place from the November lows, we are just waiting for a break out above this trend line. So look at this chart and look at the rally after each break out above trend lines at past ICLs. We saw weeks of upside follow and I expect that here too. Also notice that at times we see sideways chop for weeks after an ICL is in place under the trend line. This scares people out of their position with every drop, fooling them into thinking that ‘this is too weak and has no buyers’. You also may hear things like ‘ People are buying bitcoin, so they don’t want Gold anymore’. Do not let that kind of talk fool you. In a Bull Market such as this multi-year Bull Run, we will see an upside break out after an ICL. Read the chart.
.
GOLD WEEKLY – What am I doing with this chart? After a strong run, when everyone is nothing but Bullish & Giddy over the Precious metals, we need a re-set of sentiment and the indicators. For example: After the run from this past March to September, I said that I sold my leverage and most of my Miners in August/September and it was hard to convince people that we’d pull back & stop running higher. Now it can be hard to get some people to re-buy a month ago. I wanted to point out the MACD re-setting on this drop. The MACD here pretty much matched the 2011 top and has now pulled back to the top line.
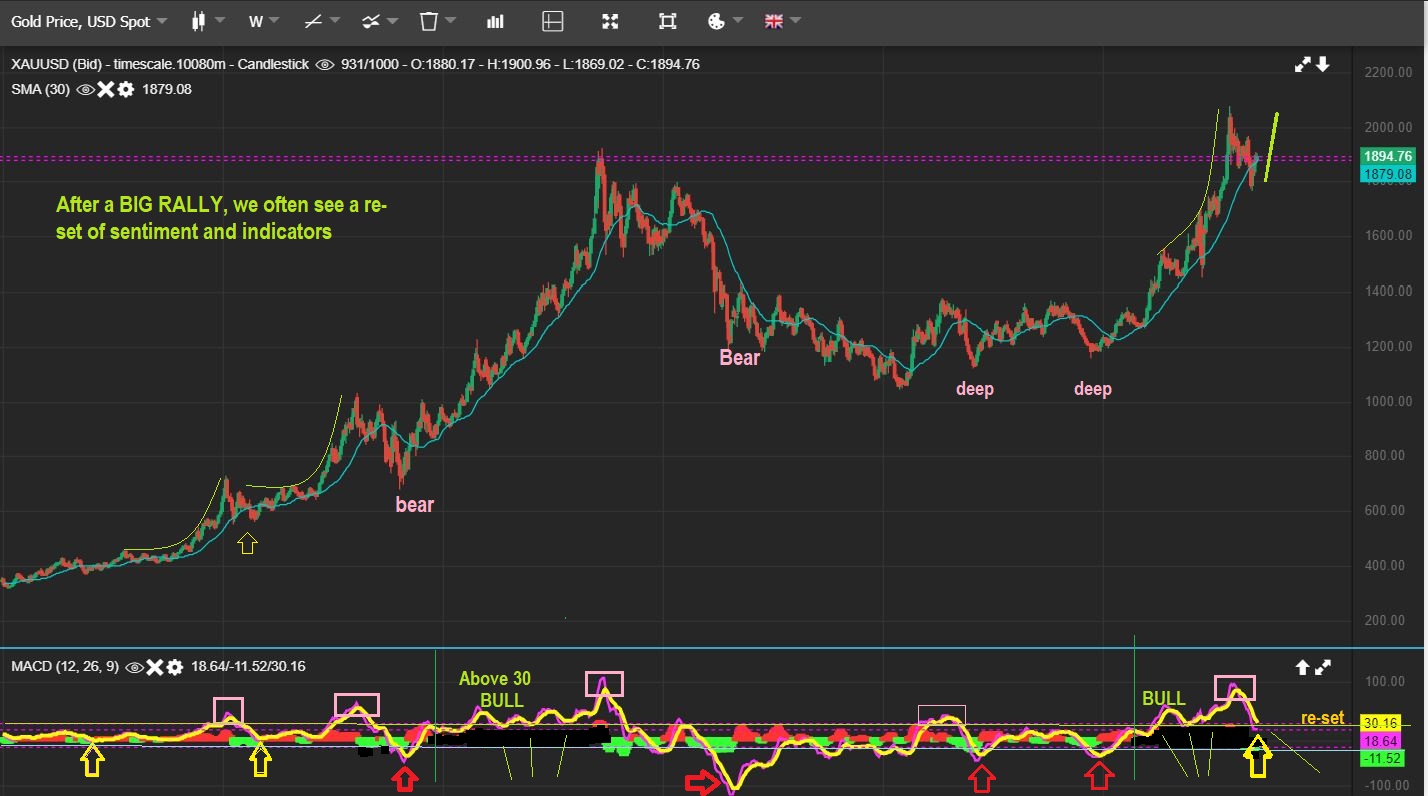
,
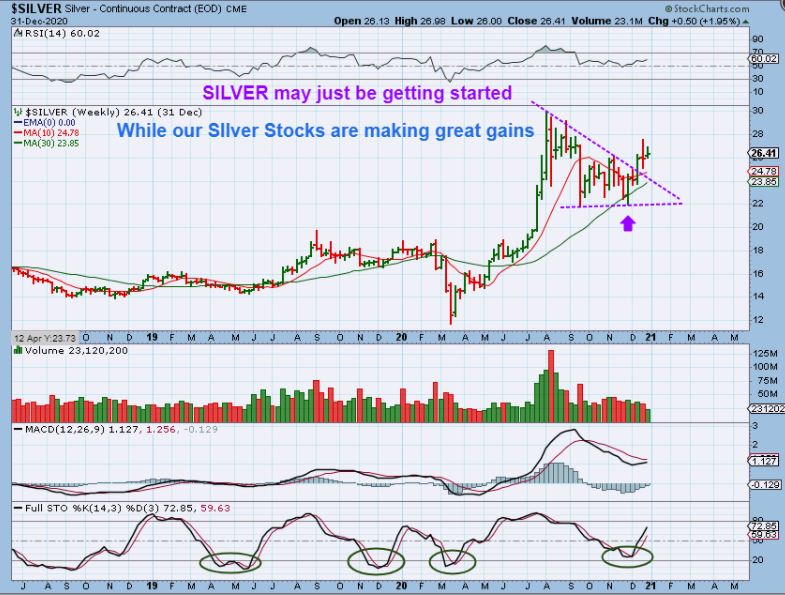
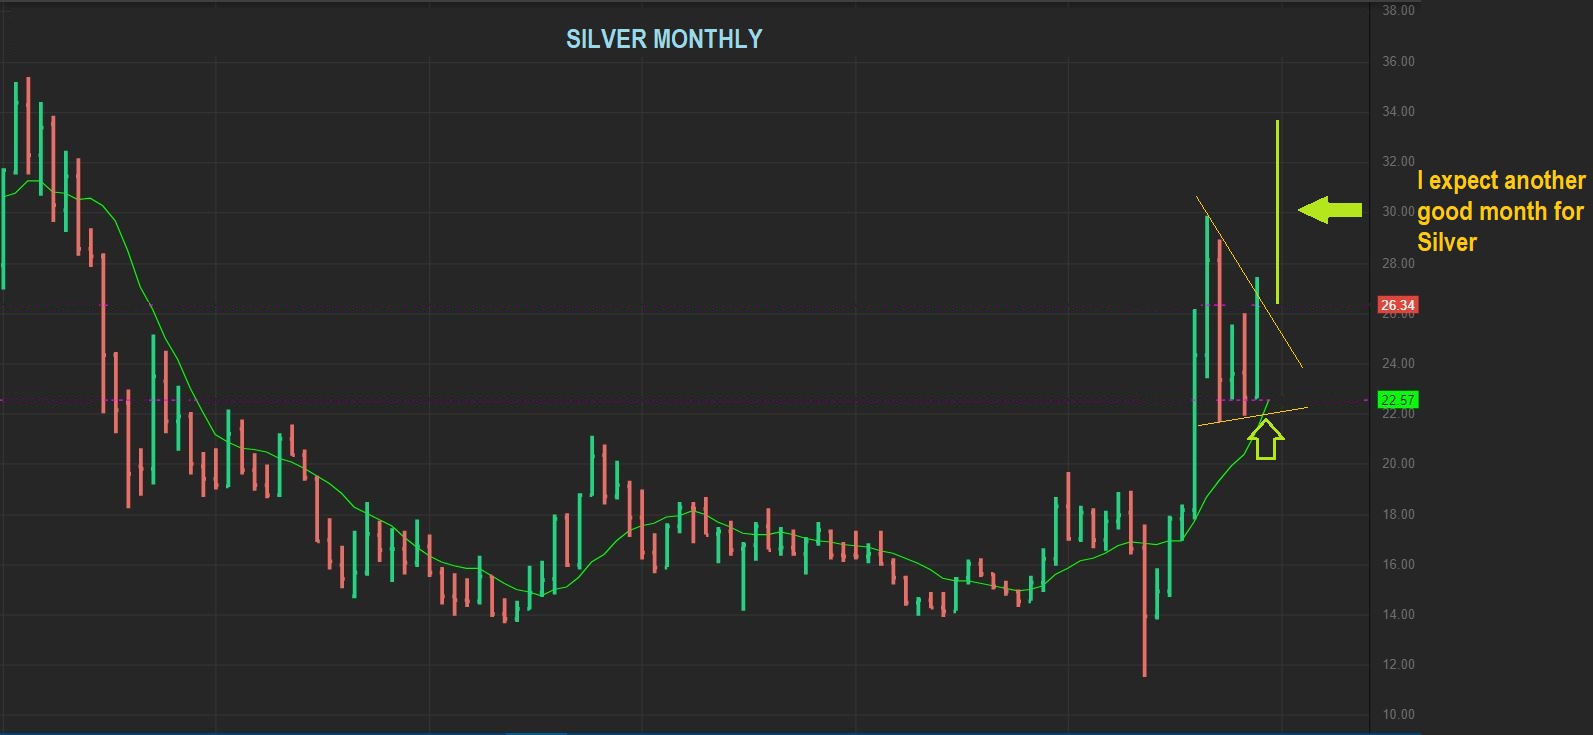
SILVER WEEKLY – Unlike Gold, Silver already broke out from the downtrend. Our Silver Stocks have really made great gains already, with some at the 2020 highs, and that has happened with Silver just starting to break out. I also think that Gold stocks may play catch up when Gold finally breaks that down trend line. Silver has room to continue to run higher, so let’s look at the Monthly chart…
.
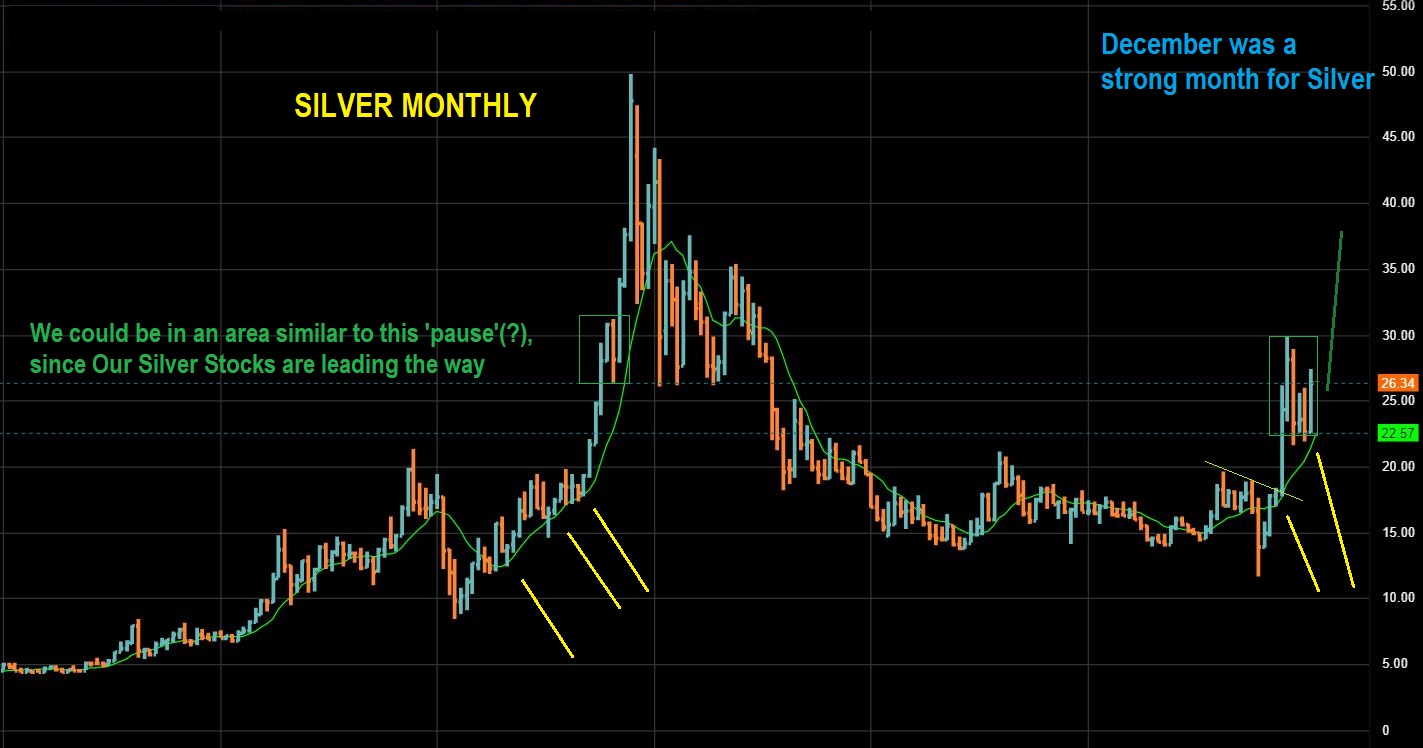
SILVER MONTHLY – At the end of the Month of December you can see that Silver reversed right off of support and looks ready to end this pause. Notice the comparison to the pause in 2010, which was a 1/2 way move.
.
SILVER MONTHLY – Zooming in, I would expect this reversal and break higher to continue. Our Silver stocks are leading the way. See 6 month daily charts of CDE, AAGFF, EXK, AXU, etc.
.
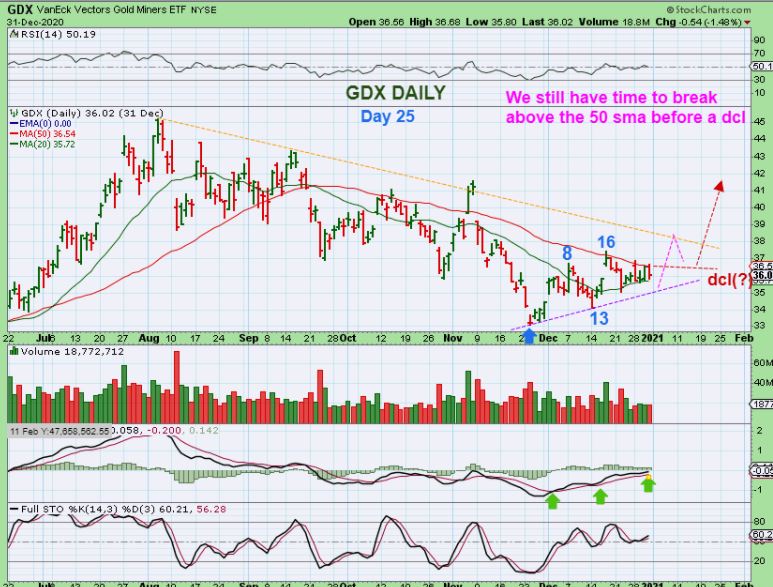
GDX DAILY – I wanted to start with the daily chart using cycle counts, since GDX is still below the 50sma.
We usually get roughly a 33 day daily cycle (Give or take a few days). This is a choppy first daily cycle and we are on day 25. This can break higher and run and then dip to a dcl as a back test as drawn here. I say this because Gold looks like it may break from the down trend line, and when that happens I think that Gold stocks will start to push higher too.
.
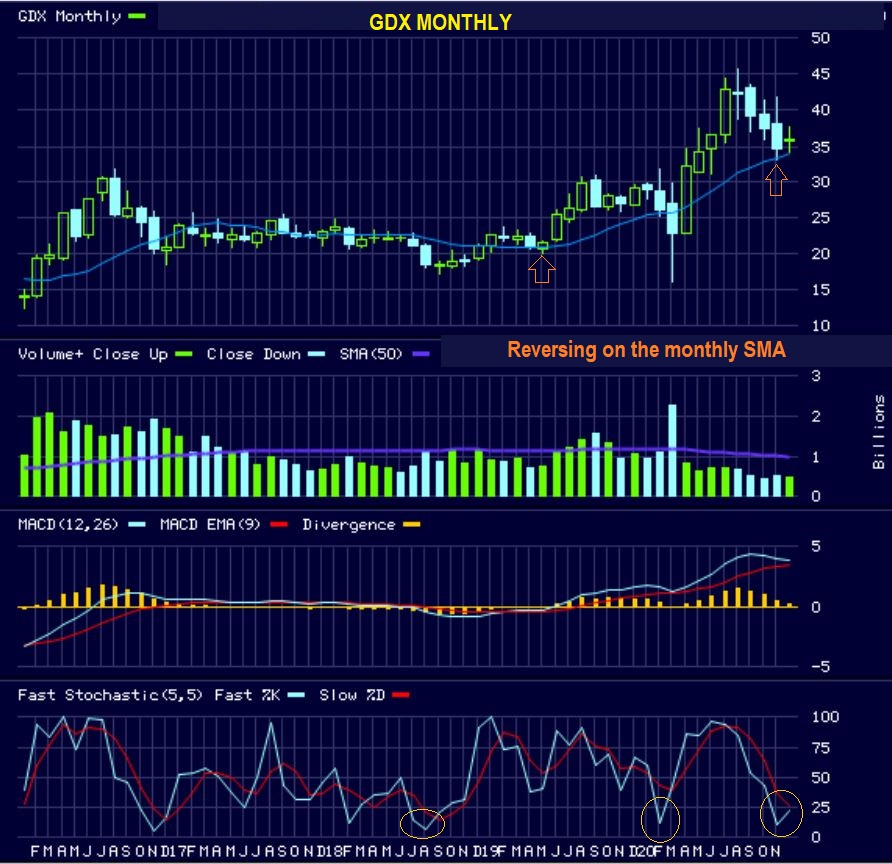
GDX MONTHLY – As of the end of December we see a Doji Candle and this is the 2nd week that reversed or held right at support. The Fast Monthly Stochastics turned higher and I am expecting this support to be the low ( ICL) of the next run higher, similar to the first orange arrow on the chart. So while the GDX lags a bit…
.
So while the GDX lags a bit…
.
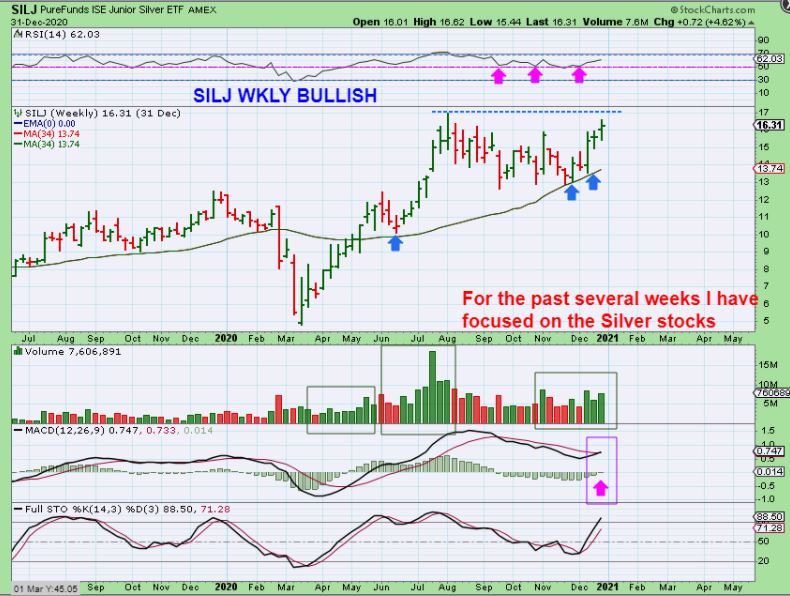
SILJ WEEKLY shows us that the Silver Stocks reversed off of support too, but they have already been running higher and are already near 2020 highs! This is why I have been primarily focused on getting us into Silver stocks while they were at the lows. They had better technical set ups. So SILJ is almost at the 2020 highs already and the weekly MACD is about to bullishly cross higher.
.
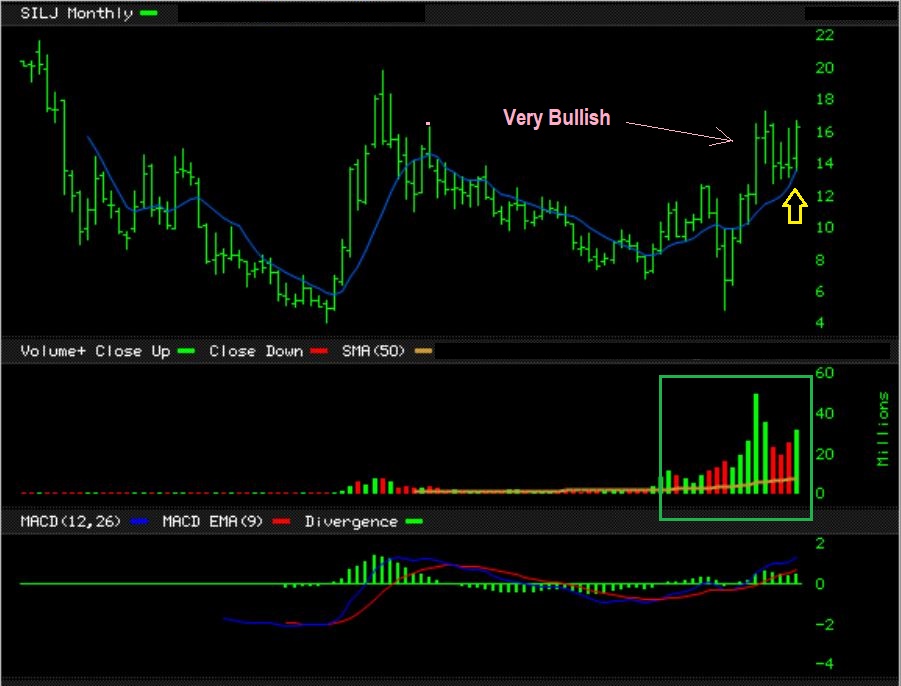
SILJ MONTHLY – This is a nice solid consolidation for SILJ too. Notice that for Sept, Oct, and Nov it closed at the lows each month (false starts). December just closed near the highs and that consolidation should be finishing up with follow through higher expected. We have been buying Silver stocks and that opportunity to buy near the lows is fast running out.
.
As you can see, we have Bullish Charts in just about every sector:
.
– The General Markets are getting extended, but they CAN continue higher so shorting them is quite high risk. A parabolic blow off top is likely, so we just need to continue to pay attention along the way and use stops.
.
– Oil pushed out of the ICL and the Oil stocks bottomed and put in some great %-Gains too. This push higher can continue in the 2nd daily cycle too. I am expecting Oil to get to $55ish, and I’ll pay closer attention as it gets there.
.
– The USD broke down and has continued lower. It can drop further and any bounces along the way ought to be short lived until it puts in another ICL.
.
– Precious Metals:
Gold is at the 50sma on a daily chart and should break out soon. The Weekly & Monthly set ups are Bullish. On a Daily chart the next DCL (Daily Cycle Low) is coming due, but the break out higher above that 50sma can come either this week or after a dcl is in place.
Silver has been leading and broke the downtrend line already with silver miners moving nicely higher.
Miners – GDX , GDXJ, and SILJ are all bullish set ups too. I think when Gold breaks out above that 50sma & runs we’ll see some of the bigger Miners break higher too. NEM, AEM, BARRICK, etc. , have struggled so far, but our Silver stocks like CDE, AAGFF, EXK, AXU, etc are on their way, as you can see here.
.
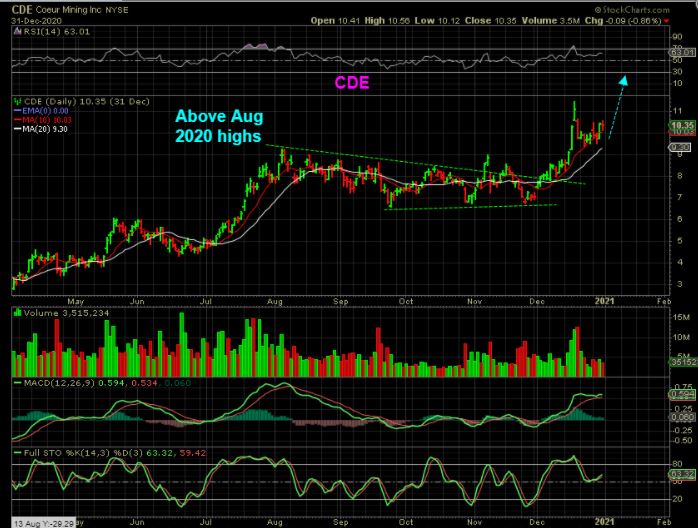
CDE is already above the 2020 highs and we caught this at the lows. It can be a buy and hold since the pull backs may be shallow or sideways.
.
With some Silver miners up near or even above the 2020 highs, PAAS has been a little bit of a lagger for Silver Stocks, so let me point this out now.
.
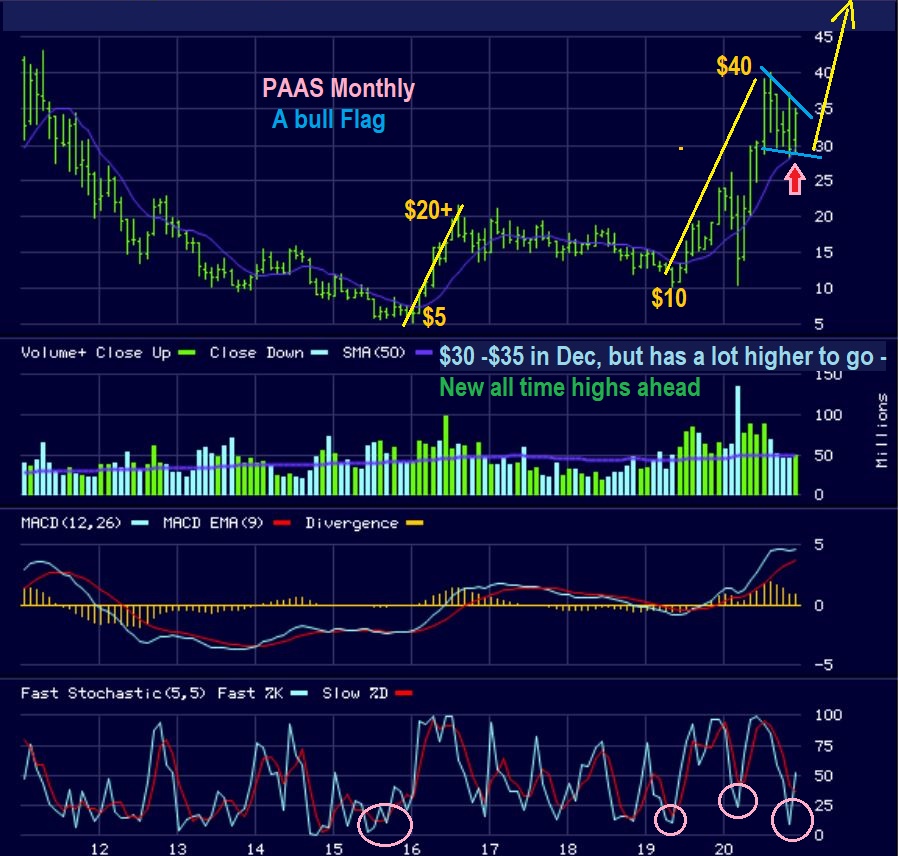
PAAS MONTHLY –
1. In 2016 PAAS ran from $5 to $20.
2. Recently it ran from $10 to $40 and has now pulled back to about $30 on the 10 month M.A. PAAS is now only near $35 and the weekly and Monthly charts are bullish, so…
3. PAAS becomes a buy for those longer term ‘buy & hold’ investors looking for a bullish Silver stock somewhat still near the lows.
4. This bottomed at $30 and its only at $35, and I think it has a lot of potential to run much higher.
.
Rest up and enjoy your weekend, because next week is the start of our trading in 2021 and the excellent trading that we have seen over the past few months still looks as though it is set up to continue. The Miners also look very promising and ready to add to the gains in the coming weeks too. 
.
As always, Thanks for being here at Chartfreak with me!
.
~ALEX
.
.
I SAVED THE BEST FOR LAST:
.
GOLD WEEKLY – If I was to say that we are following a similar pattern to the cup like base and break to new highs formed from 2000 to 2005, then we would be finishing up the ‘pause’ after it broke to new highs and we should be on our way to new highs again too. Notice the small pull back or pause and then the rally that followed. I think that we are in for another excellent year in the Precious metals sector as Gold rallies higher.