December 30
Well yesterday certainly didn’t feel like that year end ‘melt up – Christmas Rally’ that I’ve read about. 🙂 When the U.S. Markets opened yesterday we started with a small dip, but it just continued lower and lower as the morning went forward. My account actually opened green and quickly went red to quite red to suddenly very red, and that quickly makes you wonder if something bad is happening. The part that made that sell down seem a bit more drastic than other sell offs is that it was selling right across the board, all sectors seemed to be dropping. Usually you may own 2 stocks down 5% and 3 up 5% and a maybe few others slightly up or down, but yesterday each stock in every sector seemed to be down between 3 & 10%. That made the sell off seem like something might be wrong- why is Everything selling off?
.
So while I wanted to have a report just filled with stock picks on the last 2 trading days of the year, it may be best to do a complete market review and see what may be happening here. To the charts! …
.
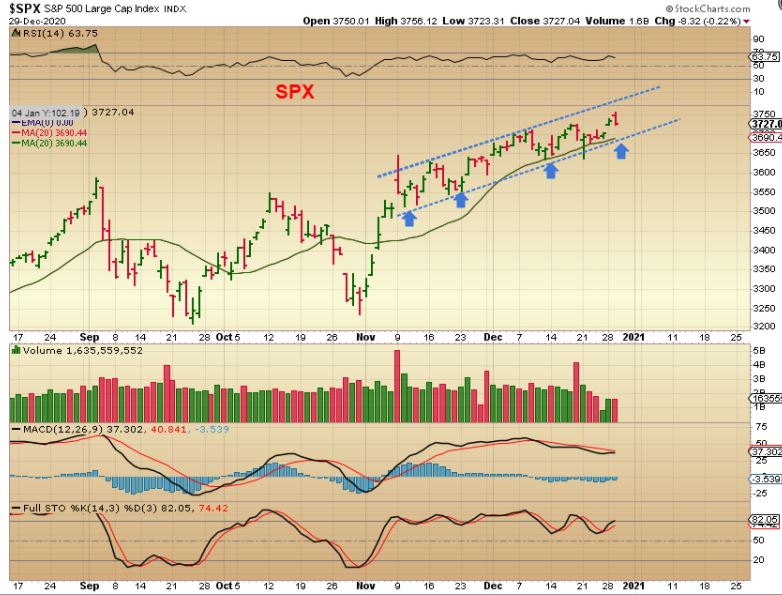
SPX – When we look at the SPX we see a normal down day and a choppy channel that is actually rising higher. It still looks overall bullish, right? You can see that the SPX does have an open gap and also more room to drop to the trendline, so we could see more downside this week. This is 1 reason that I wanted to review the markets, but then I saw something else …
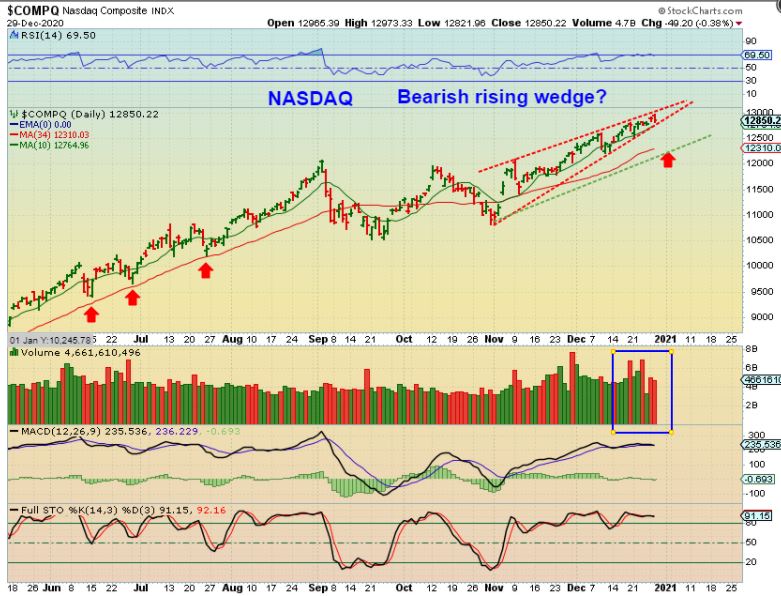
The NASDAQ looks a bit different to me when I compared it to the SPX. This looks a little more bearish short term.
.
1. This looks like a ‘bearish rising wedge‘ and a drop from a bearish rising wedge can bring price to the 34 sma (red line)
2. The SPX doesn’t have high volume selling, but the NASDAQ does, so I just want to keep that in mind too.
3. I don’t see anything that really resembles a dcl recently, so we could see even more selling until we reach the red line.
4. If yesterdays drop felt big, look how much deeper this could go on this chart. That is why I wanted to mention these things today.
5. In a parabolic move, This can break out upside and negate the wedge too.
.
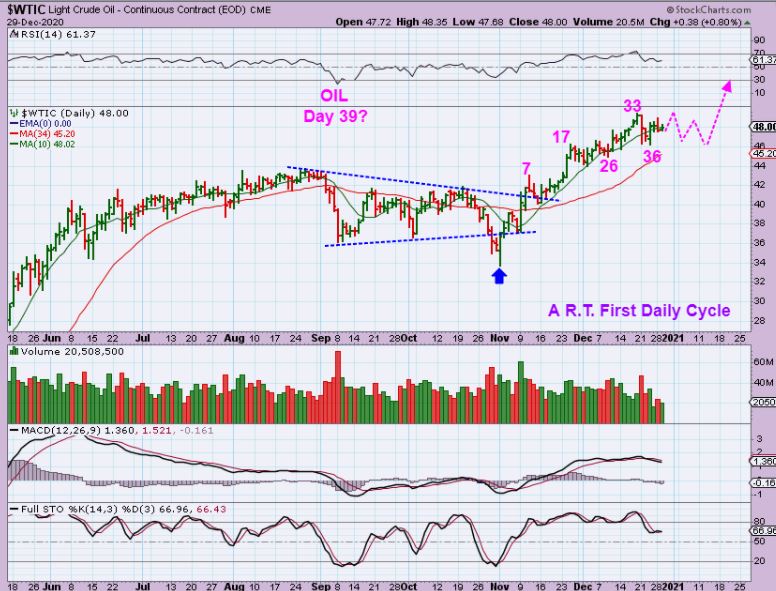
WTIC – Oils daily cycles can be 50+ days long, so was this a day 36 dcl? It is Possible, but I think that it needs to dip and close below the 10sma and then recover, so I am thinking that Oil is on day 39. Oil will probably remain choppy and give us a dcl in the future.
That said, this is a First Daily Cycle out of an ICL, and Oil remains right translated and bullish.
..
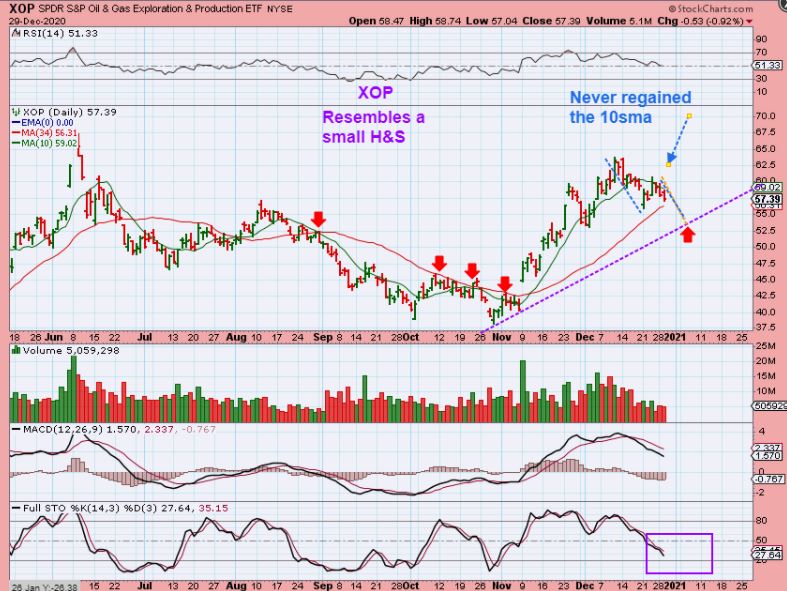
THE XOP can put in smaller daily cycles than oil ( Even 2 daily cycles within Oils first long daily cycles), so was THAT DIP a dcl? It is possible, but it is not confirmed if it was. We wait for a close above the 10sma and we do not have that yet, so this can go either way.
1. The 34 sma has controlled price at times, so if it breaks higher, we likely have a dcl.
2. If we break the 34 sma, it could drop to the purple trend line.
3. This is also a bullish move out of an ICL and notice how the selling volume is drying up.
.
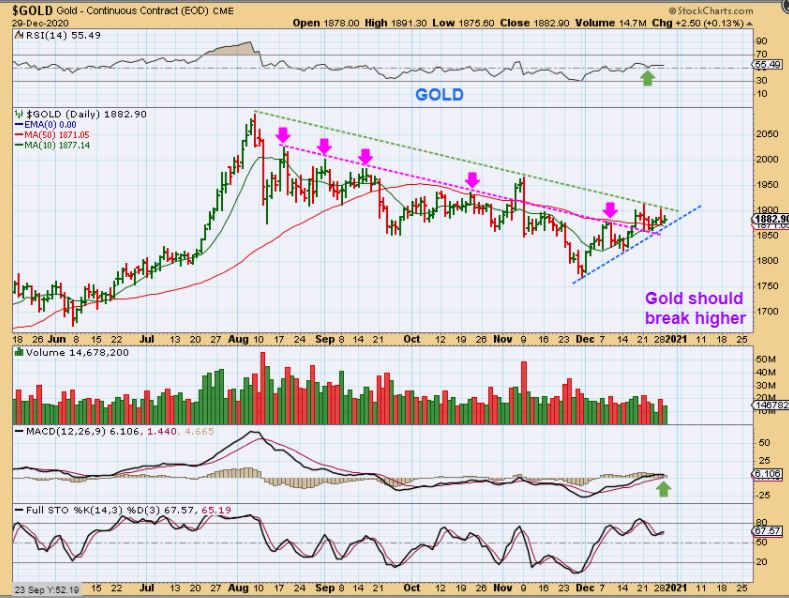
GOLD #1 – I’ve been using the Magenta Trendline, but I added a Green one too. Gold is really having a hard time finding follow through, but a break out here should eventually give us that bullish follow through.
.
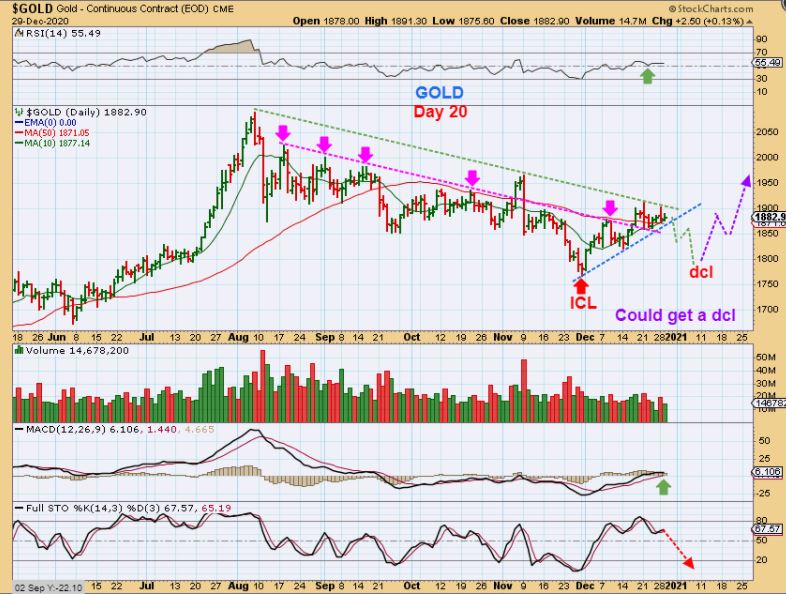
GOLD #2 – We are on day 20, so we could break out higher and dip as a back test to a dcl near day 33 – or – we can do as drawn here. A higher low as a dcl.
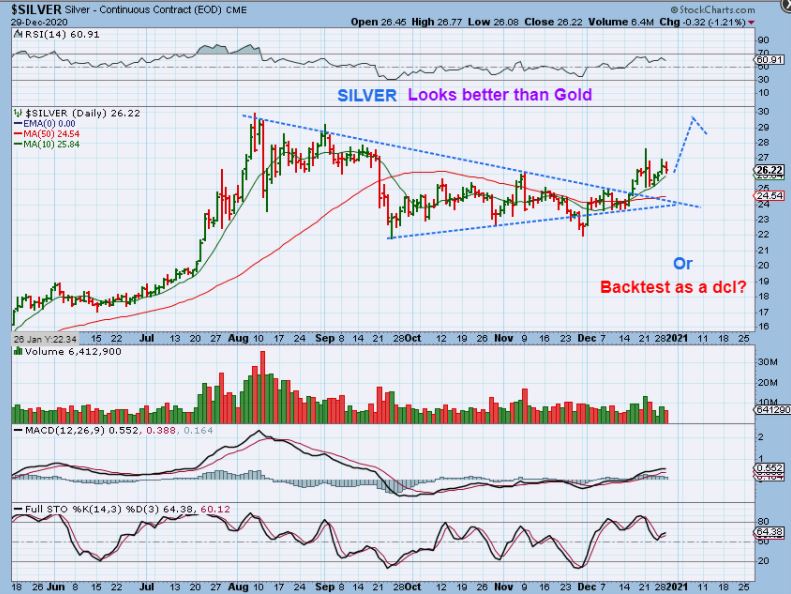
Since Silver looks better than Gold, hopefully that is telling us that Gold will break out and back test as a dcl.
.
You can instantly see why I said that Silver looks better than Gold. Silver can push higher and form a large bowl and put on a handle as a dcl – or – it could back test the upper trend line as a dcl. Either way, Silver remains bullish.
.
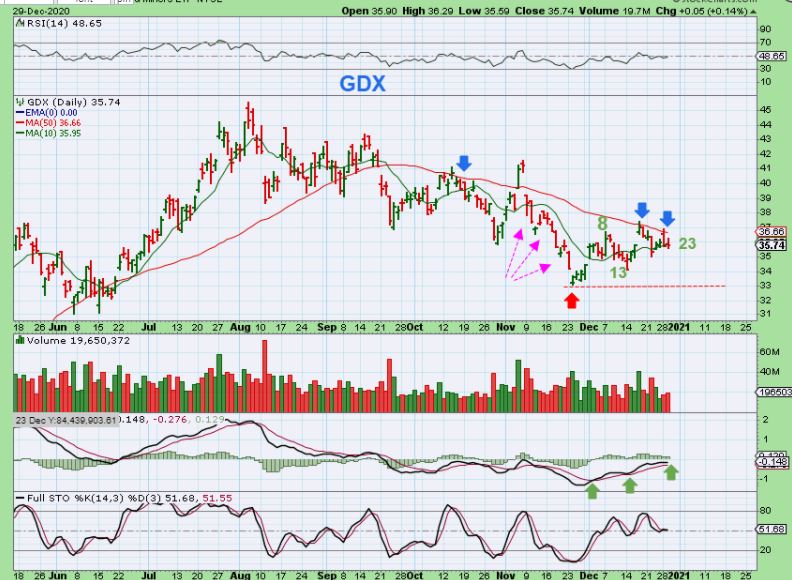
GDX has been lagging, so we are getting a choppy first daily cycle and this is actually causing people to doubt the Miners.
.
Think about this: As of last September everyone was super bullish for Miners after that March to August ramp up. All you would hear is people buying every single dip that came along, afraid that this sector would just take off without them. ICLs change sentiment and Sentiment needed to cool down. Here we are with choppy lower prices and sentiment has cooled off.
.
It is hard to say what the last 2 trading days of the year will bring with the current price action. I don’t see anything glaringly bad, but the choppiness at times continues to reemerge. At this point, I looked at the NASDAQ and saw a possible rising wedge. It may break upside and we continue a parabolic climb, but I didn’t see a clear dcl and we are getting later on in a daily cycle, so it seems like the General Markets want to pull back sooner or later. Yesterday may have been a warning rumble. If we were entering a true parabolic blow off phase, you can just have quick sharp dips and then keep running higher, so we’ll need time to show us how this develops. With the NASDAQ wedge I would say that at least some warning signs are there for me to keep an eye on. Oil is chopping late in the daily cycle and the Precious metals are struggling to break out too, but both do look to have an ICL in place. That means that these sectors should remain bullish and can break higher at any time. I didn’t sell any miners yesterday because even if the first daily cycle remains muted, I think that the second daily cycle will be strong.
.
Lets see what Wednesday brings our way and honor your stops if those price levels are hit. You can always get back in if it’s a shallow sell off in a parabolic move, but it’ll protect your gains if its a deeper sell off too. Enjoy your Wednesday trading!
.
~ALEX
.
Some Miners continue to outshine others. We see surprises to the upside in some, while others continue to chop inside of their consolidations.
.
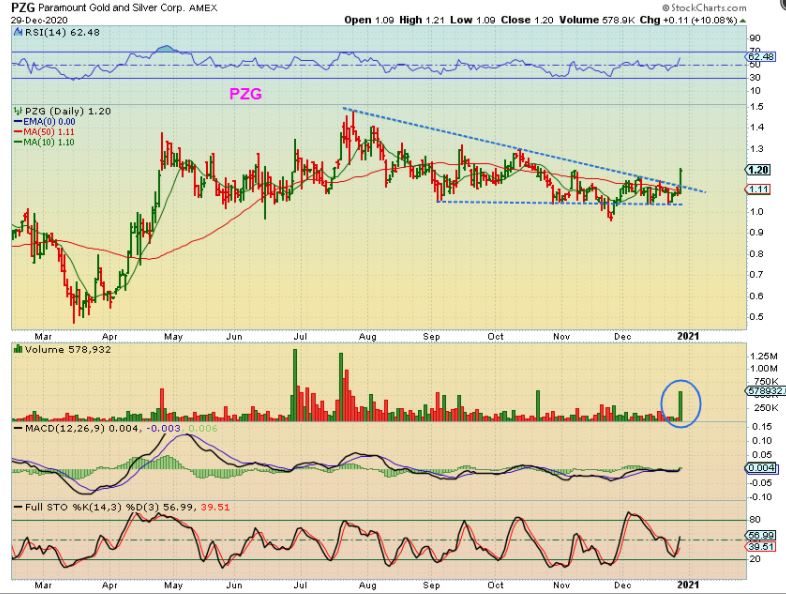
PZG popped yesterday, closing up 10% and breaking form a downtrend. Surprises come to the upside in bullish markets.
.
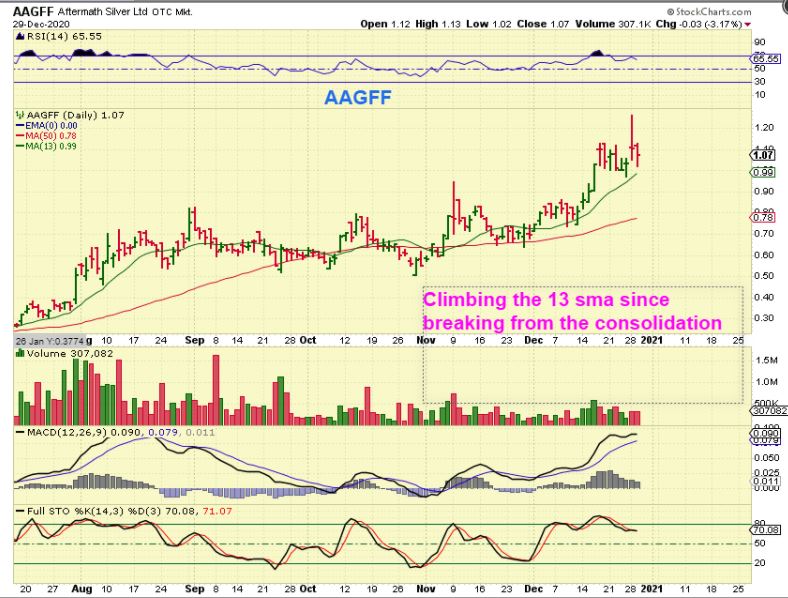
AAGFF now appears to be trending higher out of the consolidation and others like CDE and EXK are acting bullishly too. The sideways chop makes it appear ‘average’, right? Well AAGFF was 50 cents at the late October low, so this has moved up over 100% already (Stealth mode). AAGFF hit $1.26 on Mondays spike.
.
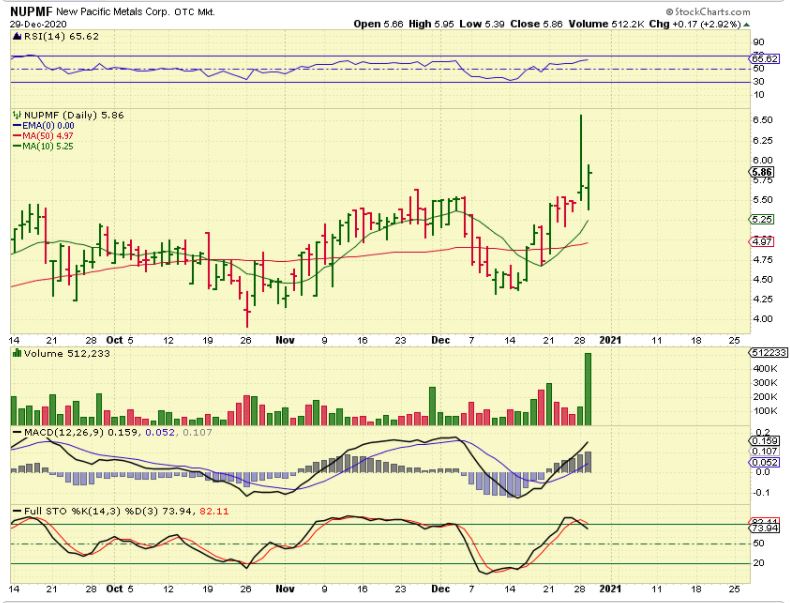
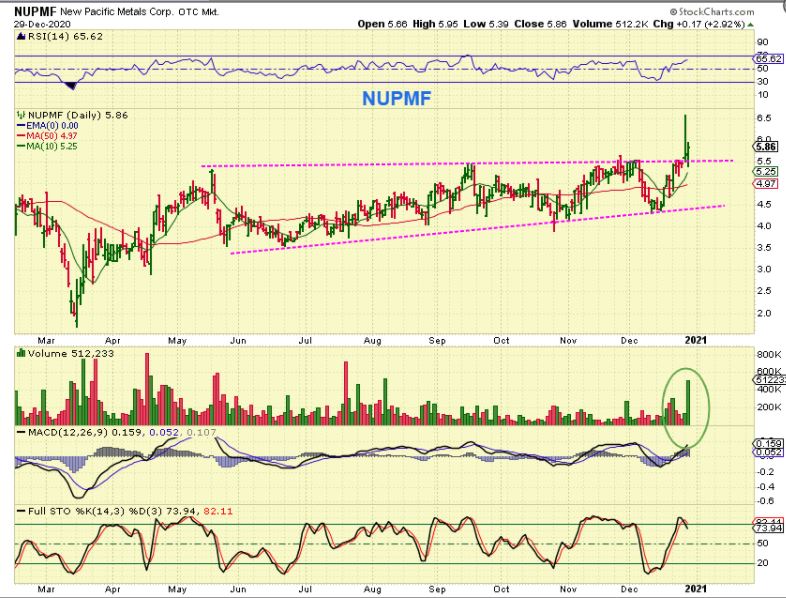
NUPMF spiked Monday and dropped, but it continued to find buyers Tuesday and volume was strong. This was only a 3% move yesterday and is near the 10sma so it could be bought in this area, and…
.
NUPMF is breaking from a LONG consolidation and these can start trending higher with good gains over time.
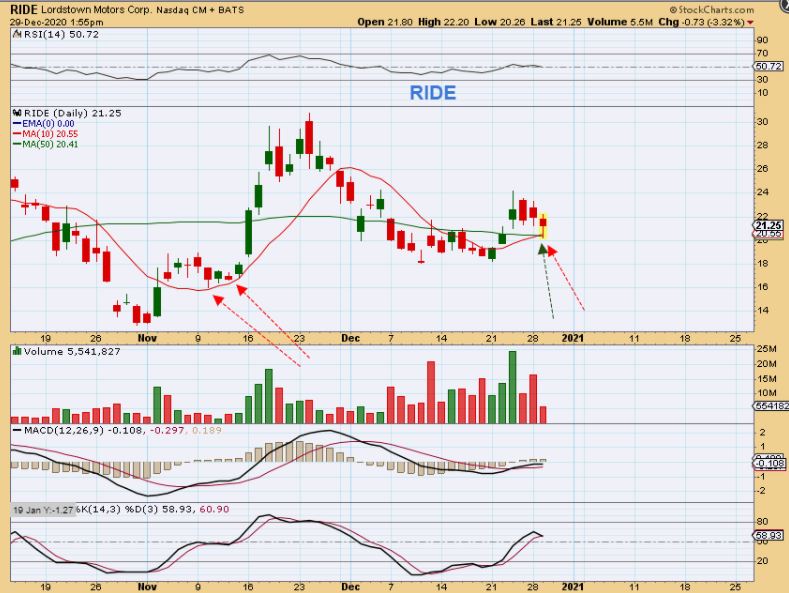
RIDE– This is just to show that some of the current trades found support and reversed higher. This is also a low risk buy area, since it found support. I did get stopped out of WWR at the $5 area, because I had to leave for a few hrs and placed a stop at the 50sma.
.
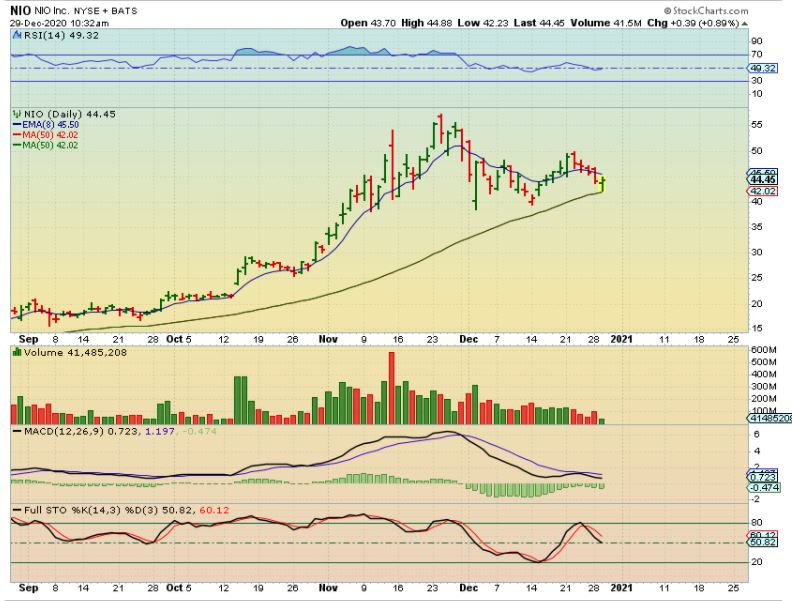
NIO– I posted this in the live area yesterday as a buy opportunity if you wanted NIO (Chinas Tesla)). After a strong run higher it did a normal consolidation and with the markets selling off and NIO rising up off of the 50sma, that may be telling us that the selling is done. You can place a reasonable stop under yesterdays lows.