Wednesday December 23rd – It’s Really Not That Bad
Note: Please excuse typos. This report has become much longer than I expected and I didn’t have time to proof read it. I will do that now, but I want to release this at 7:15 a.m. eastern time rather than wait.
.
Today is Wednesday and we have only one and one half day left of trading. Todays report is going to be long so that I can discuss several stock picks, but I also want to address the emails that I’ve received – Minor Complaints and concerns about the sell off on Gold, Silvers, and Miners. 🙂
.
I am going to address and hopefully alleviate those concerns. I have a lot to discuss in this report even though it is a shortened week of trading with only 1.5 days left, so I’m going to skip the General Markets review and get right to precious metals. Lets get to the most important thing—-The Charts!!
.
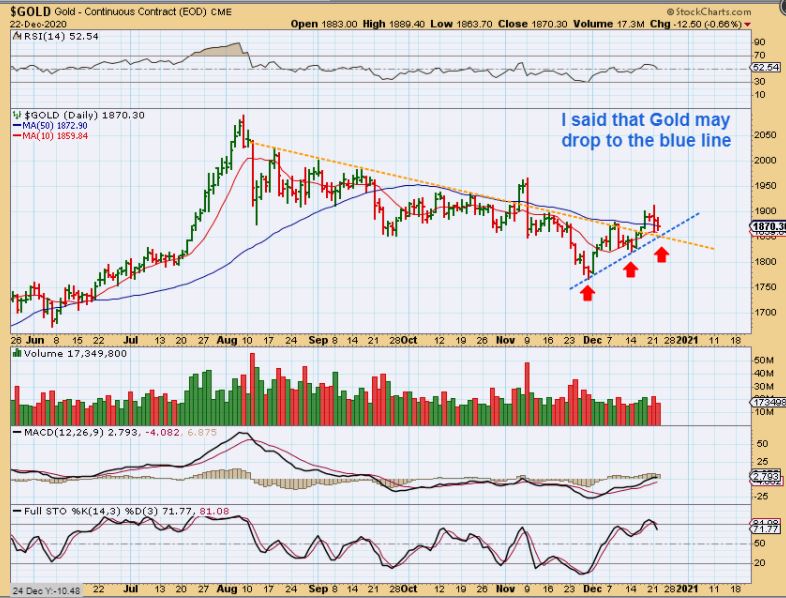
IN YESTERDAYS REPORT I SAID THIS: So far GOLD landed on the 34 sma and bounced on day 15. There is still plenty of time to move higher and that is what I expect going forward. I have drawn a drop to that Blue Trend Line as a possibility and that would still be normal price action.
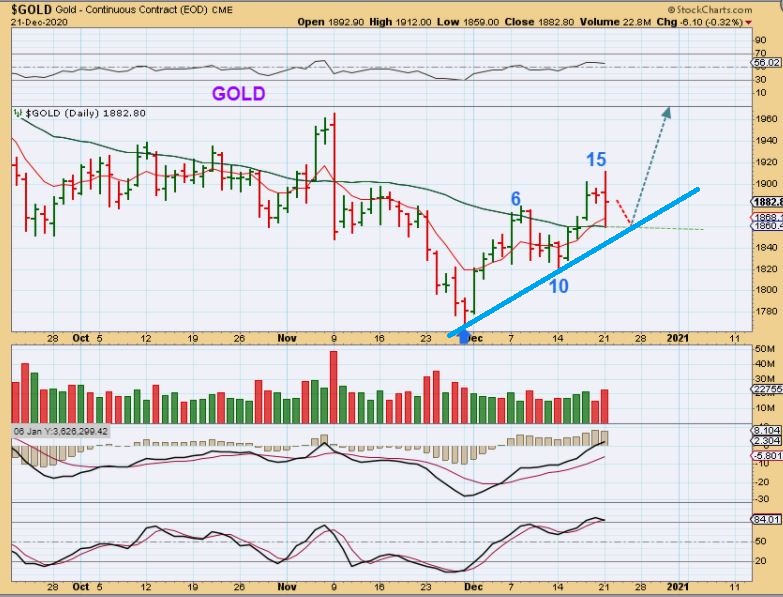
GOLD – We haven’t even hit that Blue Trend Line, so guess what? GOLD CAN STILL DROP LOWER AND STILL BE FINE.
.
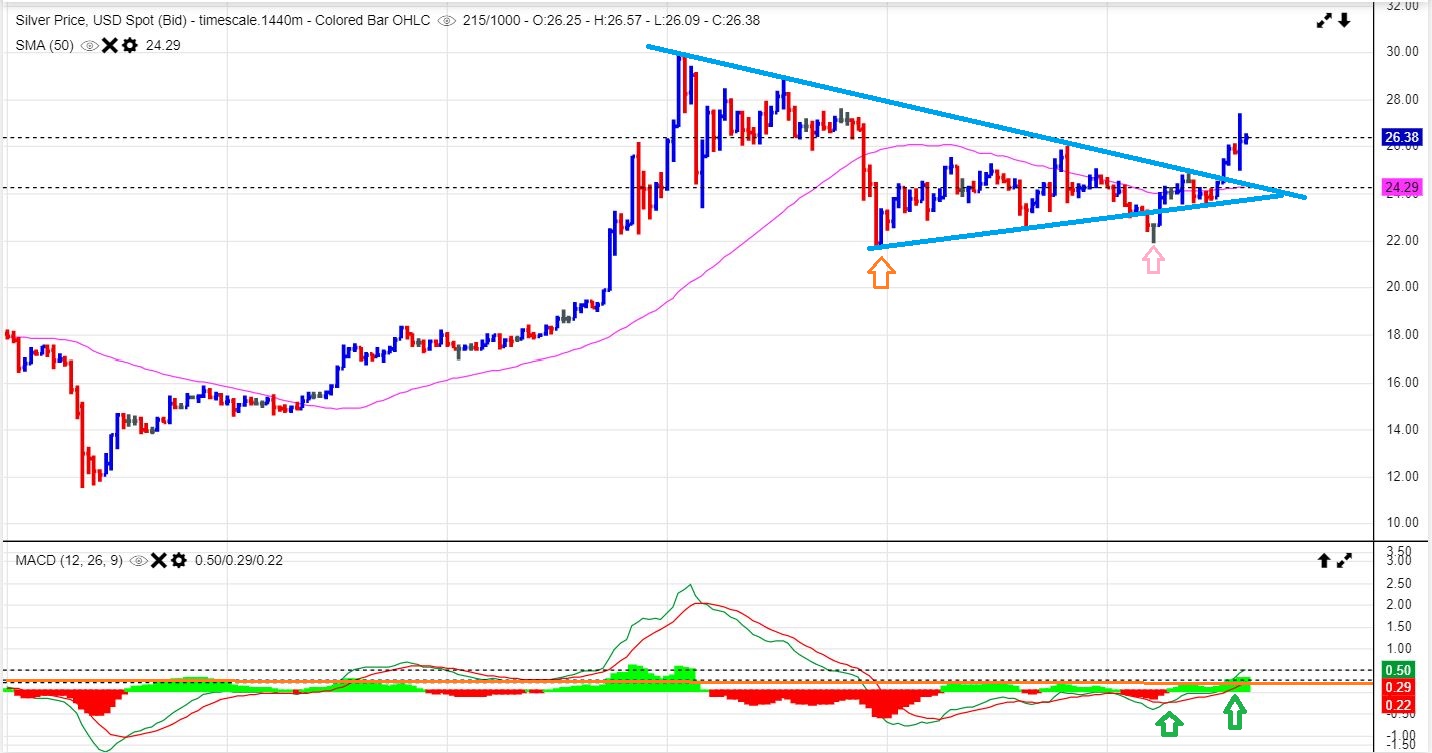
YESTERDAY FOR SILVER I WROTE : SILVER is a valid break out and Sundays price action at this point is just one of those anomalies that come about from time to time. Even a drop to back test the break out does not hurt the chart. That being said…
.
SILVER – I had said that more downside was possible and still fine, but when Silver dropped some were very concerned. This is a Bullish set up. Guess what? EVEN IF IT DROPS FURTHER, IT REMAINS BULLISH. The 50 sma is $24.39, so let me show you something…
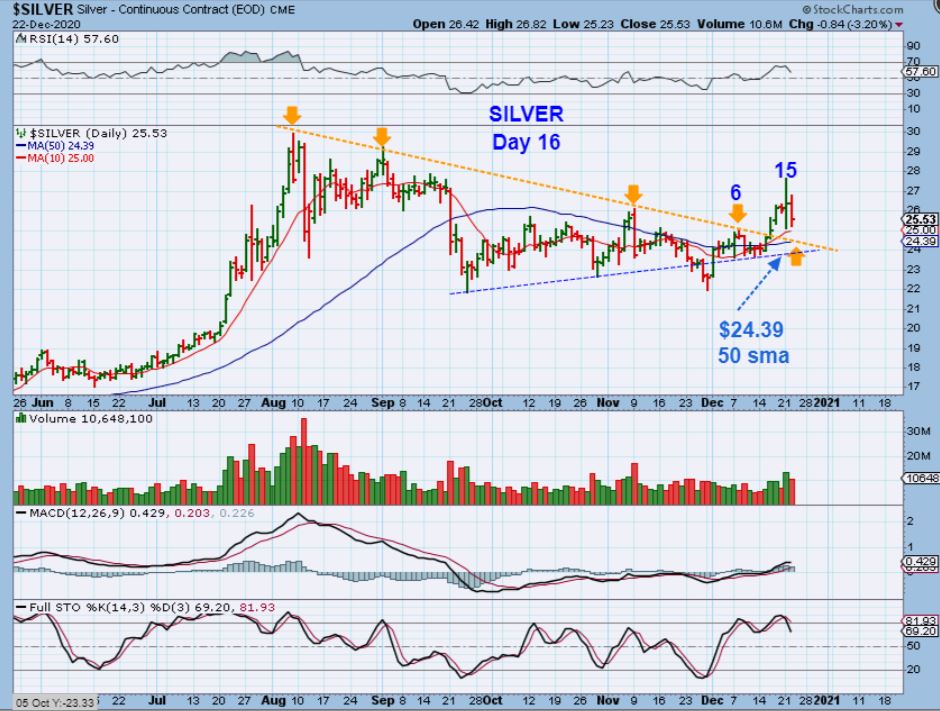
The 50 sma is $24.39, so let me show you something…
.
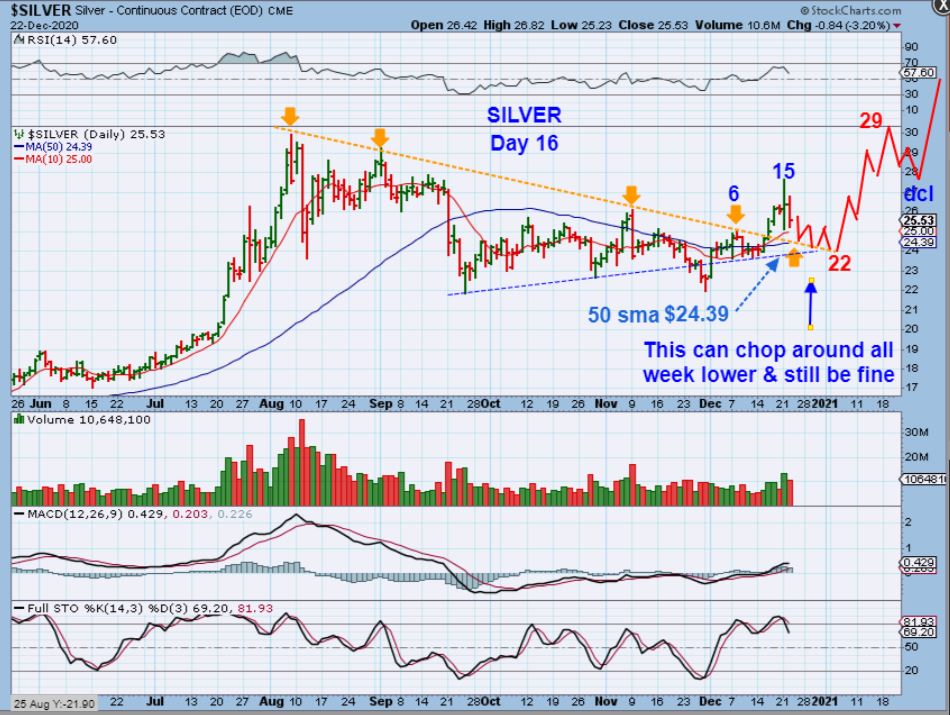
Using Cycle Timing, we are only on day 16 ( 1/2 way). That means that SILVER could actually drop for days and simply climb down this trend line, frustrating the Precious Metals investors and then take off higher after shaking off the Bulls. This is an example of a 33 day daily cycle that drops from here & then takes off. A large inverse H&S would form at the dcl.
.
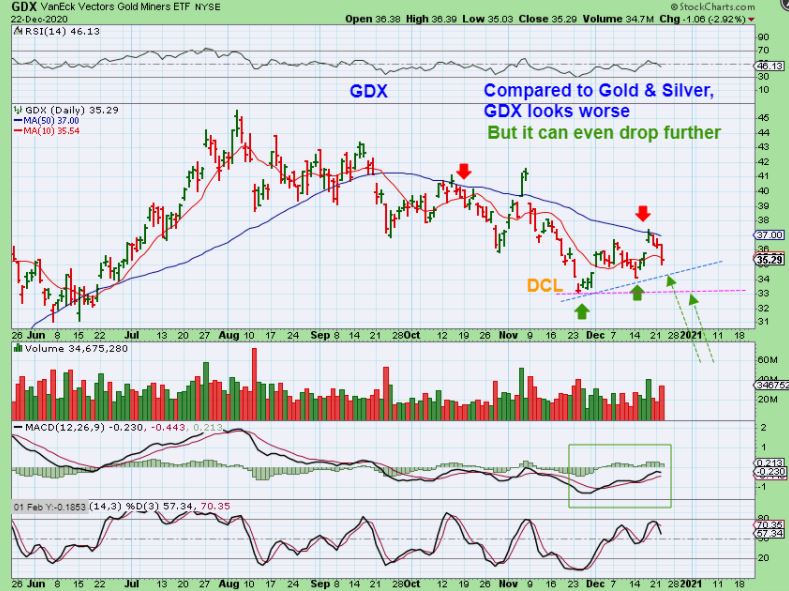
OK, now we’ll face reality a little bit. GOLD & SILVER are above the 50sma and their downtrend lines, GDX is not. That is unfortunate, but it is not all that bad. Why? I have pointed out in a few reports that some miners are at their 2020 highs, so we have a bit of a mixed situation.
.
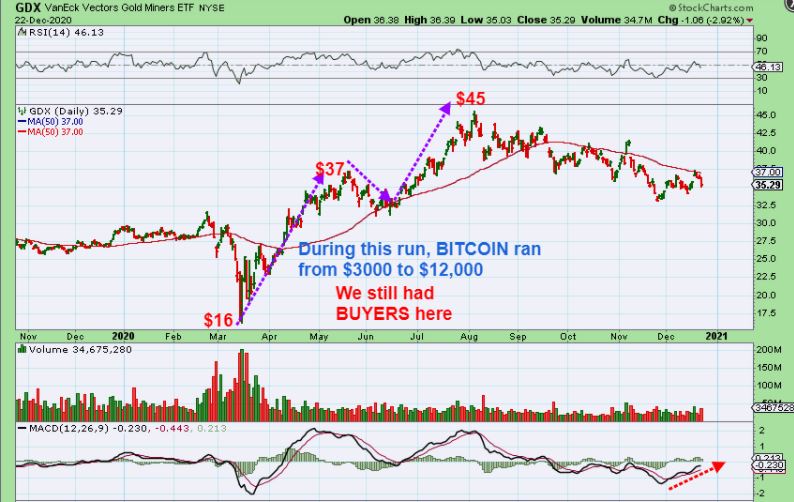
GDX dropped almost 3%, but that is normal price movement for this sector lately. Don’t worry about the 10sma, GDX can actually (and I have seen it) Drop all the way back to the last dcl ( ICL?) and still be fine. I don’t like the increased volume, but nothing here is ‘broken’ and the blue trend line has not even been tagged. Conclusion: This can drop even further and be ok.
.
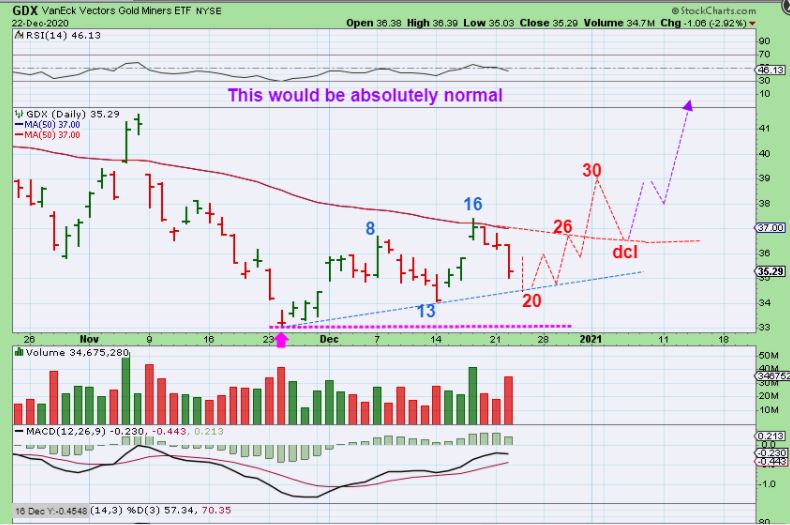
GDX – If I draw out a possible path using the current cycle count, I could draw this as dropping further Wednesday, yet you can see that it could still play out very bullishly. So I try to encourage my readers that when we drop, be sure to check your chart, not the amount of money that you are losing in your account. If the chart is broken, sure, bail out. If the chart is fine, then so far nothing is wrong. NOTE: The chart displays the facts, the account is linked to you emotionally.
Now I’m hearing talk that “Gold wont run with Bitcoin in a bullish run, because money will go to cryptocurrency.” I understand that kind of thinking, but I do not believe that to be true, so I’ll explain why. My first response is that when we get an ICL in a BULL MARKET, Price runs higher out of the lows, even if it starts out with a choppy first daily cycle. BY THE WAY, Gold & SILVER are above their 50sma and they have not been stagnant with Bitcoin running higher. Next let me point something out to my readers to try and help alleviate that concern…
.
GDX ran up 200% while Bitcoin ran from $3000 to $12000 in 2020. Read the chart.
GDXJ ran from $20 to $60 while Bitcoin ran from $3000 to $12,000 in 2020.
The charts show me that Miners are being purchased in a bull Run. We have now dipped down into an ICL, with the recent consolidation as expected. This is a normal consolidation. NOTE: GDX & GDXJ did NOT drop all the way back to the lows as though no one is interested in Miners because of cryptocurrency. Instead Miners only pulled back roughly 38% in a normal bullish consolidation and that shakes off nervous investors. If the Bull was dead, investors, Funds, etc would exit all miners and this would have dropped back to March lows. The stories after a sell off are always bearish and scary near the lows, and then the rally unfolds.
.
I will continue my discussion with Miners below and also include just a couple of trades, since we have had many in past reports. Many trades are playing out well. Enjoy your Wednesday trading!
.
~ALEX
.
LETS START WITH A DISCUSSION ABOUT THE MINERS:
.
CDE 11 am Tuesday -I grabbed this chart just to show that we have dropped this week, but the trend line is not broken. Let’s discuss a stock like CDE in detail…
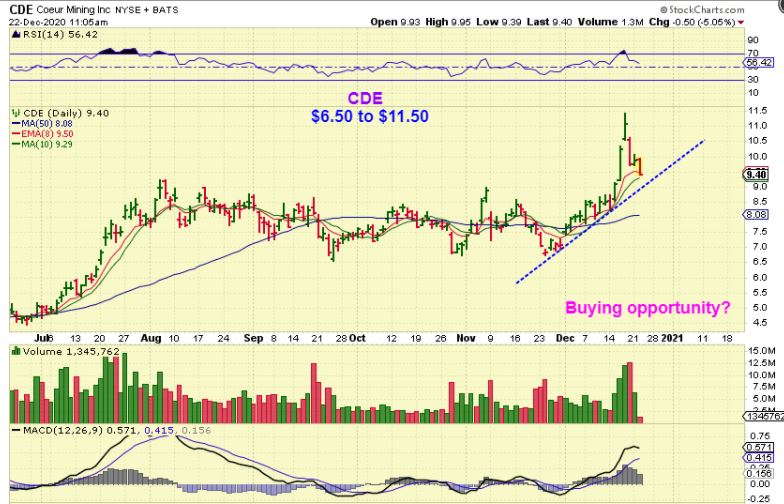
NOTE: When I said in the GDX section: “The chart displays the facts, the account is linked to you emotionally.” I say this because in all honesty I have received so many emails ( over the years, not this week) when we drop 2 or 3 down days, and the email always starts off with something like this: ” Do you know how much money I’ve given back in the past 2 days? What is wrong with the Miners?” That tells me that some people link their account balance to the health of the markets, but that can be emotionally misleading. And then I look at a few charts and their miners and there is nothing wrong with miners. They may still be above the 50sma, above a trend line, and looks like a chart that I would be recommending to Buy 🙂 CDE is an example of that now, so lets take a look…
.
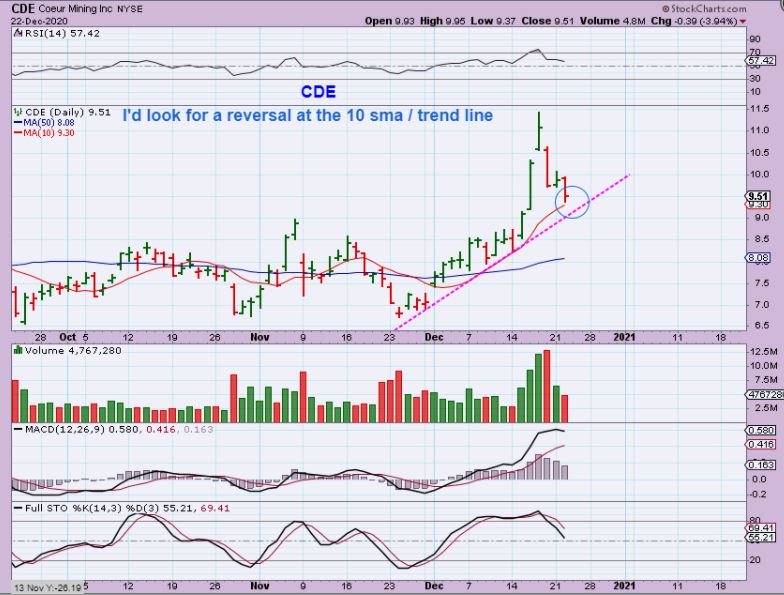
CDE CLOSE – I know its tough to give back some gains, but
1. I bought this under the 50sma ( $lets say avg. cost of $7.50) and it ran to $11.50. I made $4/share! Yay!
2. Now it dropped to $9.50. So I’m up $2/share, but in my head I was up $4/share. There is nothing ‘wrong’ with CDE and yes, it can double from here, but the ride to the top is never straight up.
3. In your account you would lose $2/share in 3 days, so if you have 2000 shares, you gave back $4000 this week. If you had 5000 shares? You lost $10,000. And if you owned 8 different miners doing this? OUCH, your account feels like it is bleeding. Painful yes, but check the charts and it is ok.
.
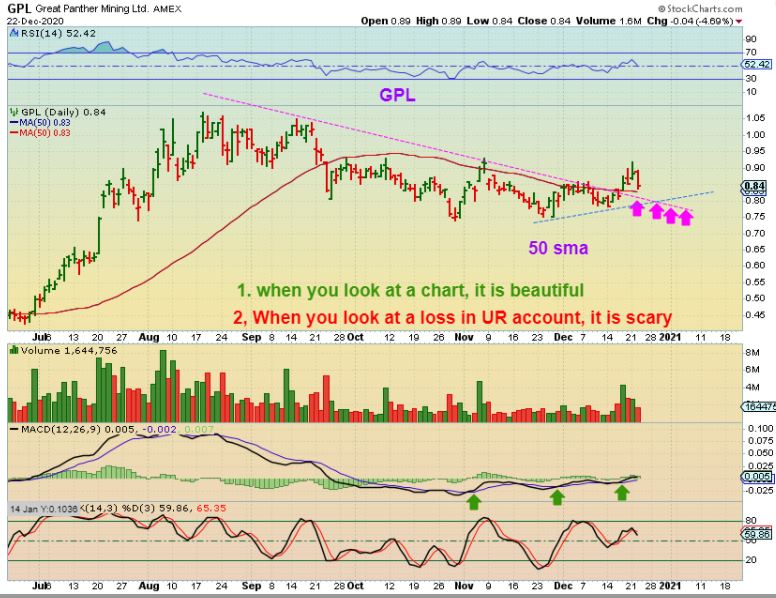
GPL dropped 4% but the chart is still Bullish too. It can also drop further and be fine. I own it and I hate that it can drop further, but this is still a bullish chart above the trend line & 50sma. Read the chart.
.
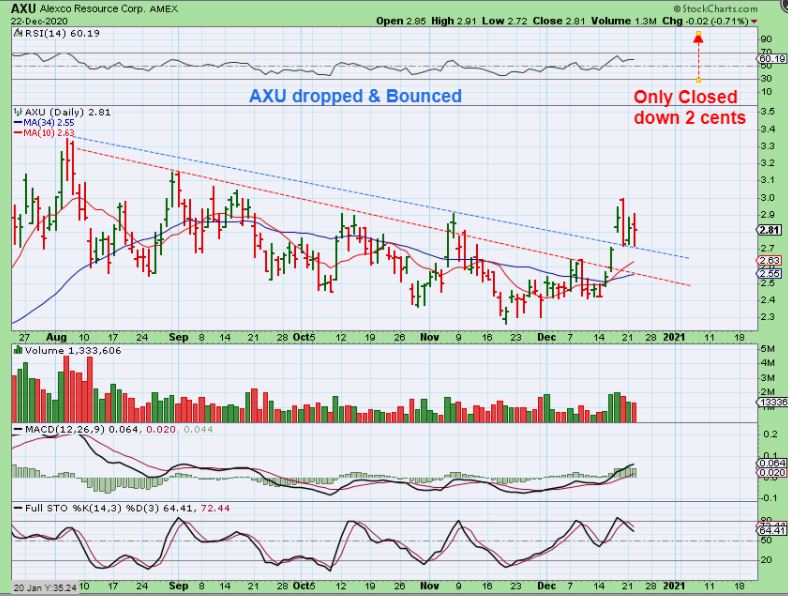
AXU dropped too, but it bounced back into the close, so that is encouraging.
,
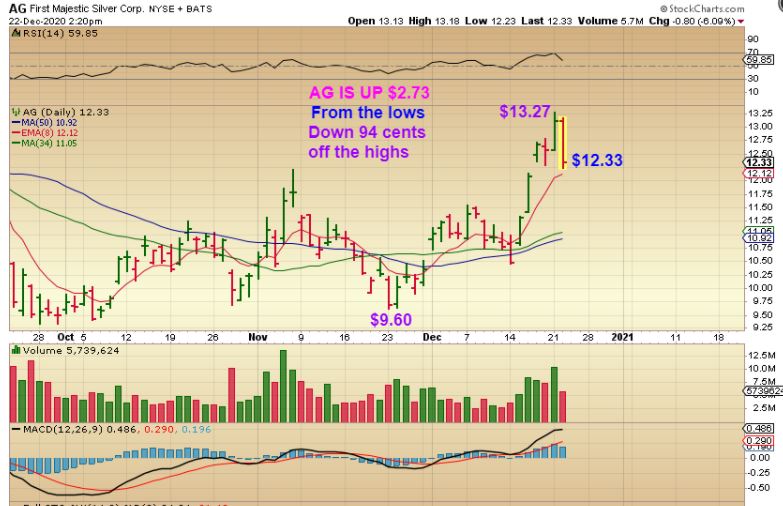
I grabbed this AG chart for the live area Tuesday, to explain the current drop.
.
AG dropped and it does look bad, but this was a 6% drop, and Miners often drop 7-10% on a bad day. Is this horrible and is this a broken chart? It is not and sadly it also can drop further. Let me show you what I see if I own this Miner.
1. I look at my account and see it down 90 cents. I own 3000 shares, so I’m down $3000 in one day, and that makes this look horrible. I do understand that. But next…
2. I look at a chart. AG ran from $9.60 to $13.27 and that is a $2.73 run. Now it is down 90 cents.
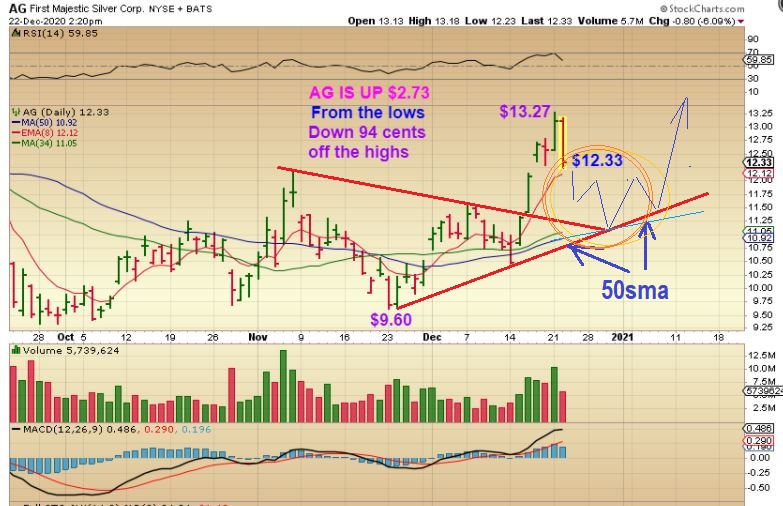
3. The chart is ok, but take a look at this chart. Can you tell me where it could drop to and still be ok?
4. Look at this chart. Where can it drop to?
.
Yes, AG could drop to the 50sma and tag a trend line & still be fine. AG is at $12.33, the 50sma is near $11.00 & rising.
.
So I hate to be the bearer of bad news, but these Miners still have room to drop further. The good news is that the entire set up is not bearish, it remains bullish.
..
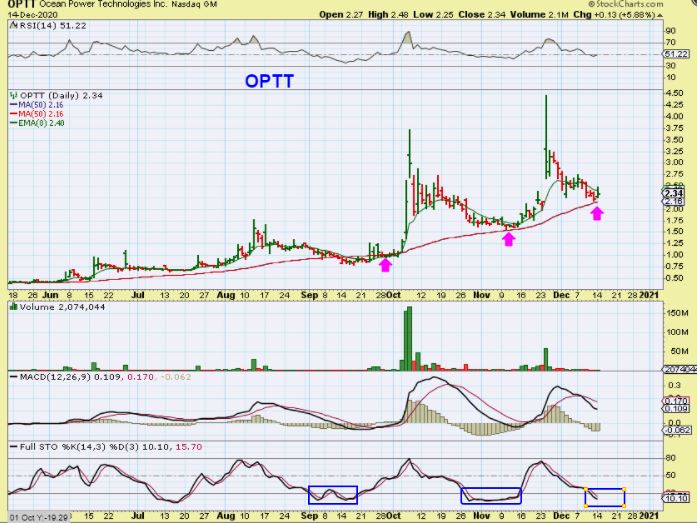
OPTT DEC 14 – We traded this in the past and sold the big pops. Then I put it back in the report as it dipped and reversed at the 50sma again. It is clean power and that sector has done well.
.
OPTT – Well, it was off to a slow choppy start, but yesterday it really started to push higher. I mentioned it several times as a good place to add and it closed the day up 20%. I am not selling, since this should run to the prior highs again. If it dips or bull flags it will offer another place to add. 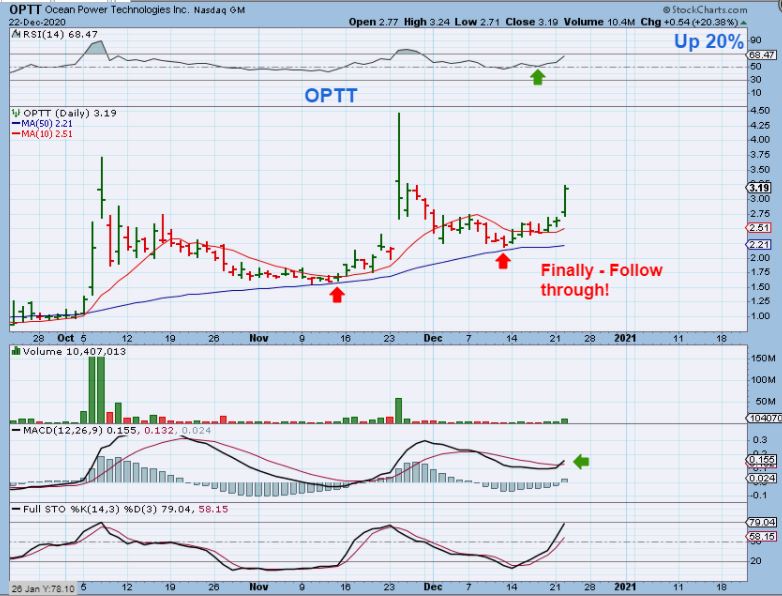
.
I also saw our other clean power trade set ups starting to perk up , so keep an eye on those ( PPSI, SOLO, POLA, LAC, OEG, etc) and I will discuss WWR , CBAT, & 2 Solar stocks below.
.
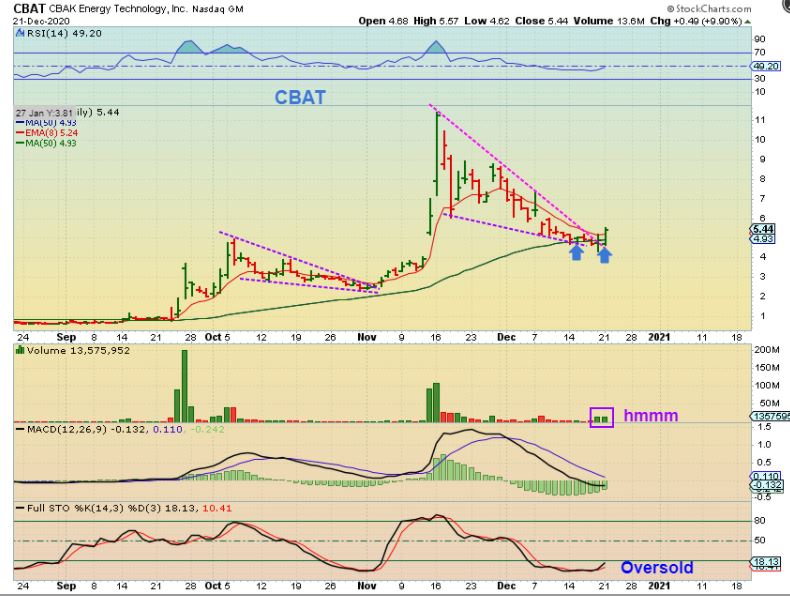
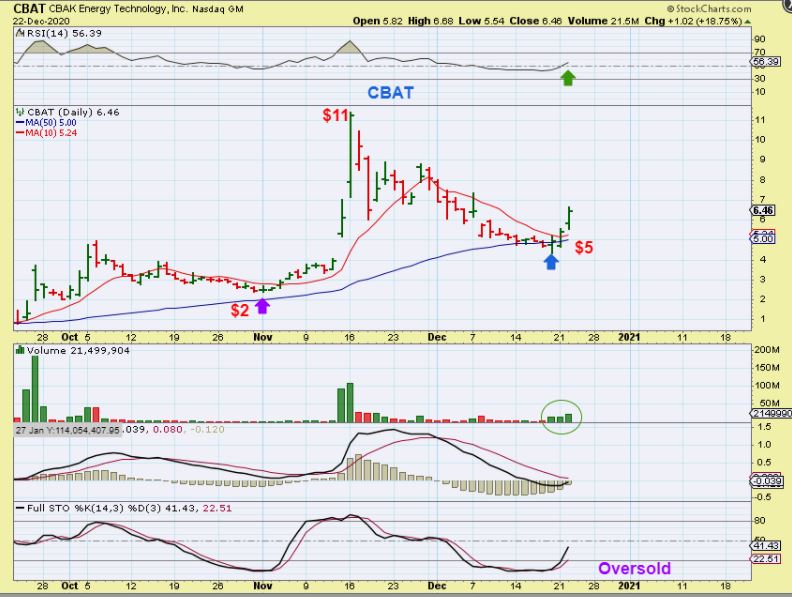
CBAT is a buy as it regained the 50sma and this has very good potential. This has been a STRONG RUNNER as you can see, so I grabbed this chart for the live area below the reports.
.
CBAT closed up 18% so now it is harder to enter as a low risk stock entry, since it can pull back too. It is above the 50sma, and you can take a small position and add on dips or wait and see if it bull flags or offers a lower entry ( watch list).
.
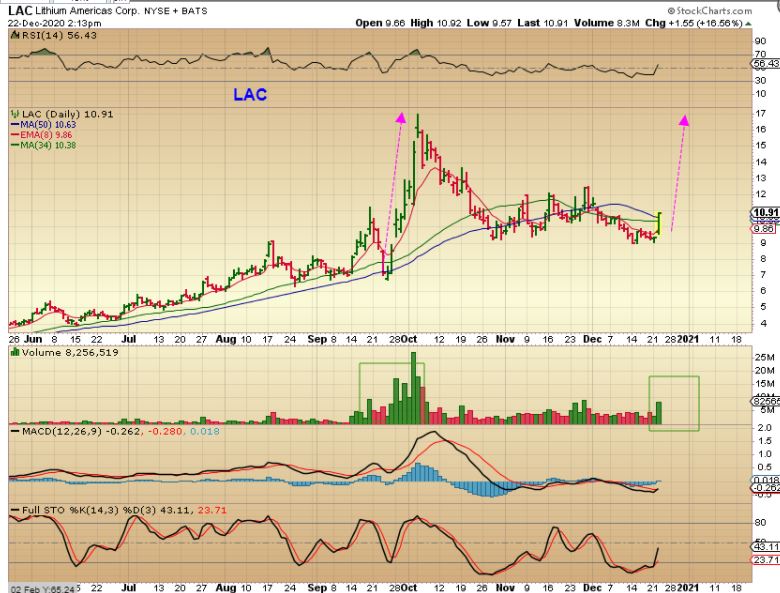
LAC – Very similar to CBAT, LAC was breaking through and regaining the 50sma. The sector is hot so this is also a buy.
,
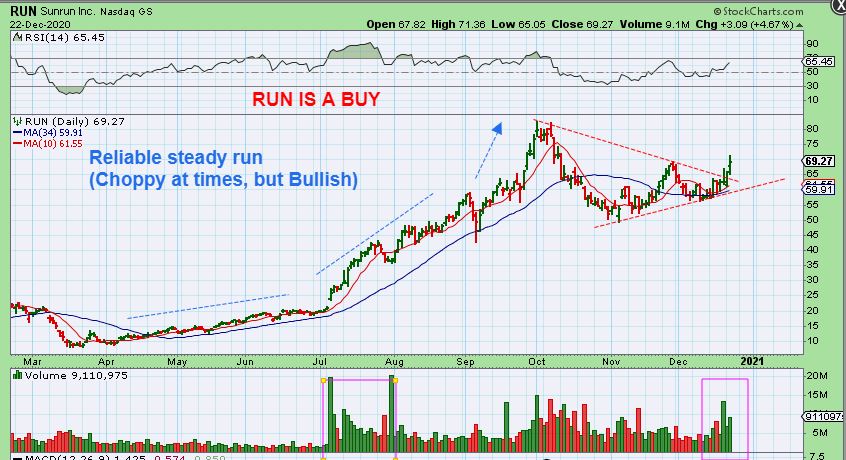
RUN & JKS ARE A BUY. I bought RUN yesterday after I noticed that it was breaking from a triangle. These have performed VERY WELL, so this can be a buy & Hold swing trade as it runs to the highs and probably keeps going.
.
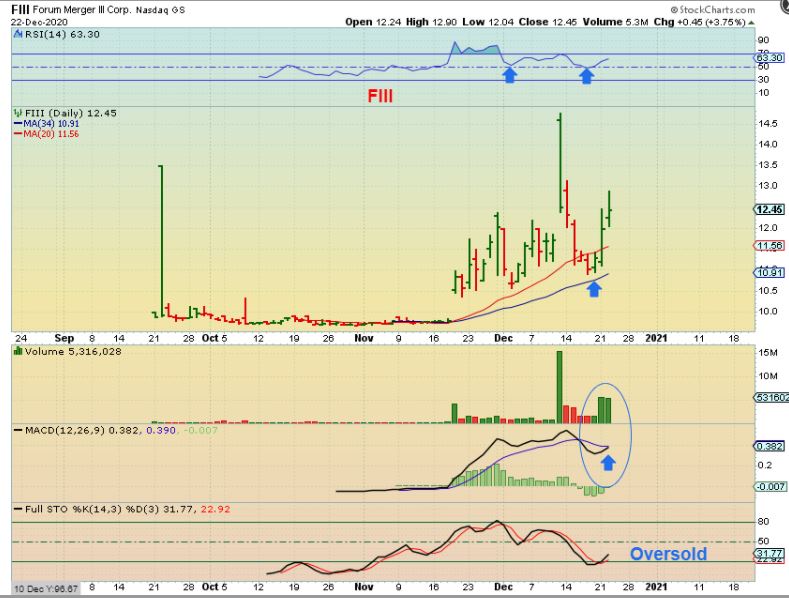
FIII ( That is F i i i ) – This is one of those stocks that can move in a BIG way up or down, so it is not for the inexperienced. I think that it has a good amount of upside with this reversal and an oversold stochastics, so I took a position.
.
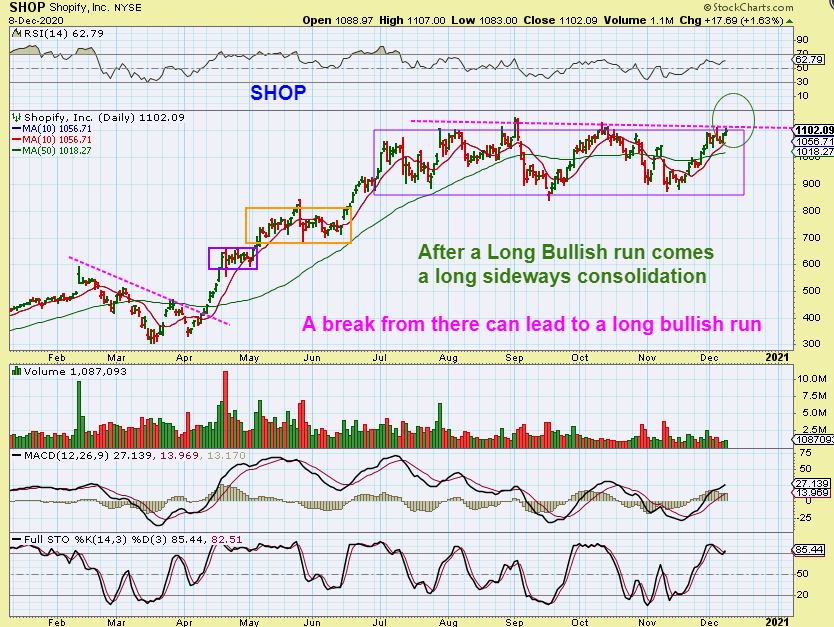
SHOP offered several Buy Opportunities as it formed a Box Consolidation. I posted this chart as a buy or a place to add if it breaks out.
.
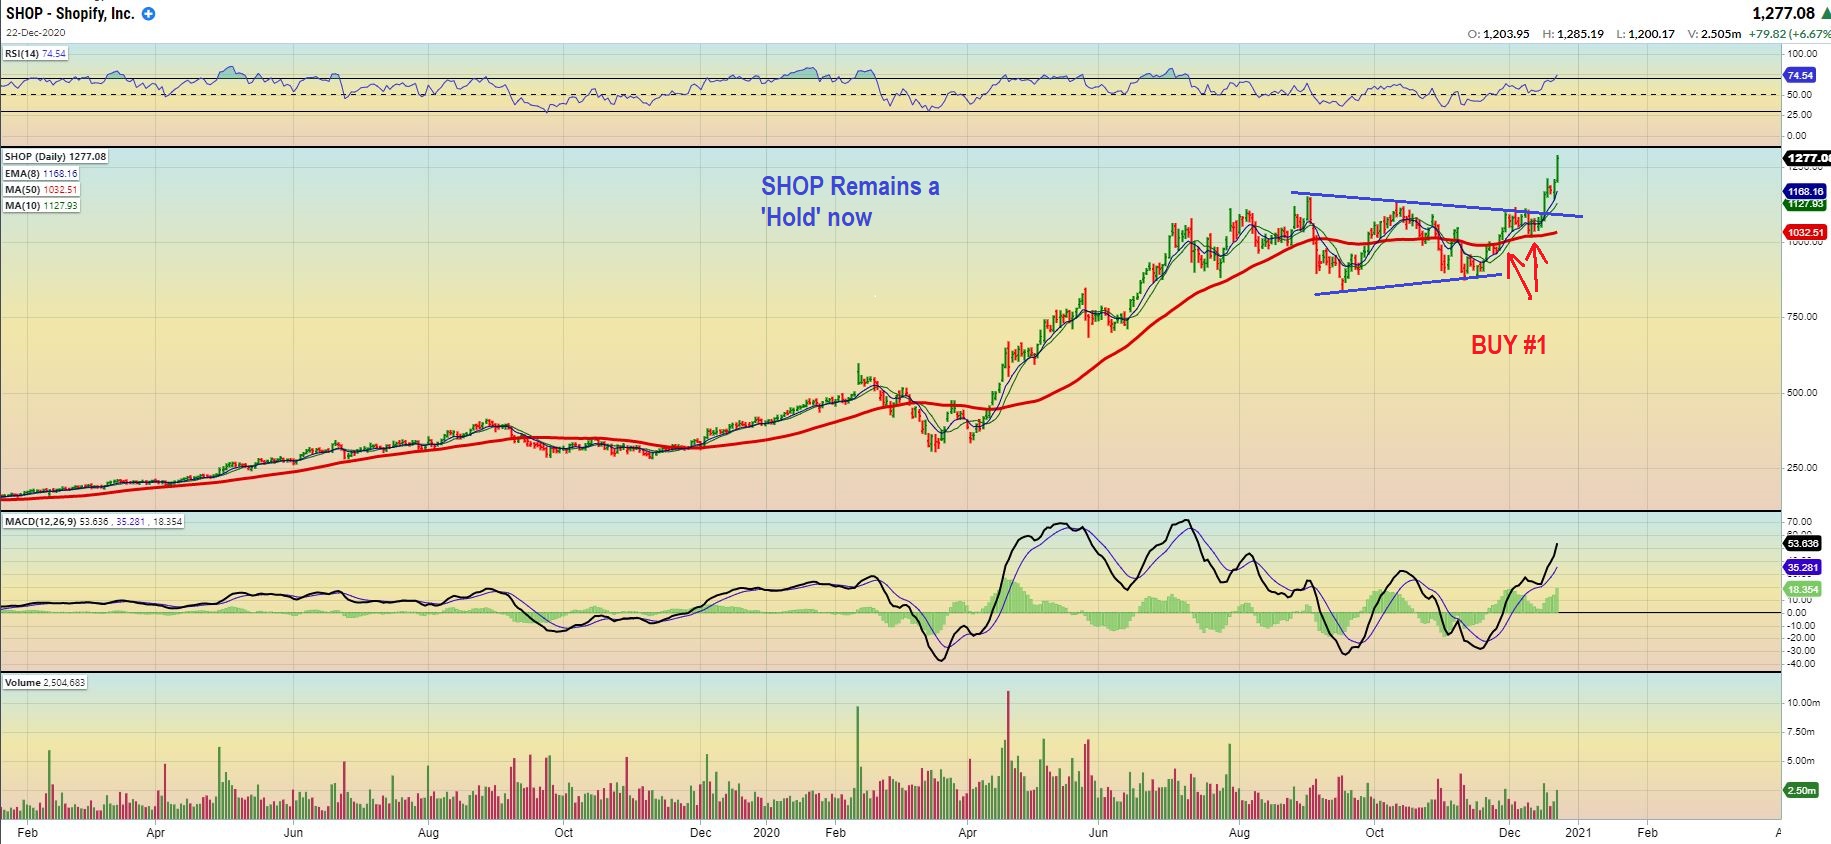
SHOP is running strong and though it may soon complete a measured move target, I would ‘hold’ it as a swing trade since the long consolidation can offer a good amount of upside follow through over time. You also can use a trailing stop (loose, under the 13 sma).
.
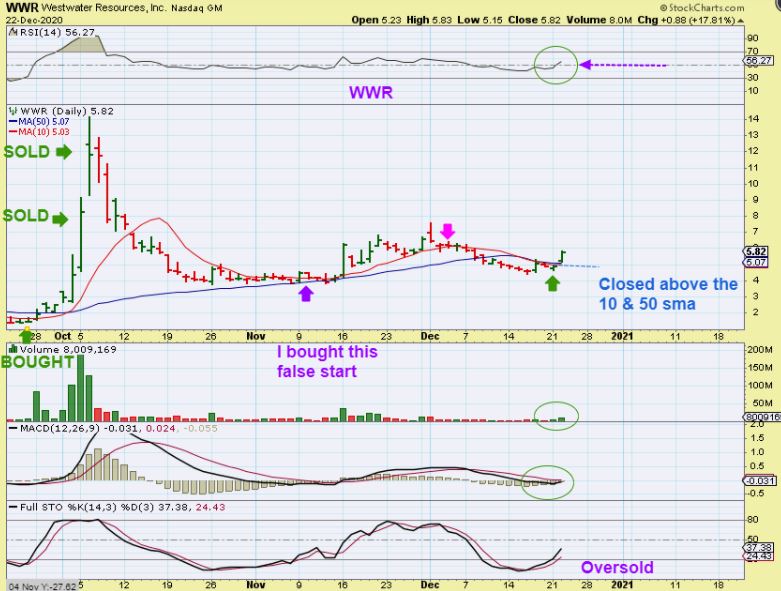
WWR at 9:50am. I saw WWR regaining support, so this may be a shake out. I called it out as a buy again here near $5.
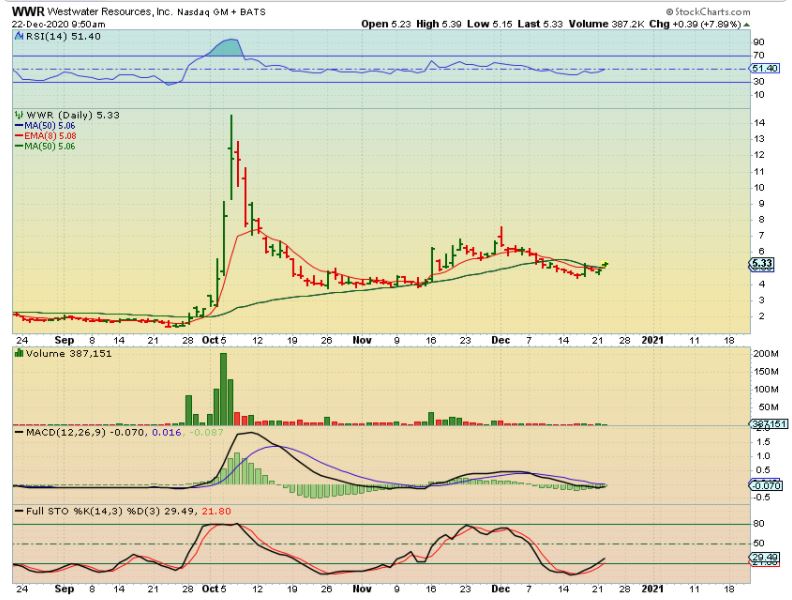
.
WWR ran up 17% by the close, but I still think that it can be a buy. In September many of us bought WWR and made Huge gains as it ran from under $2 to $14! I rebought it in November, but it just remained choppy. With this sector now heating up again, WWR may now be ready to run again after forming a long base or consolidation. A run from $5 to $14 wouldn’t be too bad 🙂
.
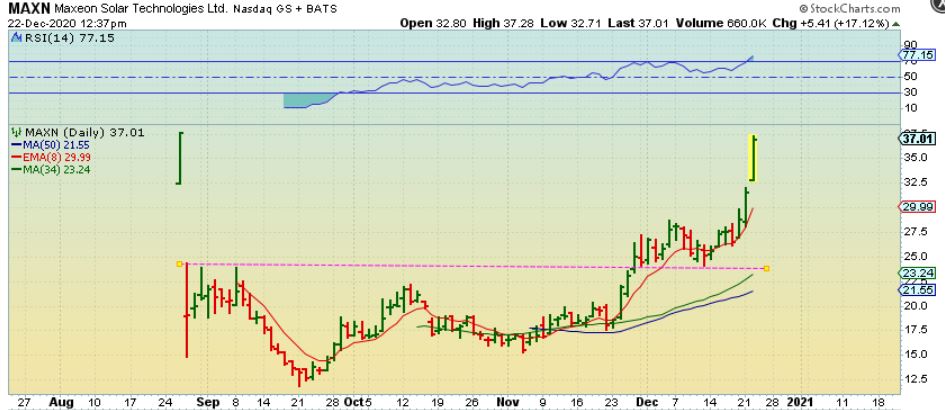
THE BUY FOR MAXN was at $17 inside of the APEX, and $20 as it broke out. I mentioned that I bough this solar stock with the Solar Sector on fire.
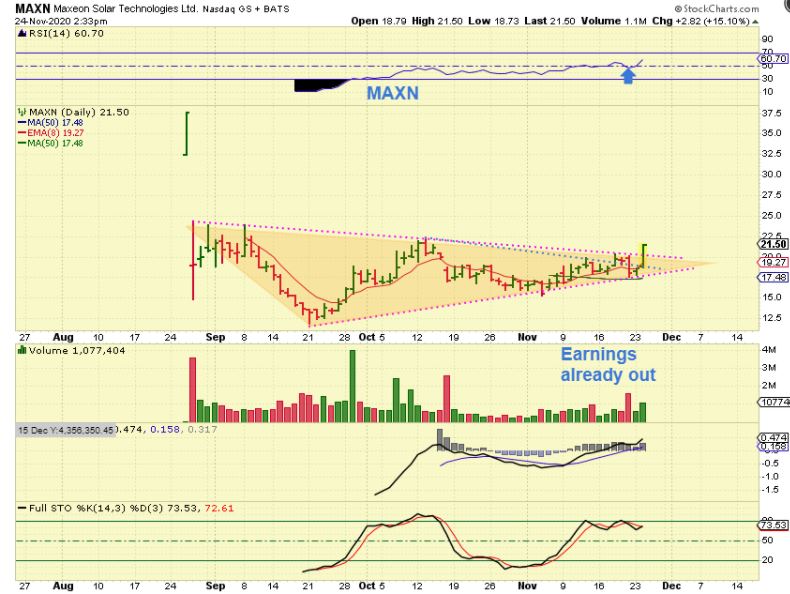
.
THE NEXT BUY OR ‘ADD’ FOR MAXN at $25 , the back test of the break out. I posted a few of these charts.
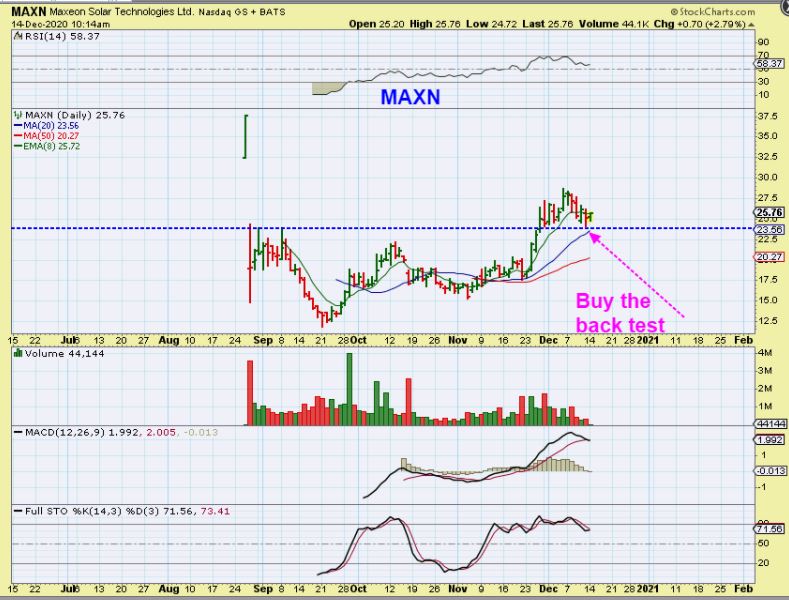
.
MAXN up almost 20%, now $37! Congrats if you are still in it. It is entering uncharted territory.