Thursday 12-17-2020
Yesterday I discussed several improvements in Precious metals sector that made the Miners look like they were ready to join the party. Today I want to focus on this sector.
.
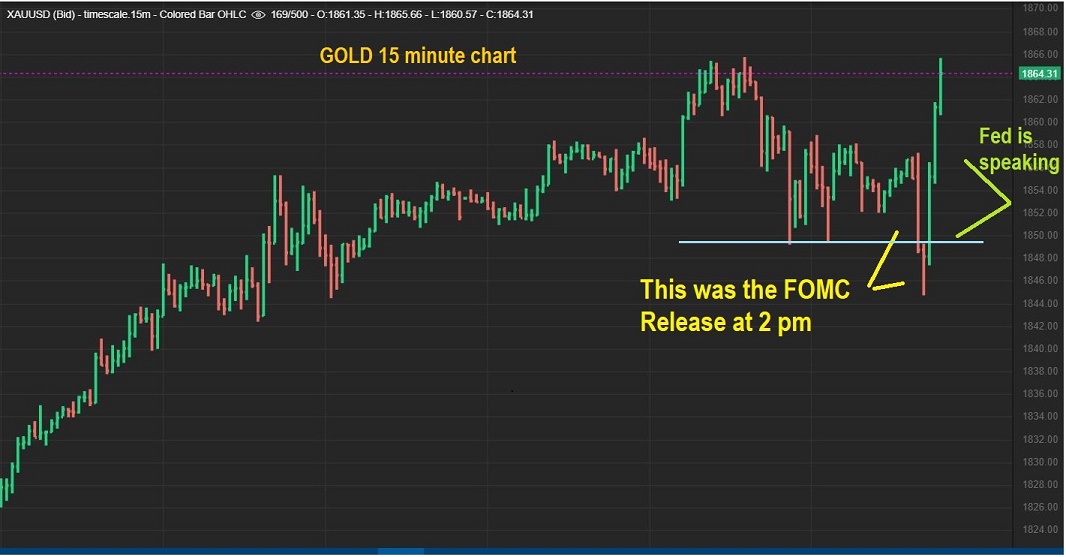
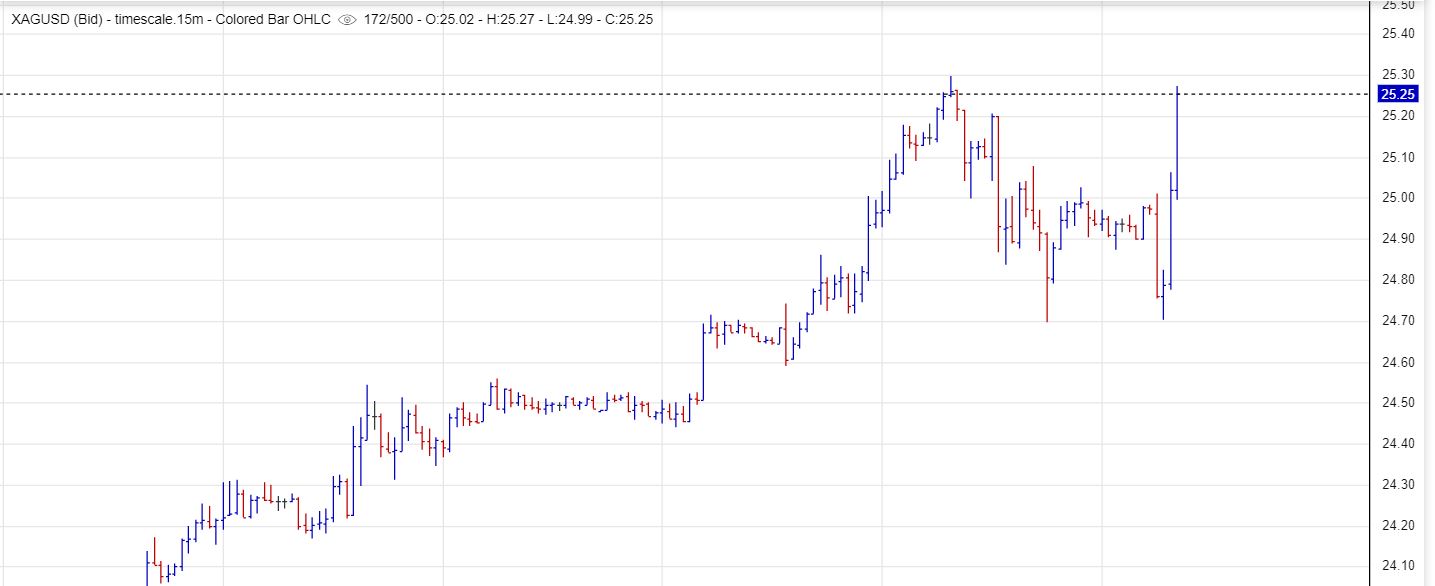
Wednesday was the FOMC MTG and this was GOLD ( 15 minute chart).
1. As the news was released Gold crashed down in what looks like a stop run sell off.
2. When the Fed Chairman was speaking, the precious metals shot straight up as seen here.
.
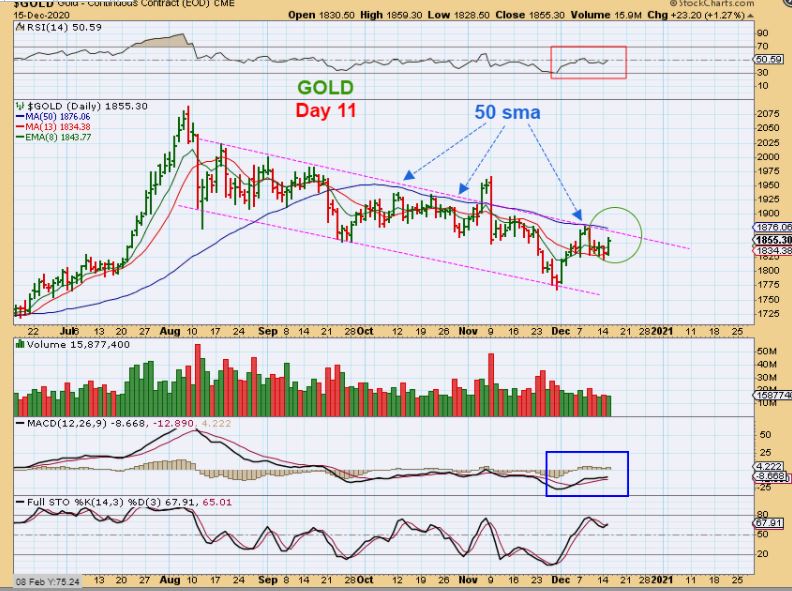
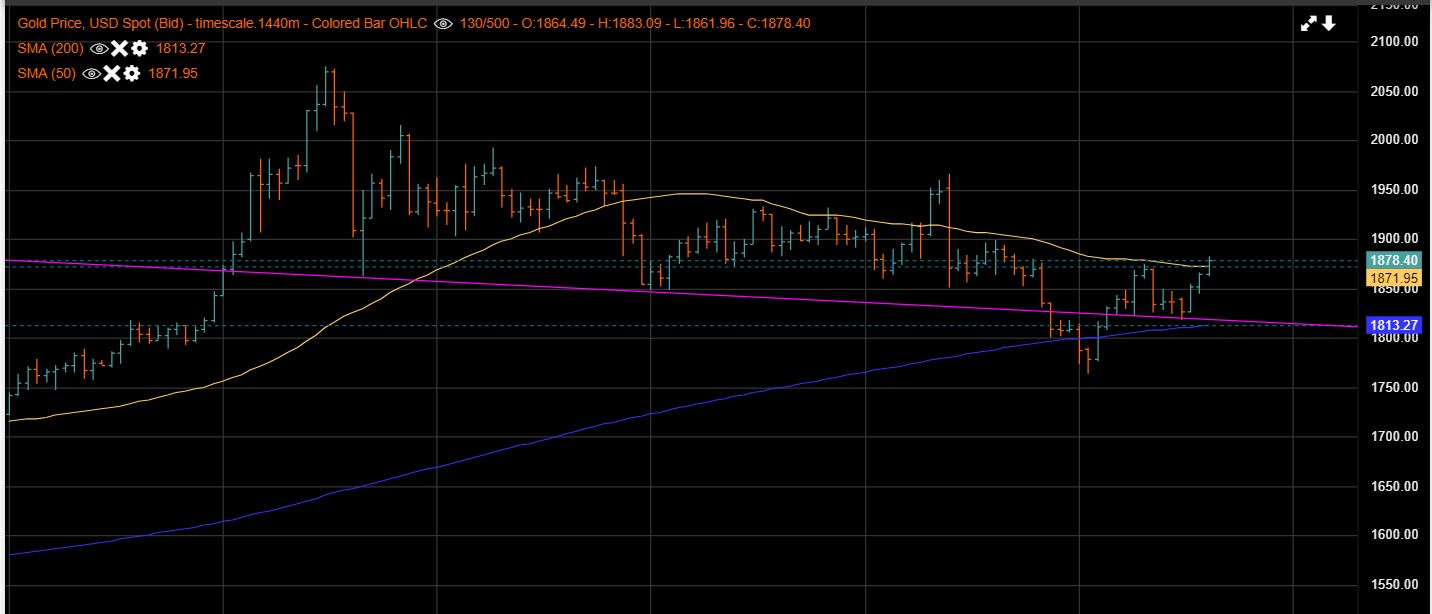
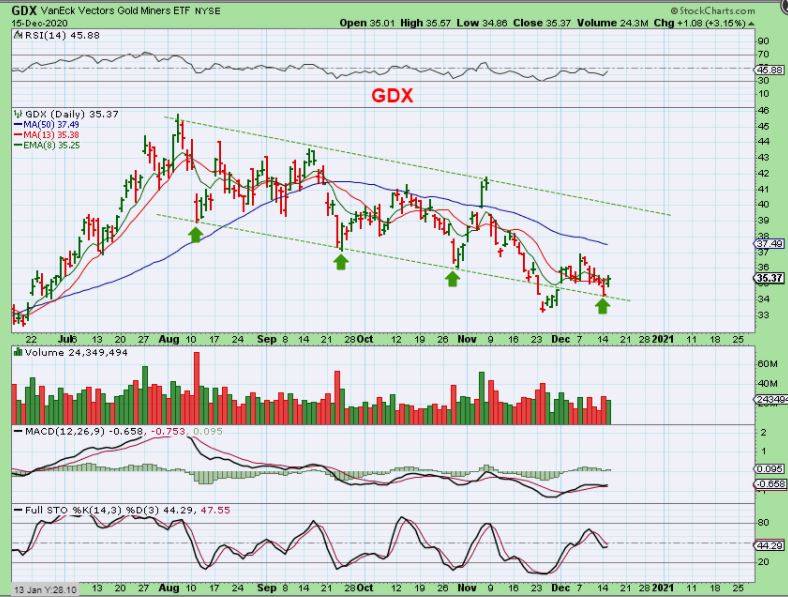
SO YESTERDAY WITH GOLD I POINTED OUT THE 50 SMA ND THIS CHANNEL. I said:
GOLD DAY 11 popped on Tuesday and as you can see, it may prove itself here. It has been trapped under the 50sm and a break above that will give us further confirmation of an ICL being in place for November as I have been saying (and not just another dcl). We are looking for confirmation and the MACD & RSI Look bullish. Hopefully we get that break out above the 50sma sooner than later. We would then be above this channel too.
.
Since GOLD dropped during the FOMC MTG and THEN Rocketed higher, it still hasn’t broken out with conviction, but it is breaking out.
.
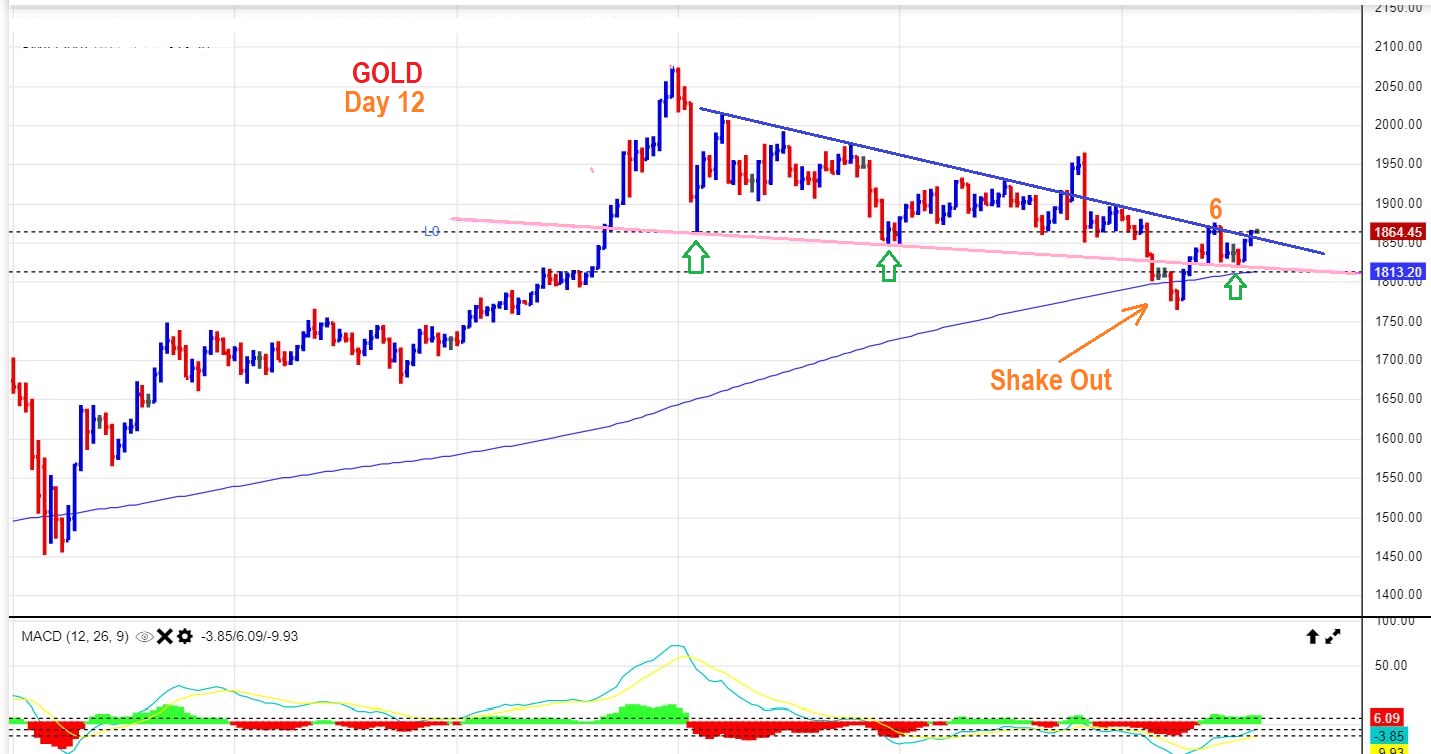
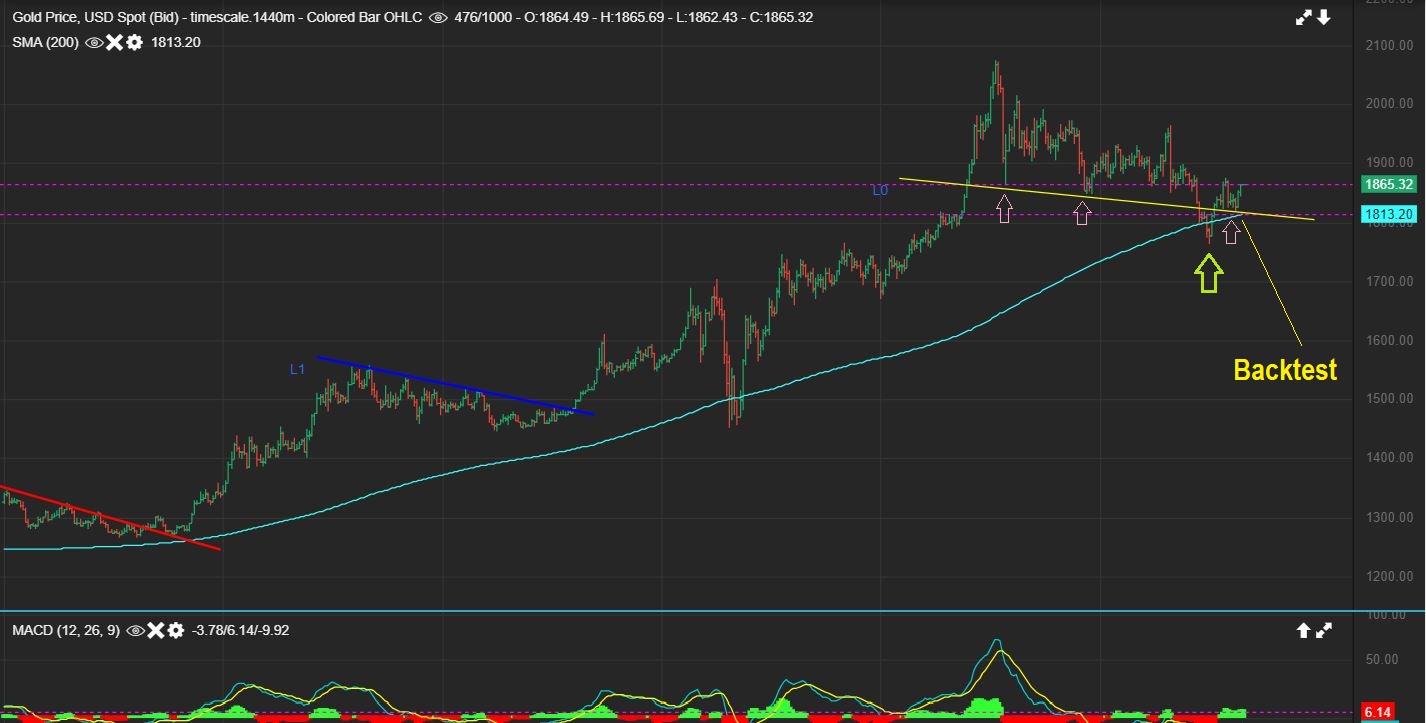
The Bigger Picture for GOLD shows a break below the 200sma and a recovery as a quick shake out. Next Gold formed a higher low that landed right on the lower trend line. We are now starting to push higher.
.
EDIT 6 AM THURSDAY : GOLD IS BREAKING ABOVE THAT 50 SMA
.
,
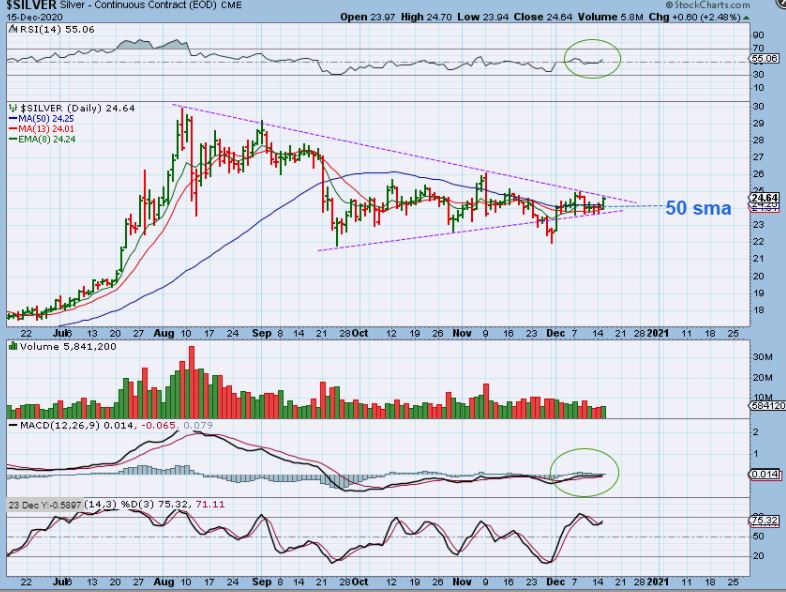
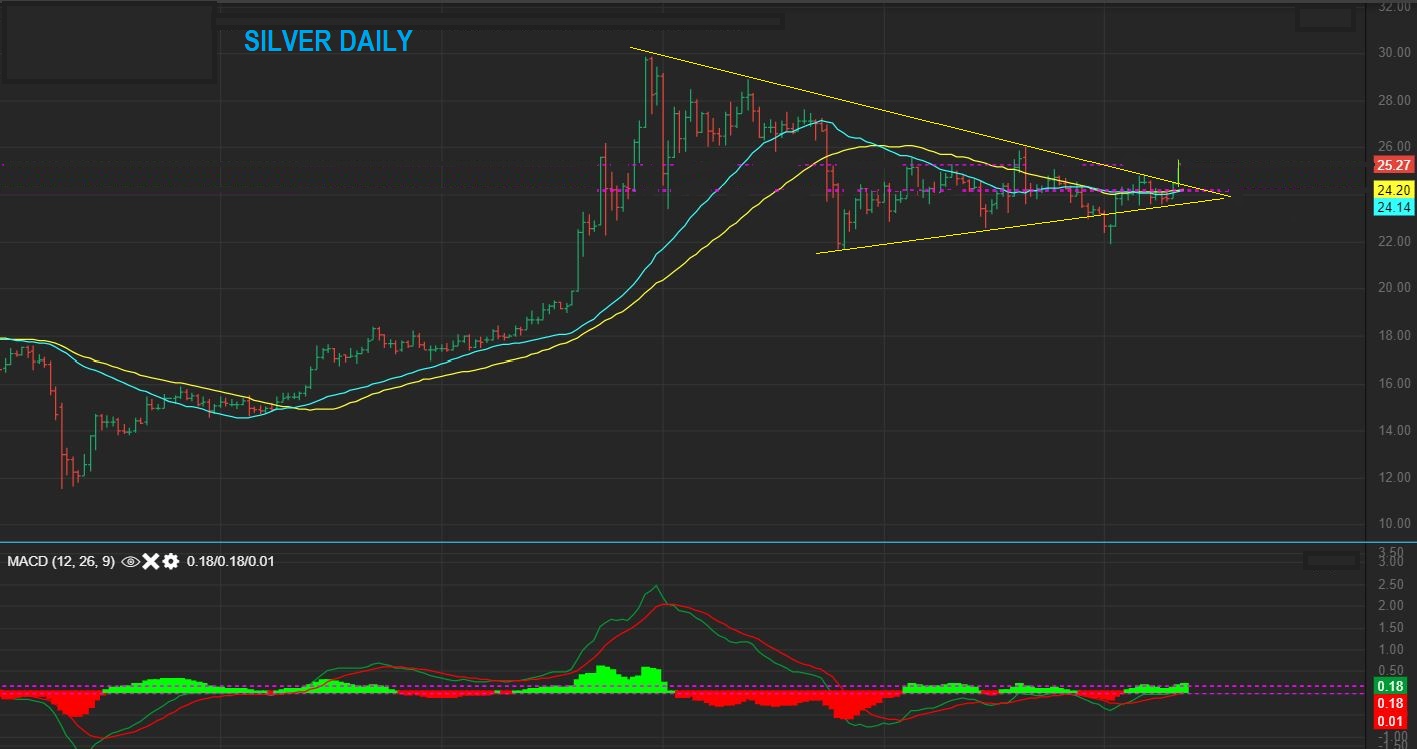
FROM YESTERDAY: SILVER did pop and is very close to a break out, it is out of room here. Silvers is above the 50sma and next is a break out above the downtrend line. I think Silver stocks look very good and have mentioned that I also think that Silvers & Silver stocks will outperform Gold this time around. The ones that I own (CDE, EXK, HL ) were all up over 10% at one point Tuesday.
.
SILVER broke out Wednesday.
.
SILVER also had that false reaction to the downside with the FOMC Release and then a strong surge higher as the Fed Chairman spoke.
.
.
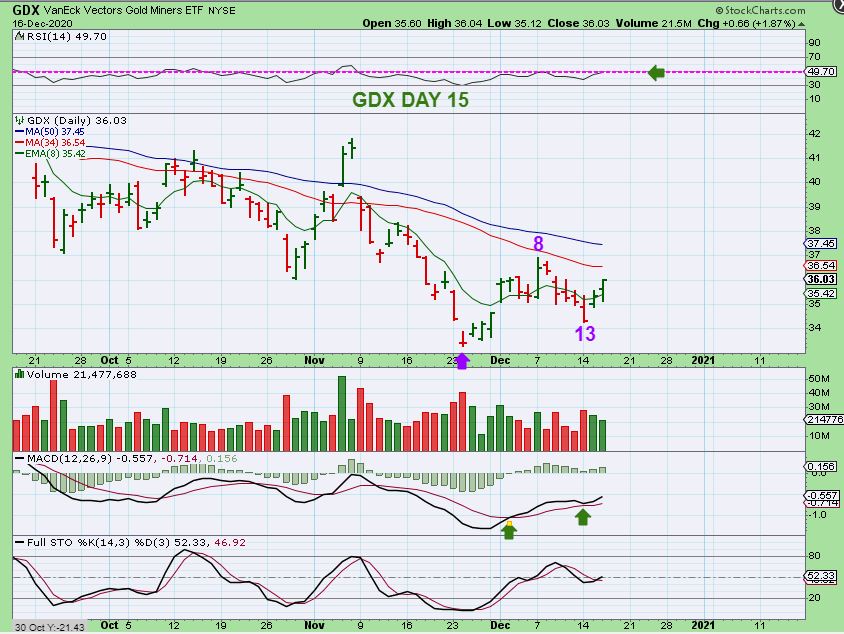
I posted this in Wednesdays morning report for GDX: GDX was a bit lack luster, but some of the Silver stocks moved up 10%, so Gold stocks may be ready to play catch up too.
.
GDX – I wouldn’t exactly say that GDX surged higher, but it did run higher and it did close at the highs. Several individual Miners look really good and I am thinking that this will play catch up soon.
.
The good news is that the Miners as a whole have not just ripped out of the lows and left many behind. It is not too late to still buy some Miners near the lows, while others take off and show us the potential that they have once they get going. Below I will discuss the Miners and a few trade set ups, plus we have a large number of trades already in place and many are performing very well. Enjoy your Thursday trading!
.
~ALEX
.
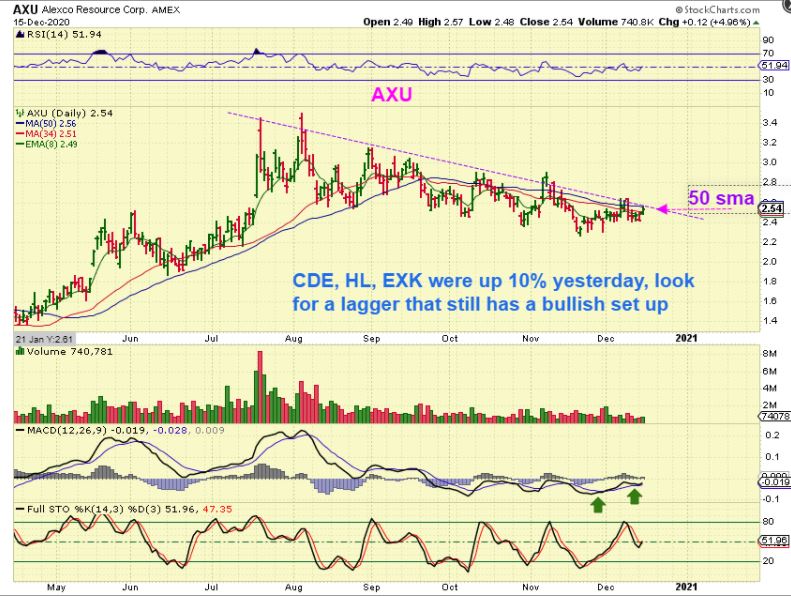
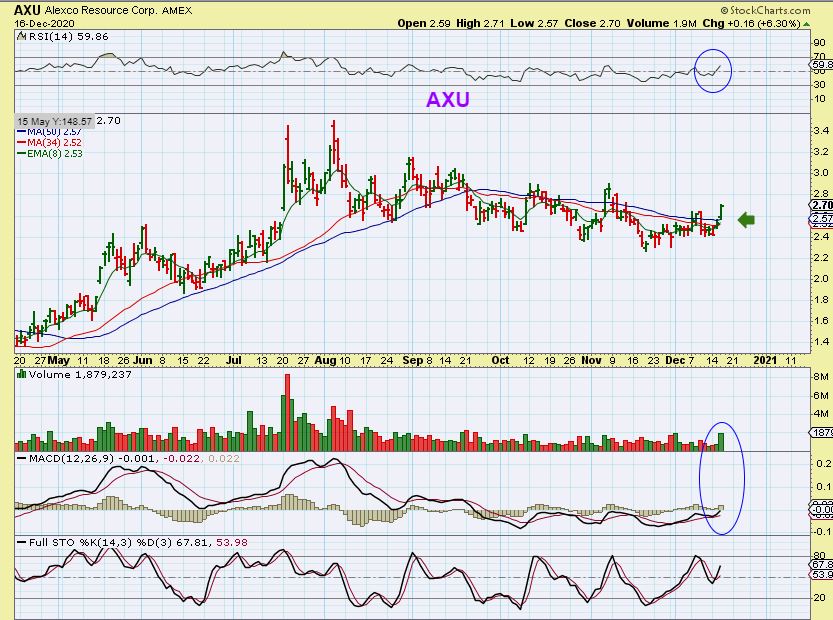
After seeing CDE, EXK, etc up 10% Tuesday, I put in the Wednesday report: AXU, GPL, SSRM, MAG, etc – I would start looking for the ones bullishly set up yet lagging a bit too. Look at AXU here as it pushes on the 50sma and the MACD curled up. You can buy the as low risk set ups with a tight-ish stop under recent lows, or buy them as they break out.
.
I posted a chart of AXU in the live area and bought it. AXU gapped over the 50sma and pushed higher. It is still a buy and has great upside potential.
.
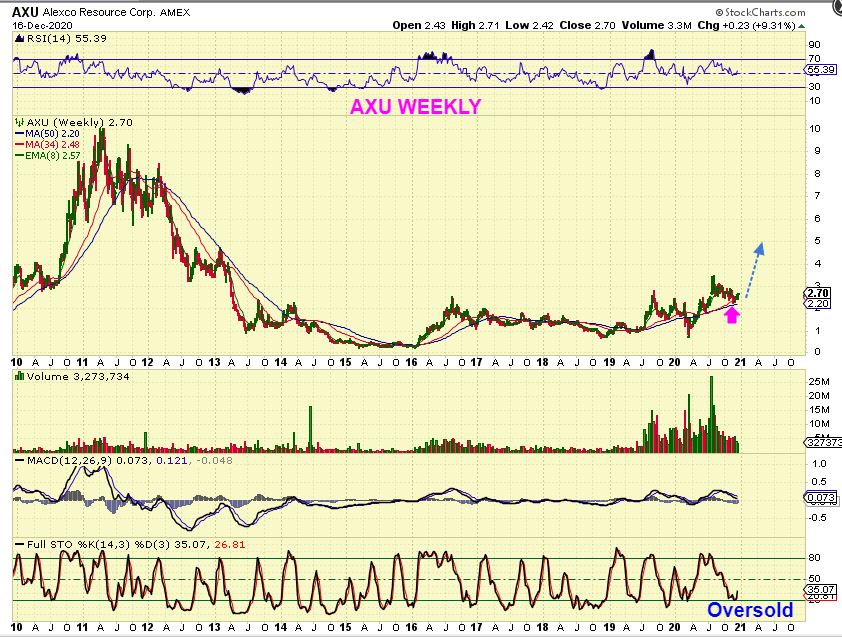
Now take a look at the Bigger Picture for AXU: This is a massive base and the upside potential is excellent! The Blue arrow basically shows what it would take for AXU to run up 100%, and you can see that AXU is oversold on a weekly basis too.
.
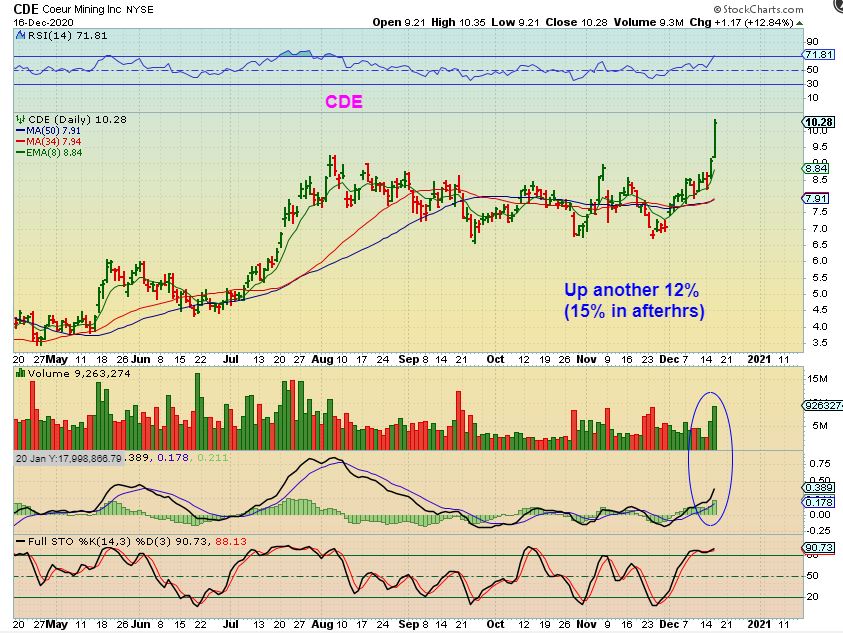
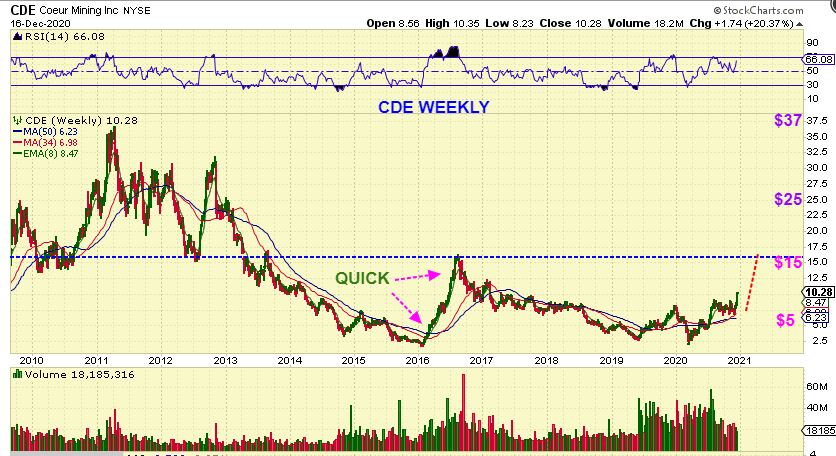
CDE popped another 12% and was up 15% in after hrs. So now CDE has broken out to new 2020 highs and that means that…
.
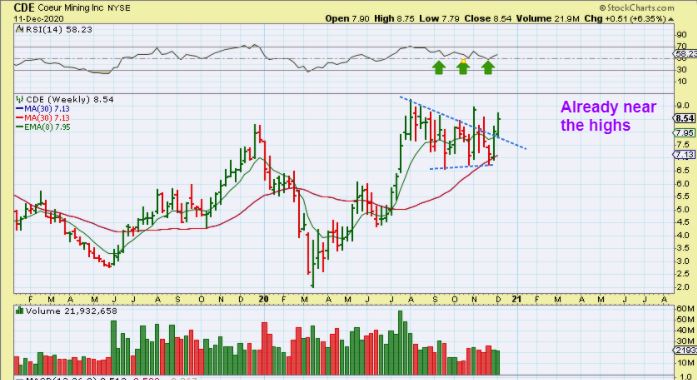
This CDE WEEKLY CHART that I posted last week has also now broken out. What is the Bigger Picture for CDE looking like?
.
CDE started the week near $8 and is up 20% this week already to over $10. You can see that CDE should easily be able to get to $15+ ( about 100% ) and then some. The upside potential is great longer term when a stock runs from a base.
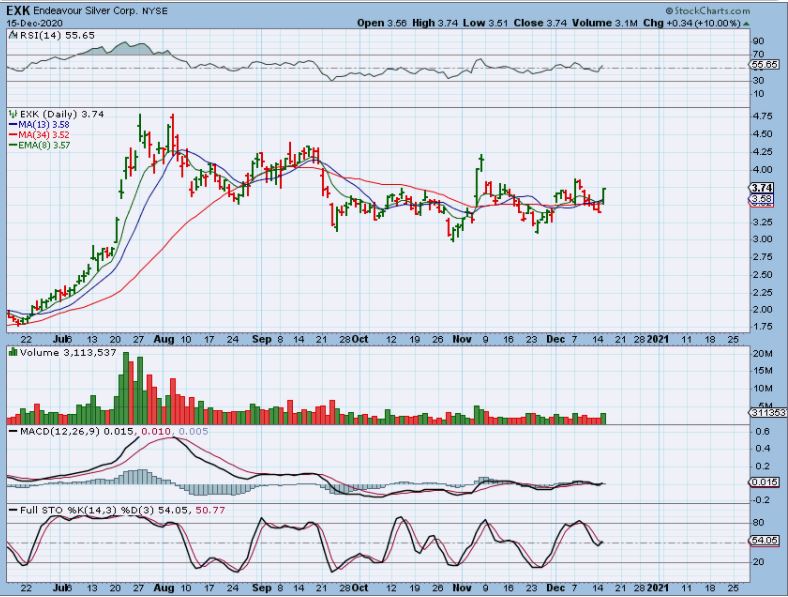
ALSO FROM YESTERDAY : EXK DAILY – ” Tuesday morning I posted in the live trading area under the report that EXK gapped above the 50sma and I added to my position. It also closed up 10%, so you can see that some of these Silver stocks are performing well. ( This is still a buy, especially if it dips).”
.
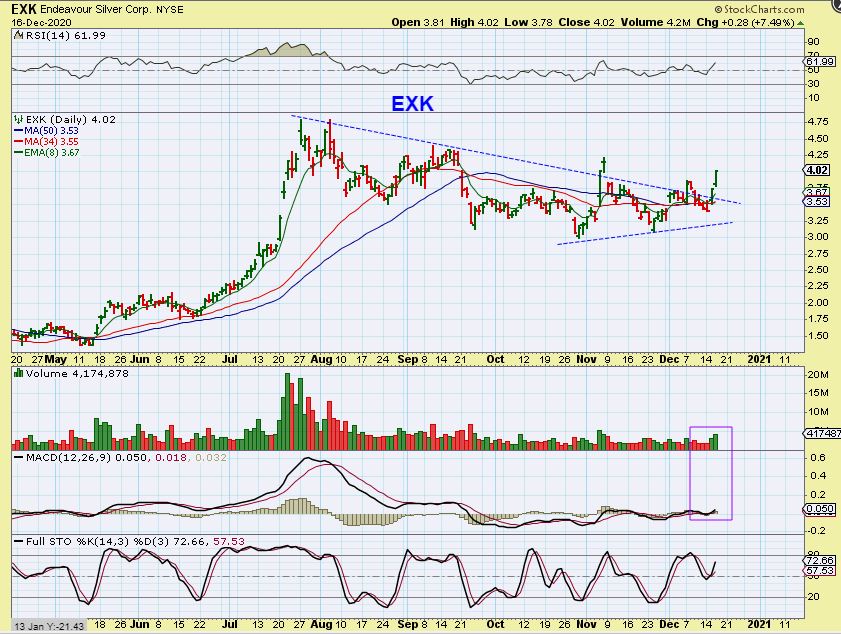
On Wednesday EXK added another 7% and volume is slowly increasing. I do like the way the Silver stocks are leading the way here. The Big Picture for EXK is great too.
.
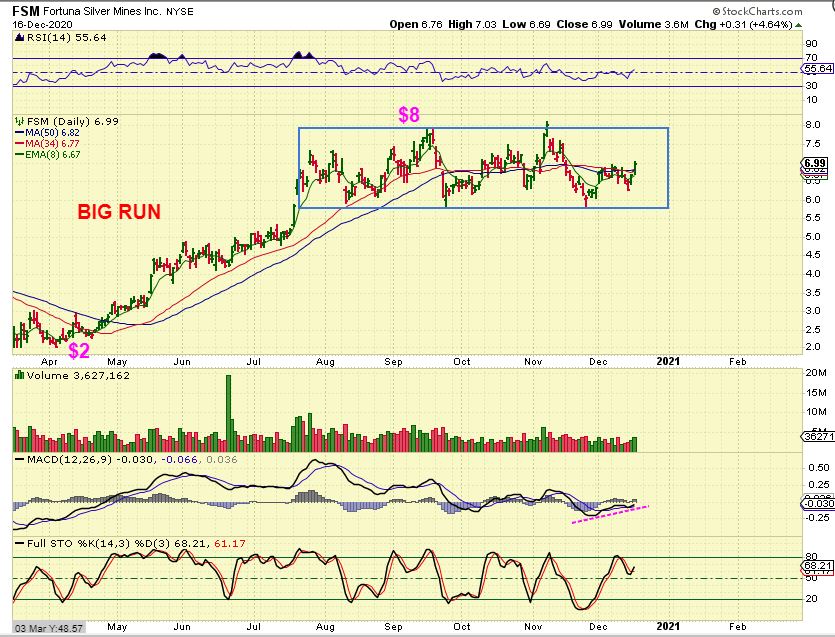
FSM had a very big run in 2020 from $2 to $8. It has now formed a 5 month Box consolidation and this can simply add fuel to the fire when the next rally takes hold. FSM broke above the 50sma Wednesday and that next rally phase may be starting.
.
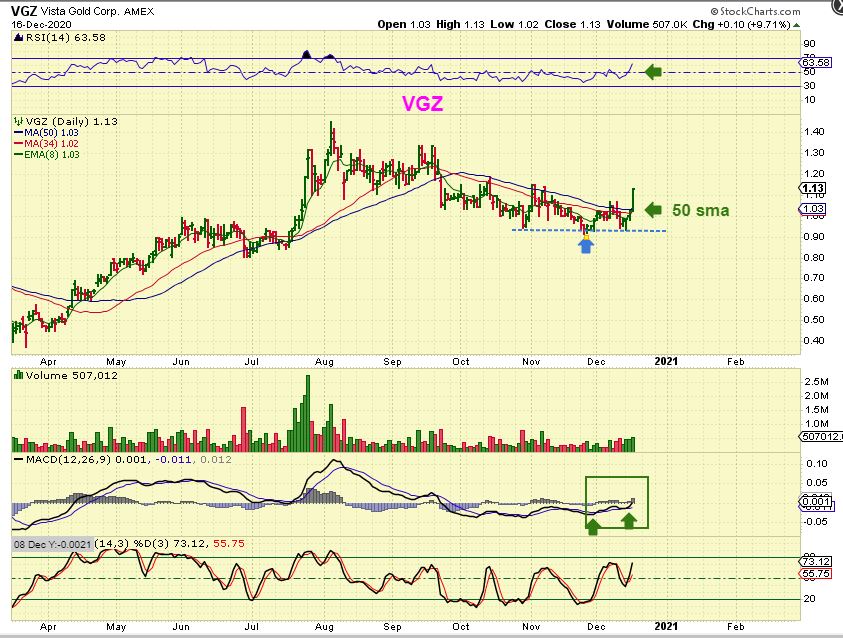
If you looked at VGZ before Wednesday you would just see a gold stock stuck under the 50sma and it looked average. Wednesday it popped 10% and most of that move came after the FOMC MTG.
NOTE: We may now see more GOLD STOCKS start to do this with Gold breaking above the 50sma. It is a buy and may be showing us that Gold stocks are going to join the race now that the Fed Mtg has passed.
.
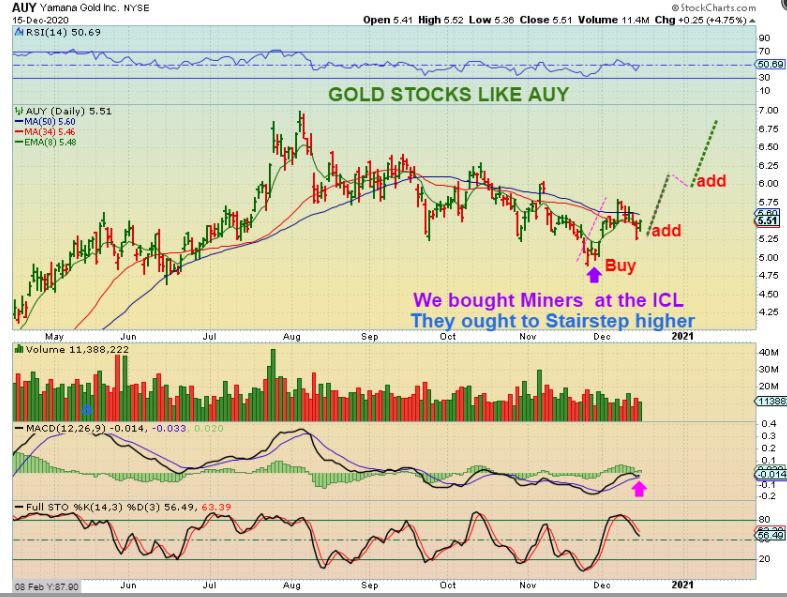
FROM YESTERDAYs REPORT: AUY – So when I see a set up like this, this is how it looks in my head. I add to my position if it breaks out above that 50sma and you can continue to build your positions as your confidence grows. Confidence grows as we see confirmation unfold in the price action.
.
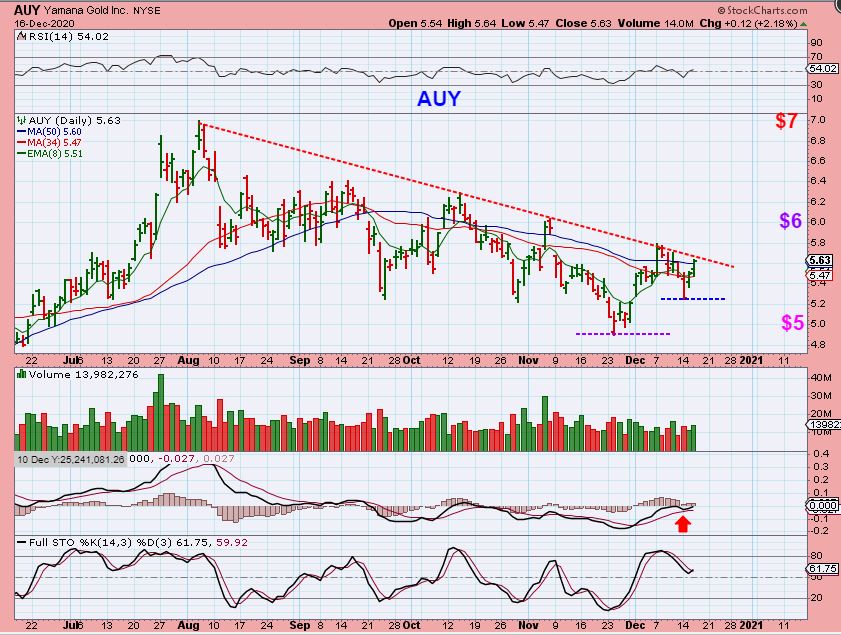
AUY popped a little Wednesday gaining the 50sma. It is a higher low and also could be viewed as an inverse H&S. It is still a buy here or even as it breaks out. This is another Gold stock that may be ready to start running higher too, especially as Gold breaks the 50sma.
.
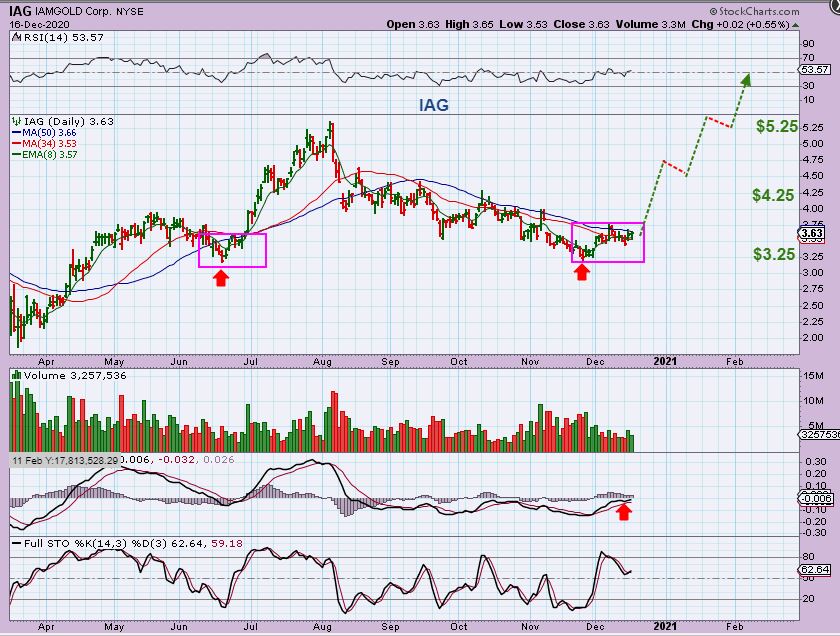
IAG certainly isn’t over extended, but it may push above that 50sma soon too. You can see that it has been unable to CLOSE above that blue 50sma line since August, but it is now 3 cents below it. Some of these Gold stocks seem to be ready to go higher and even $3.50 to $5.50 is a great trade (above former highs). These can go much higher than former highs if the ICL is in place. This could POP over the 50sma as Gold breaks the 50sma.
.
It does look like that ICL for Gold came in November just like in 2019. We should have weeks and even months of upside gains going forward, so I will continue to look for and post set ups in the Precious Metals Sector as they develop. Why do I always cover the smaller Miners? What about the Big Boys? They have slightly less %-Gains in the short term, but are still a good buy too. They also may be considered ‘safer’ since they are less likely to have a ‘public offering’ or surprise to the downside. Let’s look at a couple here…
.
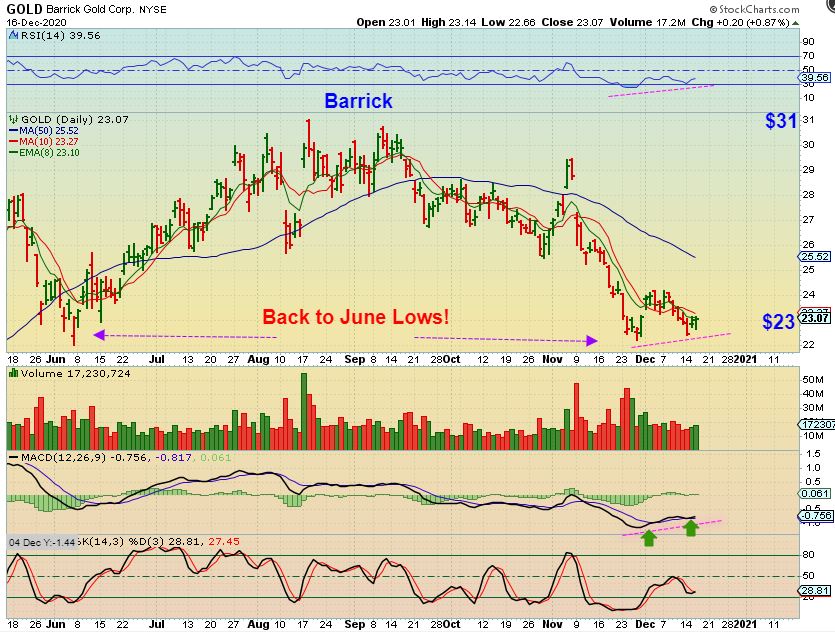
Let’s look at Barrick: You can see that it is all the way back to the June lows, while some Juniors held up better. This could be funds or larger holders dumping their shares, especially in that capitulation sell off that we saw in November. I would say that Buyers will be stepping back in soon, so this ( and NEM, RGLD, etc) can be considered to be an easy buy with a stop just below the recent lows.
.
..
AEM had a period of selling into November that resembles capitulation selling. It lasted almost 3 weeks and it was that day after day selling that makes you wonder if it will ever stop. I think we have the lows in place and it did a nice snap back rally over the past 3 weeks since the ICL in November. AEM ran from $30 to $90 from the last ICL! I would say that this has great potential for the BUY & HOLD investor that just wants to park some money and let it play out.
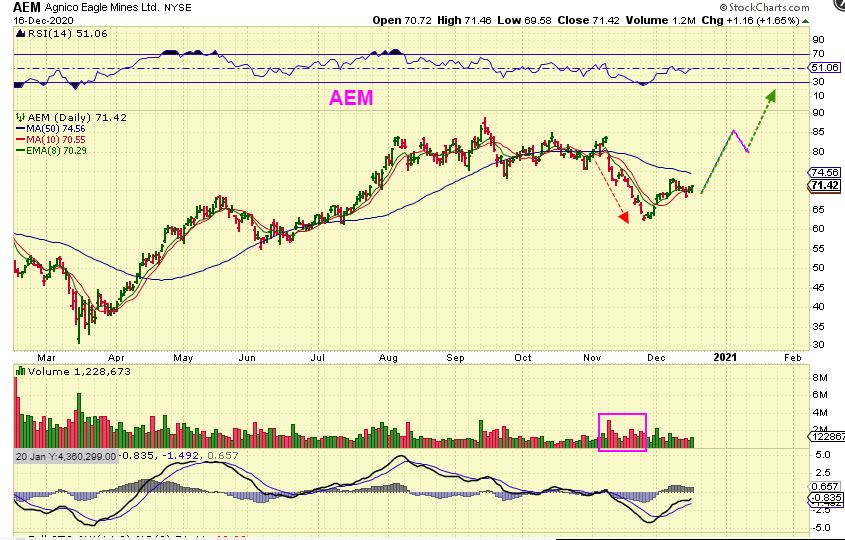
It has been a nice slow methodical Bottoming process and this is allowing many to take position in the sector gradually. There is plenty of time for upside gains once an ICL is in place and buying near the lows allows for a stop to be in place to protect funds.
.
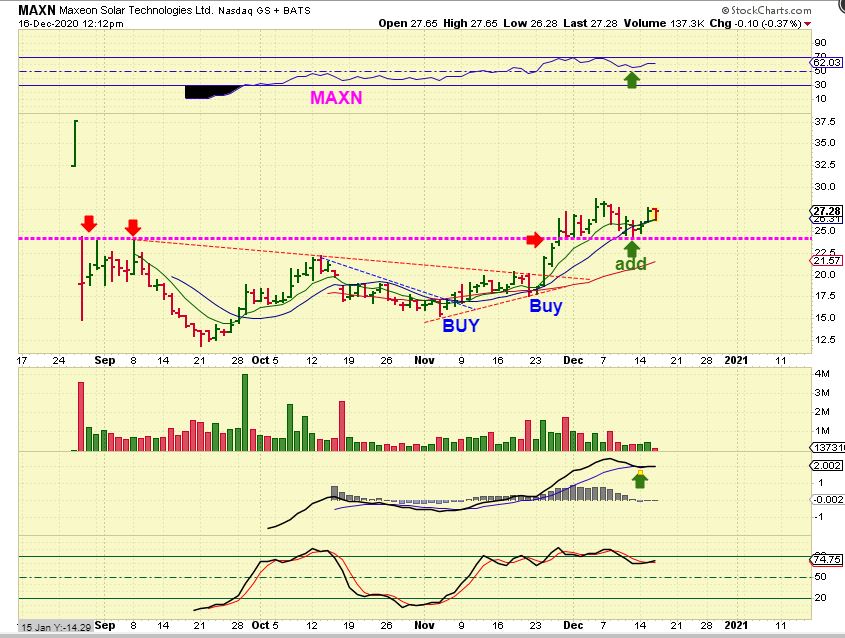
The Solar stocks have been Bullish and after this mini consolidation MAXN has back tested the break out and still looks ready to move higher. It closed slightly higher (green) after I grabbed this chart. We have also traded CSIQ, SPWR, JKS, SUNW, SOL, etc.
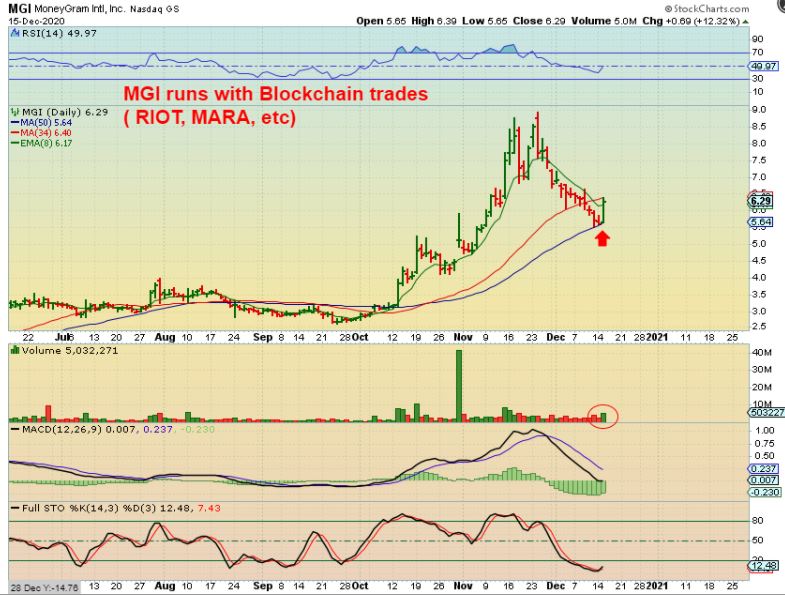
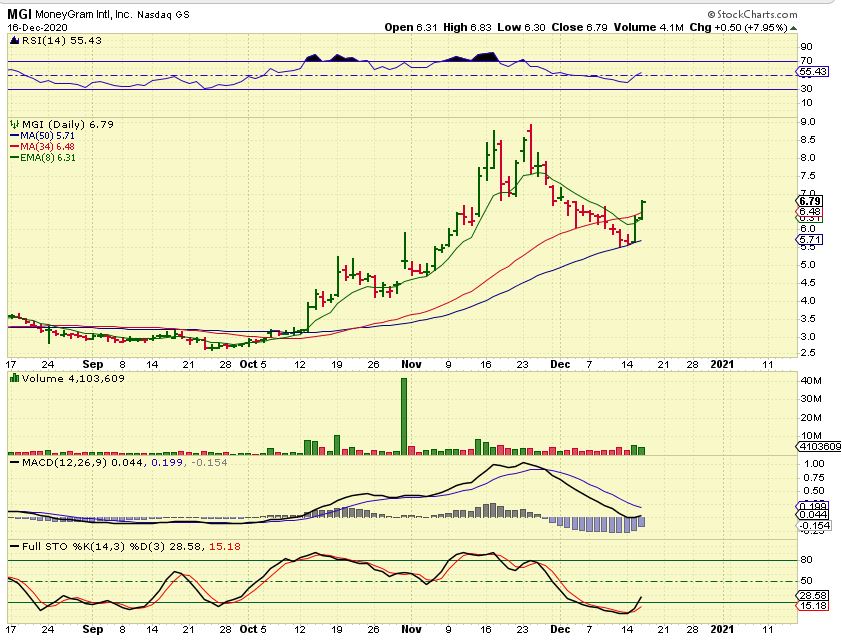
YESTERDAY I WROTE: MGI runs in the same sector as RIOT, MARA, etc and was up 12%, but it also looks oversold and set up with a nice risk / reward ratio. I bought the reversal and this remains a buy as Bitcoin Looks ready to break higher.
.
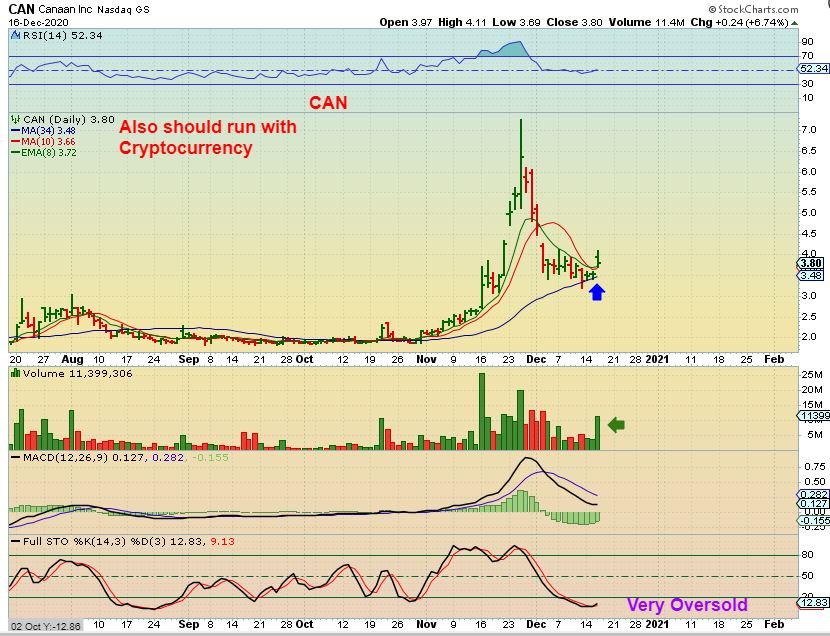
MGI moved up another 8% above the 34 sma too and this can continue to run to former highs or beyond. RIOT, MARA, HVBTF, and others have been extremely strong. NXTD was lagging and suddenly popped 100% Wednesday. CAN is another buy candidate in this sector.
CAN – This is another Stock that runs with Crypto and I bought it on support. Yesterday it popped and dropped, but I still think that this could take off with Bitcoin above 20,000. NXTD was ‘lagging’ and suddenly ran up 100% yesterday alone.
.
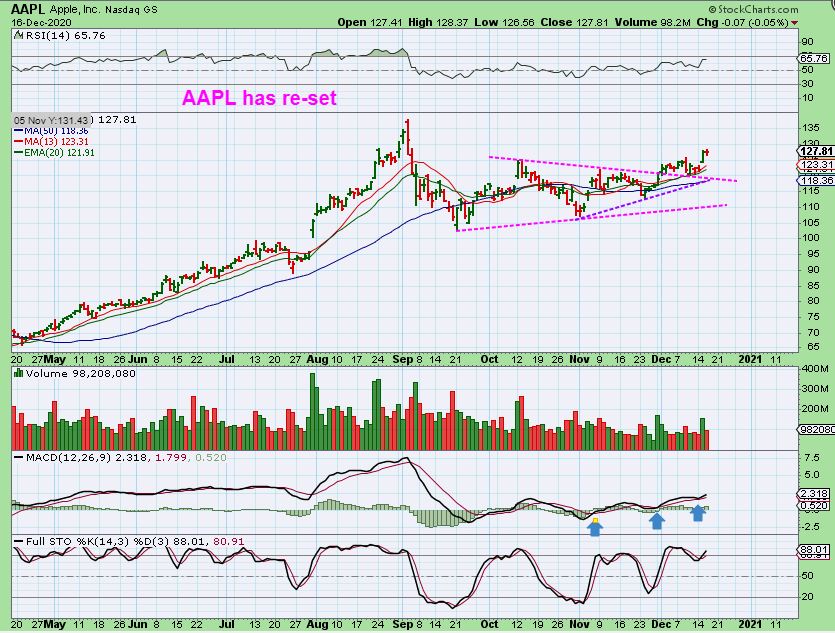
AAPL has a series of higher lows and is a bullish consolidation. If you like bigger higher priced stocks to just park some money in, the old FANG stocks seem to have done a consolidation re-set.
.
BY REQUEST, THE SEMICONDUCTORS: We have a reader (at least 1, maybe more?) that told me she bought 3 Semiconductor stocks when I recommended them back in October as a ‘buy & hold’ and IS STILL HOLDING THEM! Very Nice! Buy, Sell, or Hold? I’ll start by saying that a blow off top would probably catapult these higher, so you could use a trailing stop, but let’s take a look…
.
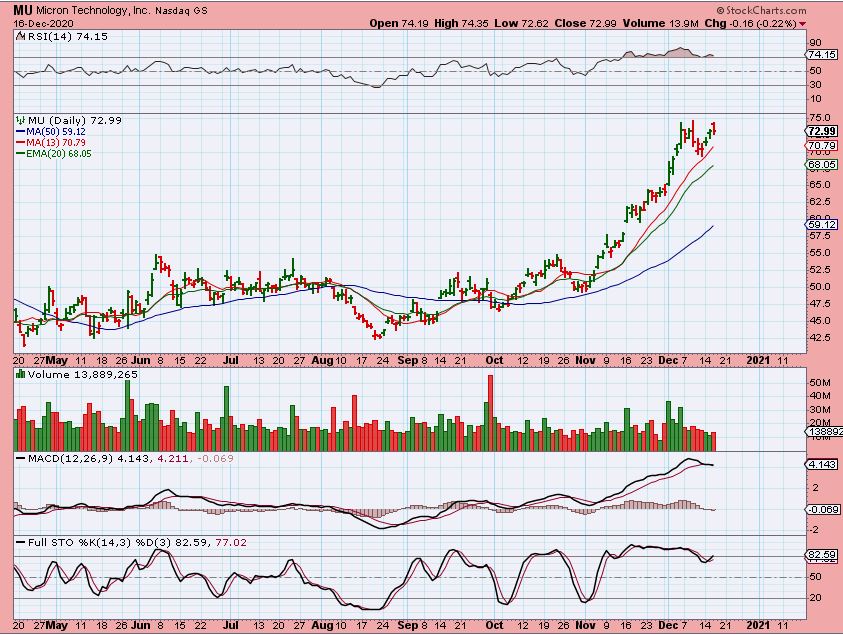
My November chart of MU -It was a buy in October and this dip was a good place to add. I was highlighting MU, AMD, TSEM, CREE, INTC, etc and the whole sector looked good, so that is encouraging. So the Buy was $47 and the ‘add’ or ‘buy’ was $50.
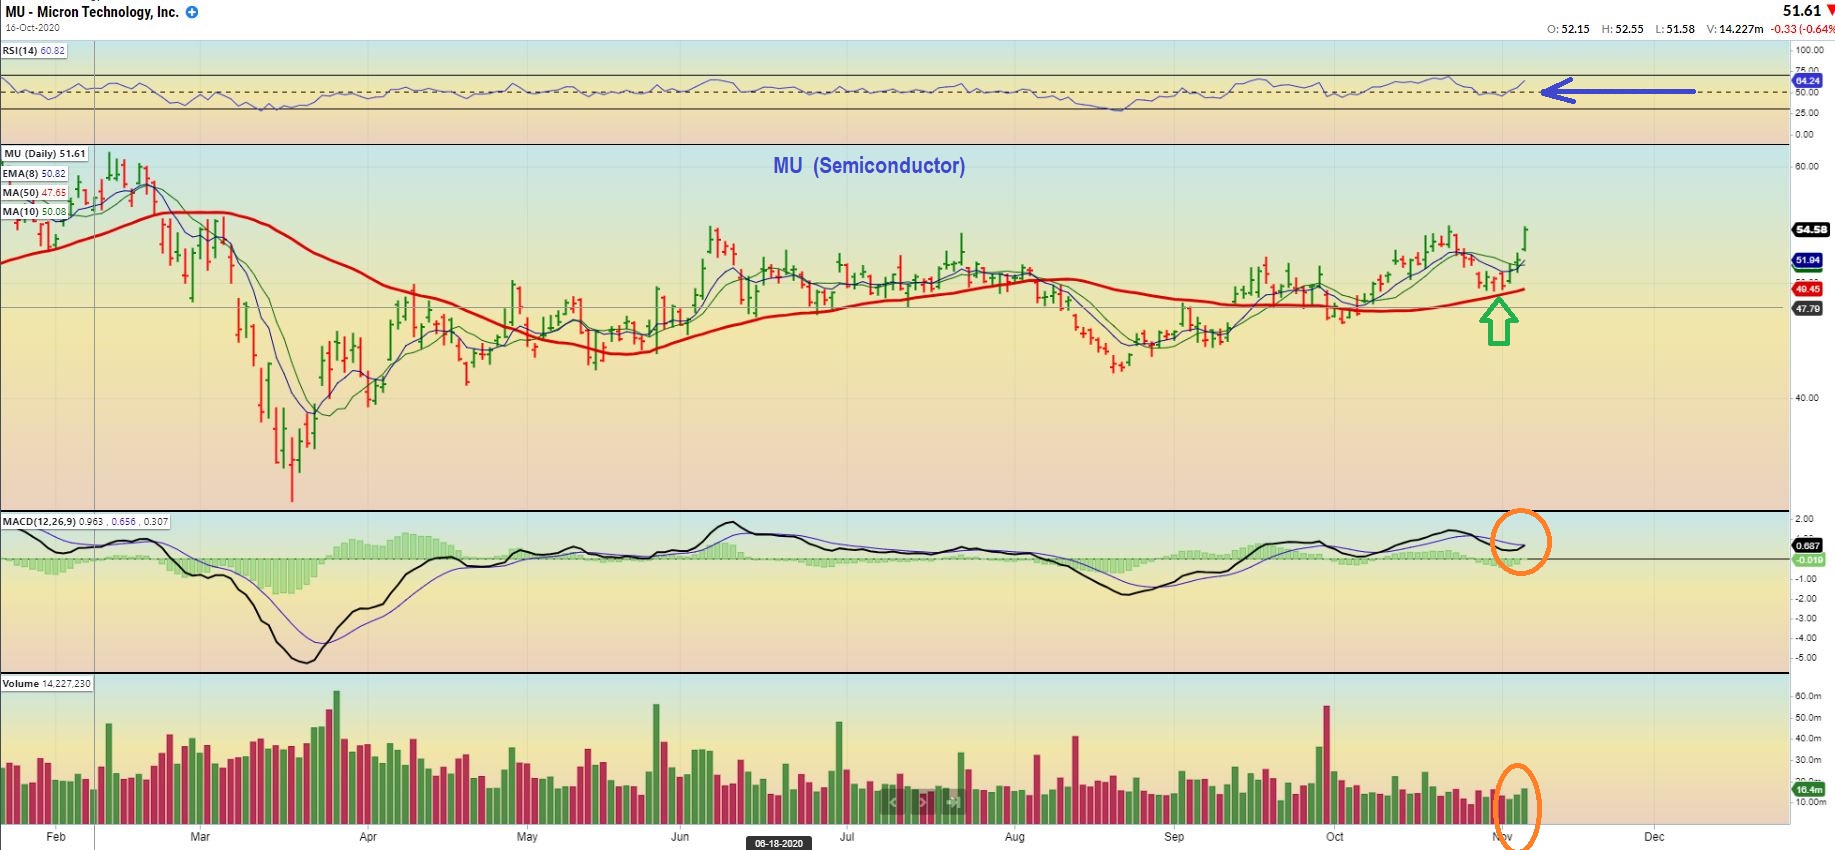
.
MU is at $73 and it MIGHT be extended, but I’d just use a stop rather than sell (Or sell some and add on a dip). Your stop can be the 13 sma ( may be too tight) or the 20sma.
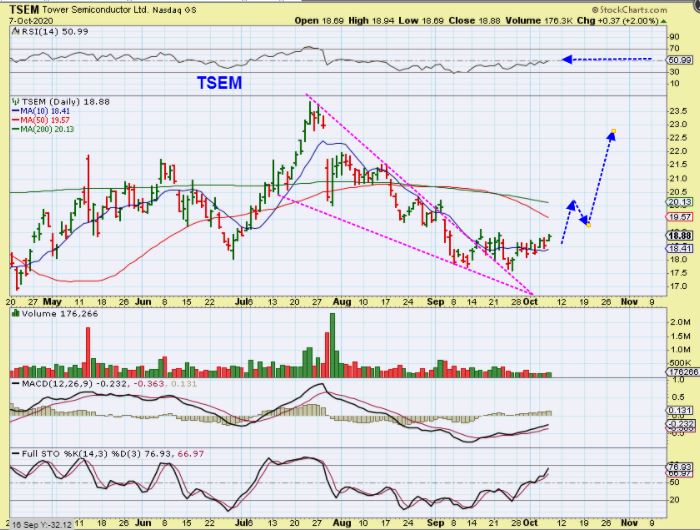
TSEM from Oct 7 – TSEM broke from a bullish wedge and I expected it to run higher with that sector after the General Markets dipped and put in a higher low. TSEM was in the $18 – $19 area…
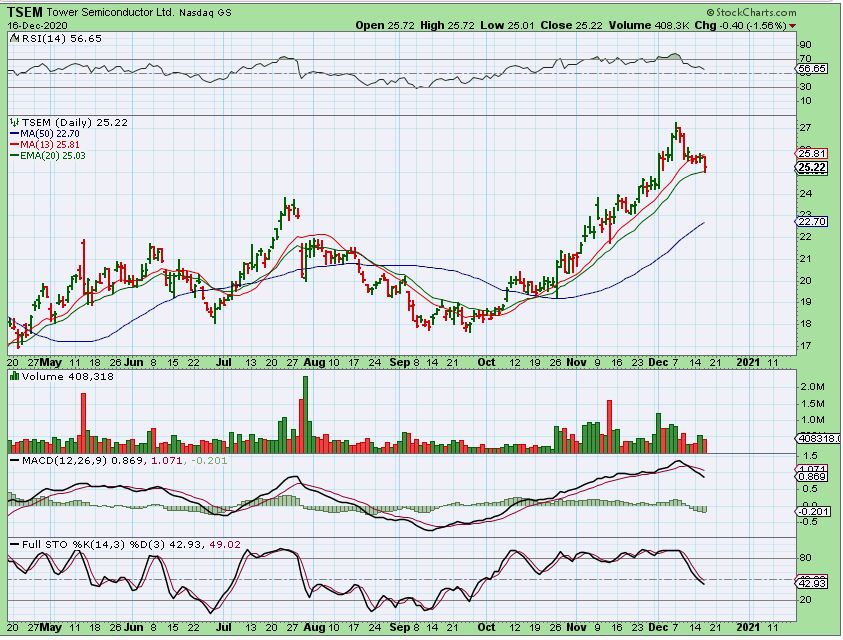
TSEM has moved right up the 13 sma just like MU, and tagged $27. This smooth run along the 13 sma is why our reader says she never felt the need to sell. It has now broken the 13 sma, so is it a sell? It landed on the 20sma and to be honest, I would say that it may want to back test the $24 area, but it could remain buy & hold. Lets look at another chart…
.
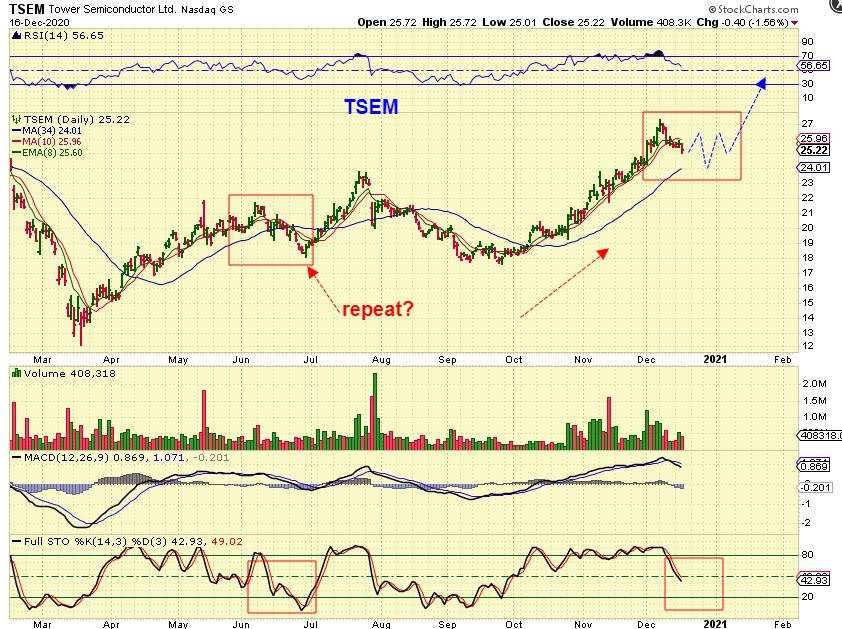
This may or may not happen, it is a possibility after a long run.
TSEM may drop to $24 as a back test of the 34 sma & the prior high. We could see a ‘consolidation’ similar to the one on the left, but please understand that we also may just shoot higher. Some years we see what is known as ‘ A Santa Clause Rally’. If people have good gains, they may not want to sell and pay taxes on the gains yet, so they buy & hold into the year end. We may get that rally into the end of the year.
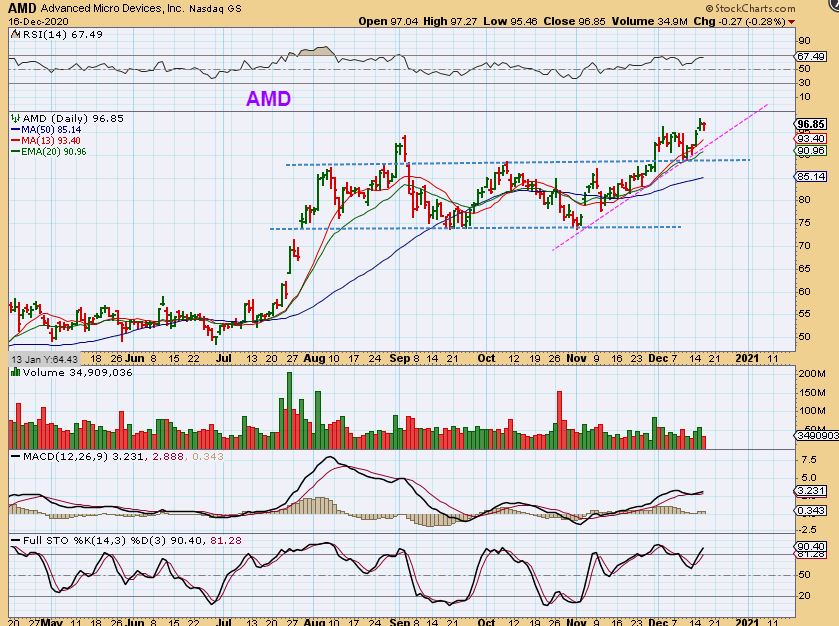
AMD has been in a multi-month consolidation thatt looks to be breaking out now. I would actually have called this one a buy or a good place to add on that back test, and AMD has been an excellent long term buy & hold. November to now was $75 to $100, but it can go much higher if the markets stay bullish.
.
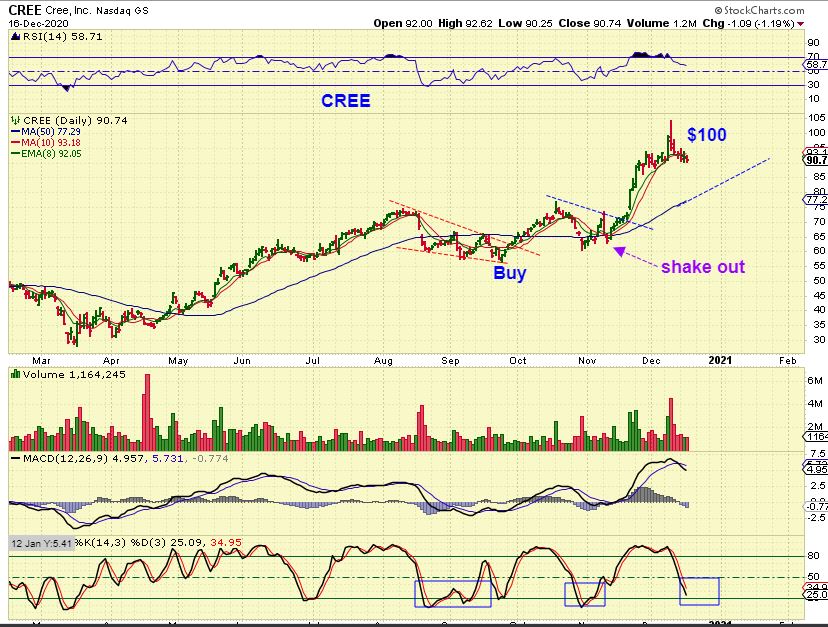
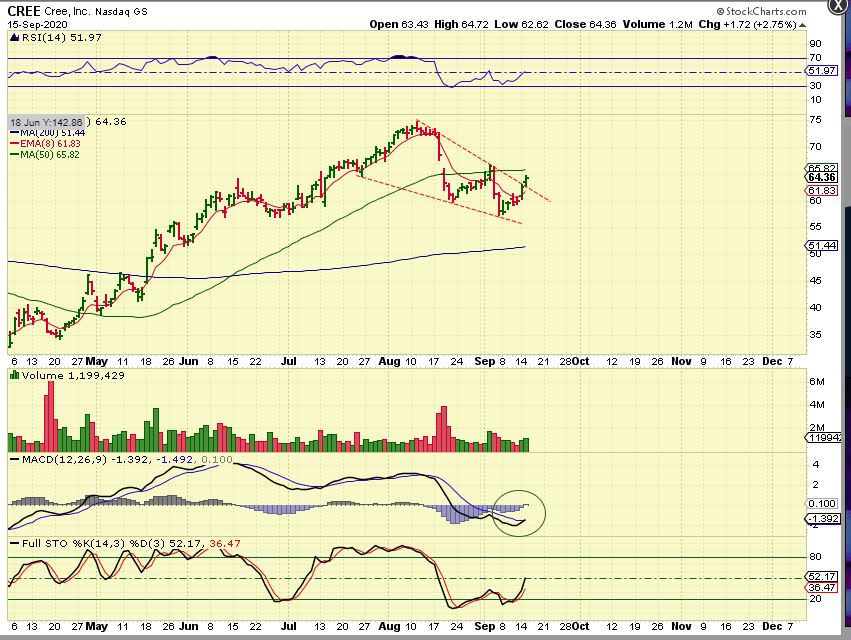
Finally CREE – This was a buy in September at the 50sma near $60 and a bullish descending wedge formed so…
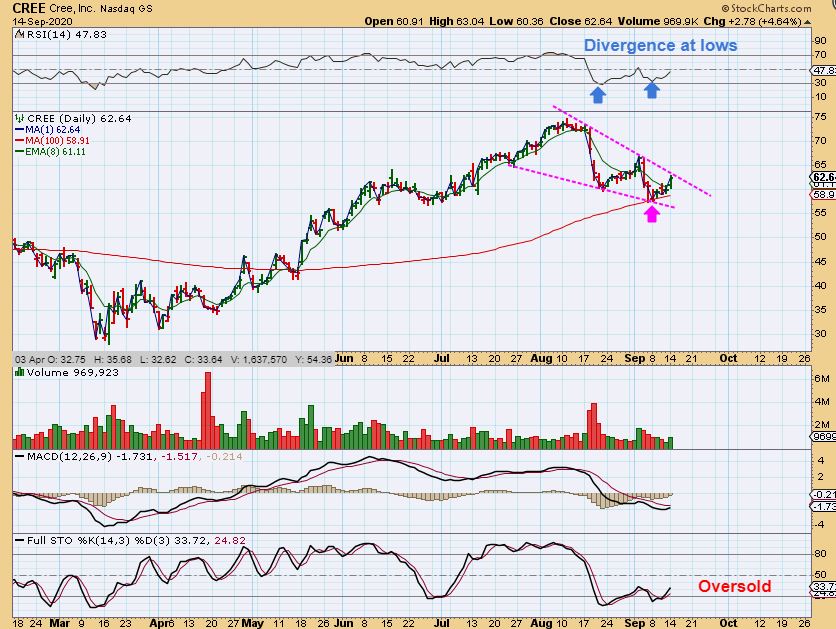
CREE – was also a buy the next day as it broke out. So it was a buy at $60, $62, and $64 …
.
CREE ran from $60 to $105, but this was NOT an easy ride. I don’t know if you got stopped out at the shake out, but you did say you still own CREE too. Well, since CREE dropped so much in November, I would say that it MIGHT drop to the rising 50sma if the sector dips or chops (They all seem to have become extended, but some are just sideways chopping to consolidate). It is getting in the oversold area so it also may just chop sideways. OVERALL…