Weekend Report November 21st
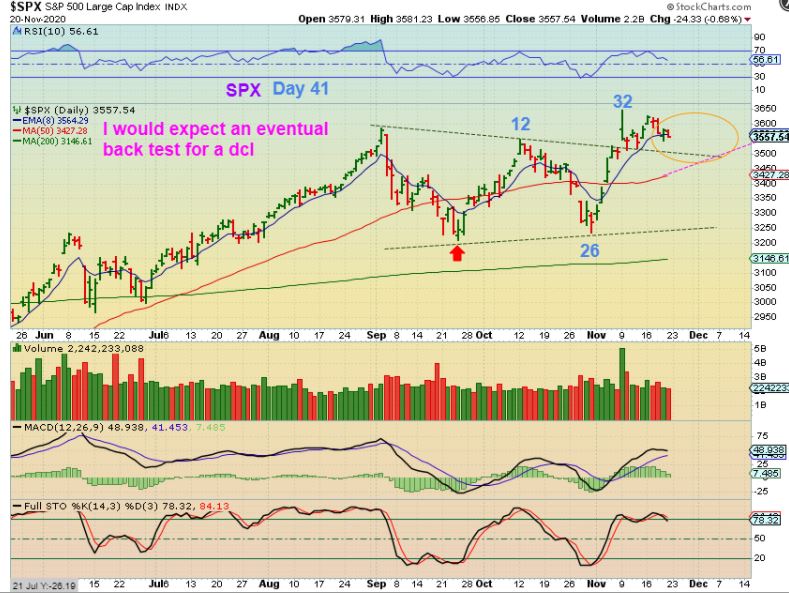
SPX DAILY – The General Market can have 45-50 day daily cycles. Unless day 26 was an early dcl (I never called it a dcl, but 1 of my readers asked if it was), I find us to be on day 41 and a normal dip could do a back test.
.
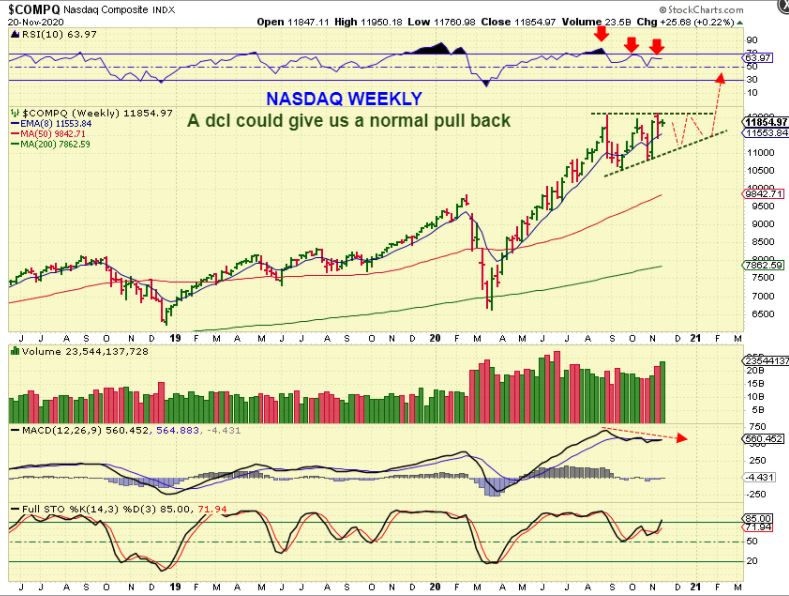
If the NASDAQ WEEKLY pulls back from here, I could see it forming a bullish flat topped wedge. I do see slight divergence on the weekly chart with price at the highs, so I think we’re going to see a pullback soon.
.
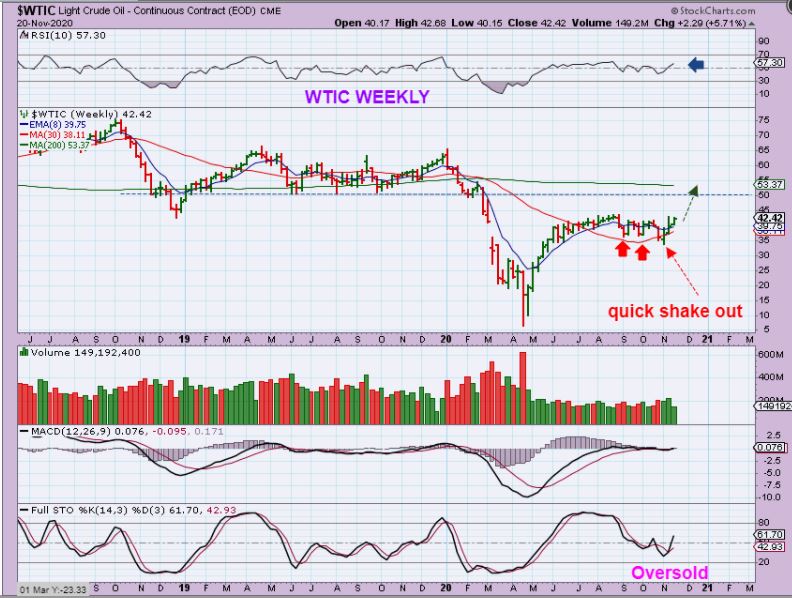
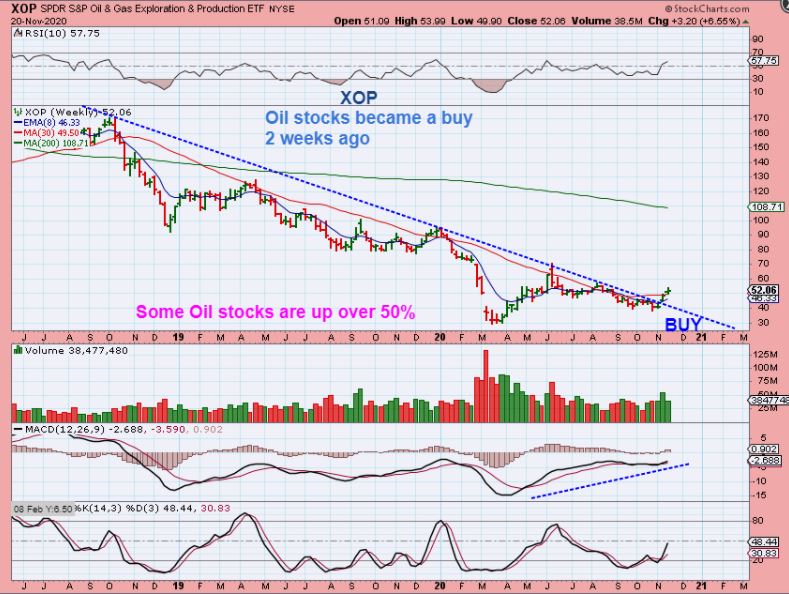
WTIC – After a slam down low (shake out) Oil and Oil Stocks were declared as Bullish. Oil has now recovered the 10 & 30 week MA and I called that shake out a possible ICL.
XOP – Oil stocks have done very well since I mentioned that they could be bought. The XOP broke a long term downtrend, the MACD had STRONG Bullish Divergence as it put in a double low and a swing low. It is still oversold on a weekly.
.
I have mentioned that these Oil Stocks can be treated as a ‘Buy & Hold’ or ‘Swing Trades’ when bought near support or on a dip (like the 10sma). Now let me show you the Big Picture progress and potential of just a couple of these.
.
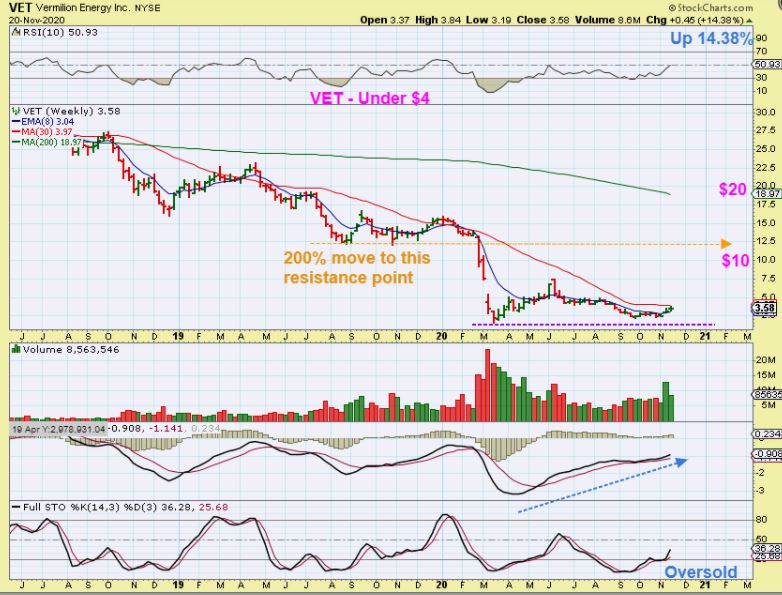
VET released earnings on Nov 9th and it was favorable. It has actually chopped sideways for a few days but is up 60+% off of the lows already. Even from here a run to $10 is 200% and these do look to be recovering. This is still oversold on a weekly chart and still near the lows really.
.
APA has gone from $7.50 to $12 in 3 weeks. It gained 11% again last week. Look at the MACD while it also remains close to the lows and oversold.
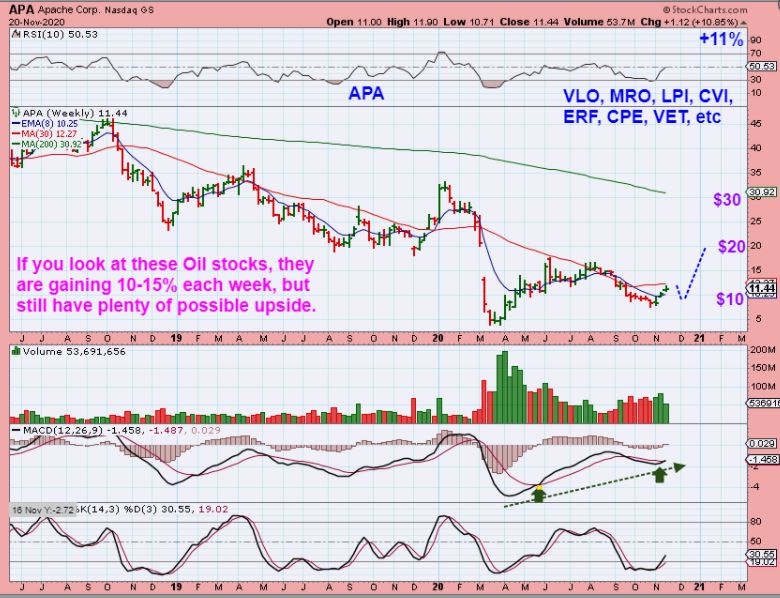
So this sector has double bottomed and dips can be bought.
.
.
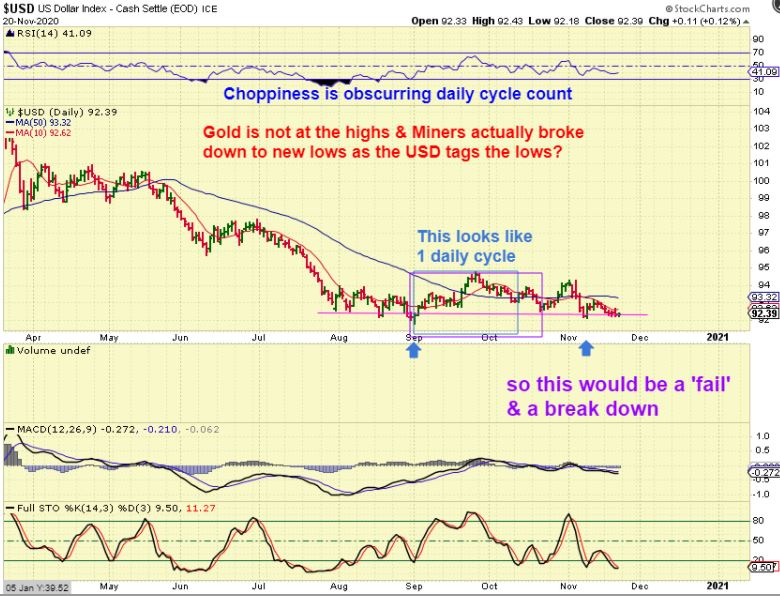
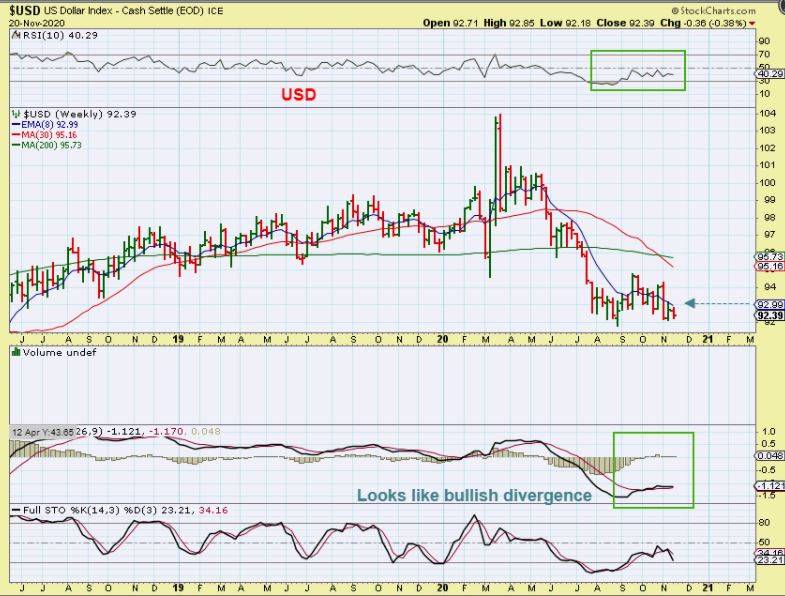
THE USD – This is causing my analysis a problem and raises questions.
1. The USD is at THE LOWS again, shouldn’t Gold be at The Highs?
2. Miners broke to new lows this week, and the USD is at the lows too?
3. Daily cycle count makes this look like a failure, so it should break down. THAT WOULD help Gold, but…
.
USD WEEKLY – This gets a bit confusing. The USD has been weak and is near the August lows, but I see weakly bullish divergence in the MACD & RSI. That would have me expecting a bounce from the USD. It doesn’t seem that a bounce in the USD would be good for Gold, but the correlation seems to be broken again.
.
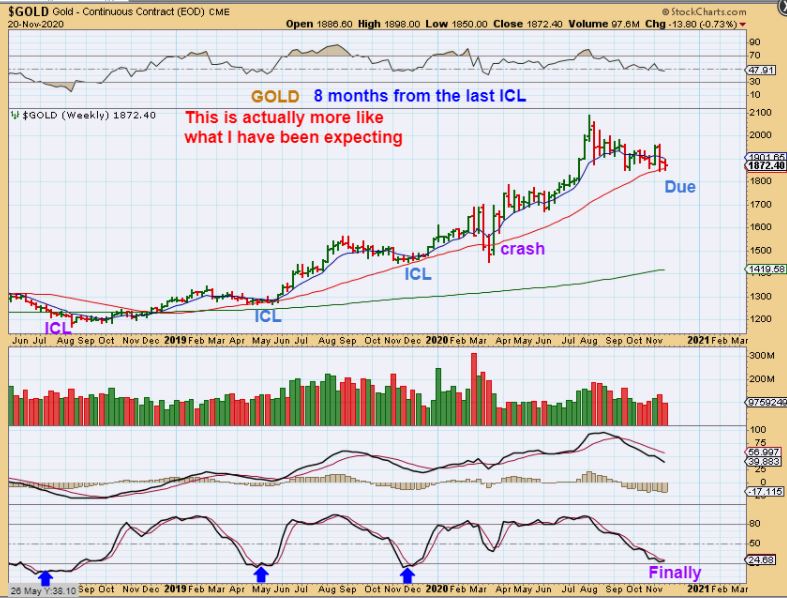
When I look at Gold it does resemble a drift into an ICL that should be finishing up now. Lets take a look.
.
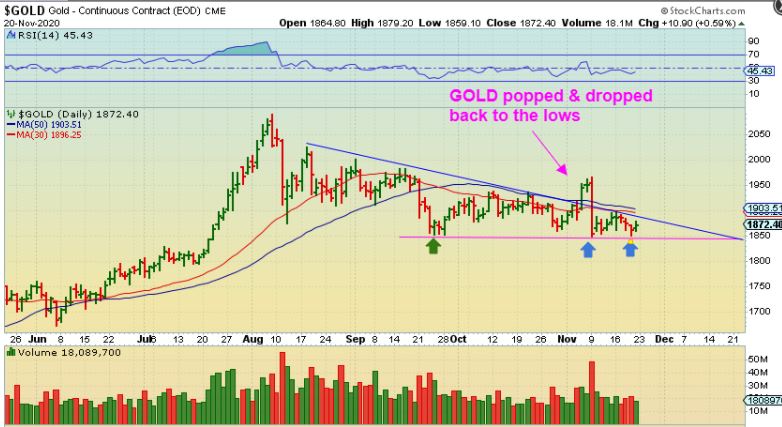
GOLD – I have discussed that even though Gold broke the downtrend and may have an ICL in place, it bothered me that it really didn’t reach oversold or the red support line weeks ago. Now Gold is 8 months from the last ICL and is looking like I was expecting it to look at an ICL. Please read the charts details, this actually looks very good.
.
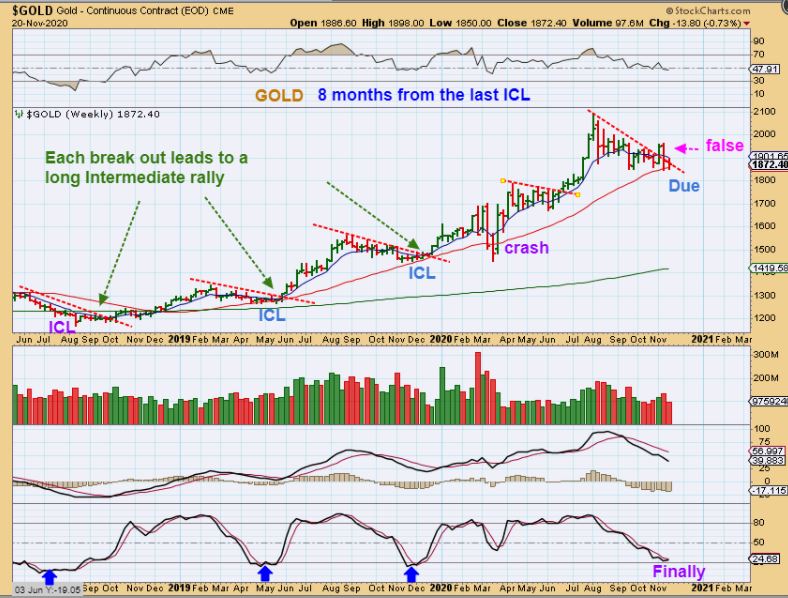
GOLD will break a downtrend after an ICL and a nice rally out of the ICL is what we would expect. A Rally that lasts for weeks and Months. Unfortunately We just had a false break out at the FED MTG and landed back at support. See the charts details.
,
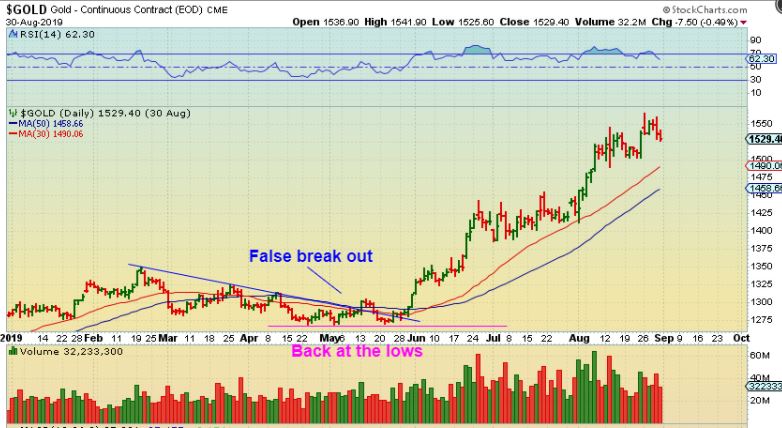
I found this interesting: I was looking at the Big Picture of Gold and noticed that in MAY 2019 Gold popped from a downtrend and instead of rallying, it chopped and dropped back to the low. Is that what we are seeing now too? Look at the chart.
.
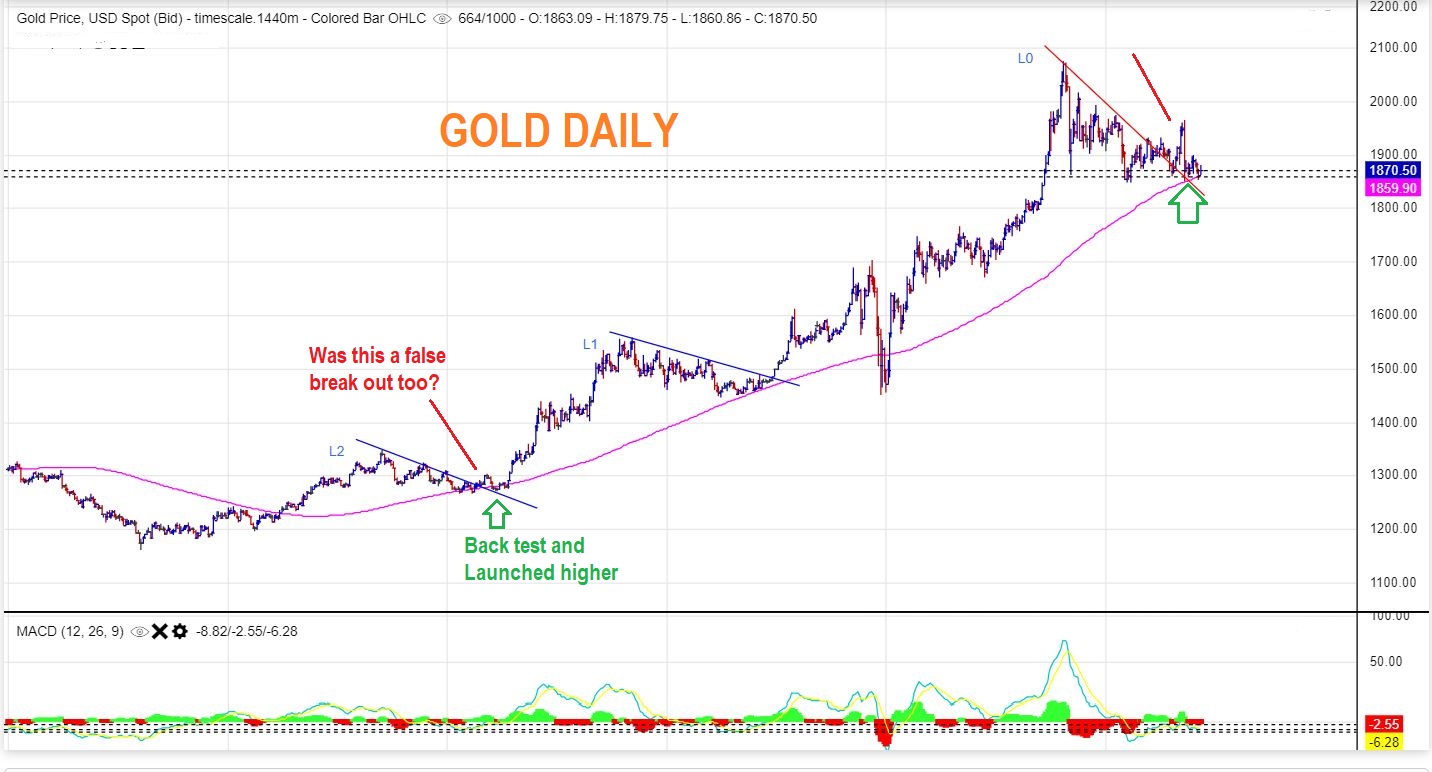
GOLD : So this is Golds current False Break out / Bull Trap from a downtrend line, and it dropped right back to the lows. Very frustrating, 3 tags of the lows, and now take a look at this…
.
I Zoomed in to GOLD MAY 2019 – It popped from a downtrend line with a false break out (Bull Trap) and then dropped back to the lows then too. I see 3 tags at those lows. That was very frustrating, but what came next after 3 tags of the lows? 🙂 That was a Big Rally!
.
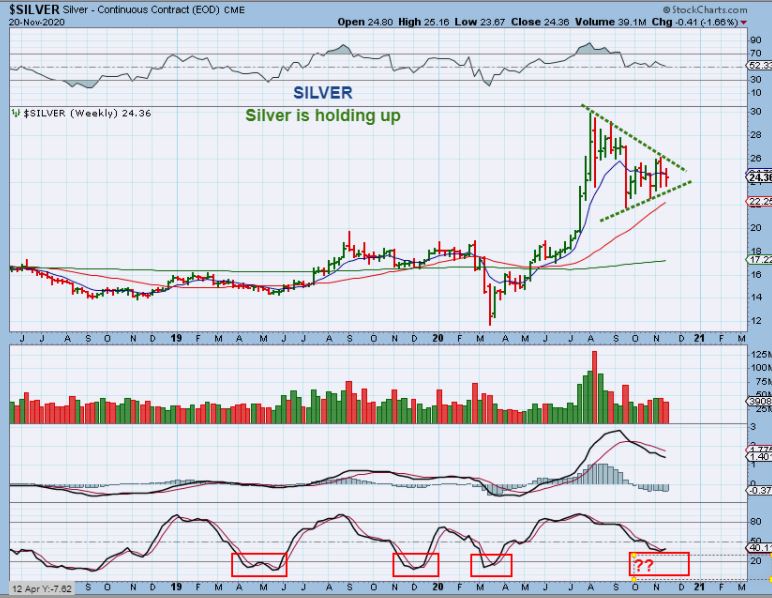
SILVER looks like a large Bull Pennant. If that Gold triple bottom is going to break out higher like Gold did in 2017, then Silver is ready to go too.
.
MINERS FAKE OUT? BEAR TRAP BREAK DOWN?
.
GDX -Broke below support last week and made new lows while Gold & Silver did not. That makes me wonder…
1. Are Miners leading the way lower and we will get 1 more drop with Gold & Silver too?
2. Or will this be a false break down below the red support line?
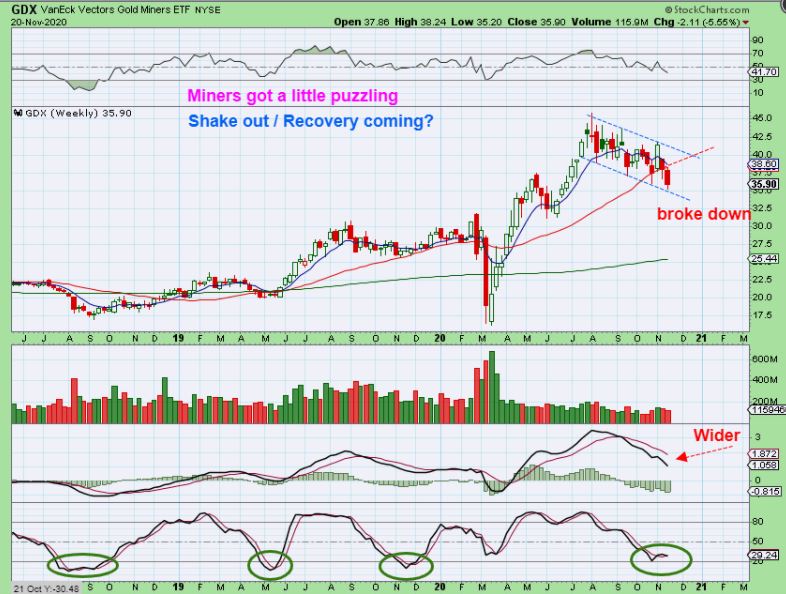
Unfortunately we need a little more time to know for sure.
.
– The General Markets have been bullish and remain so at this point, though a dip into a dcl could happen sooner than later.
.
– Oil & Oil Stocks bottomed and have been a rewarding buy for a little over 2 weeks. They are proving themselves nicely.
.
– The USD has been weak and is back at the lows, but it has divergence and looks as though it wants to move higher. THAT IS THE CONFUSING PART. The USD is at the lows and Miners broke to recent lows too. Gold is not at the highs, so the correlation between Gold & The USD may be lost again. Miners actually broke down to new lows as the USD stalled.
.
– GOLD, SILVER AND MINERS are overdue for an ICL. We are 8 months ahead of the MARCJ ICL, and they often come around 6 months or so. Things looked bad this week when Miners broke down to new lows. Larger companies with great earnings also started to break below their 200sma. The set up is confusing, but this week may clarify things. We just need more time.
.
Trading has been excellent for the short term traders, but we are STILL waiting for the real rally to begin with the Precious Metals Sector. At that time, the run should be powerful out of this consolidation. Maybe next week will give us stronger clues. Enjoy your weekend!
.
~ALEX
.
Some have had a hard time trading the EV, SOLAR, CLEAN ENERGY sector, because it can pop 20% higher one day, and then lose 10% the next, so this sector is NOT for everyone. Some may just want to take a trade or 2 in Oil for now.
We have absolutely been killing it with the EV, Clean Energy, and Solar trades over the past 2-3 weeks, So I just wanted to show you something here.
.
BLNK – I pointed BLNK out as a buy down around $9 at the 50sma. I said that I owned it. Now watch this…
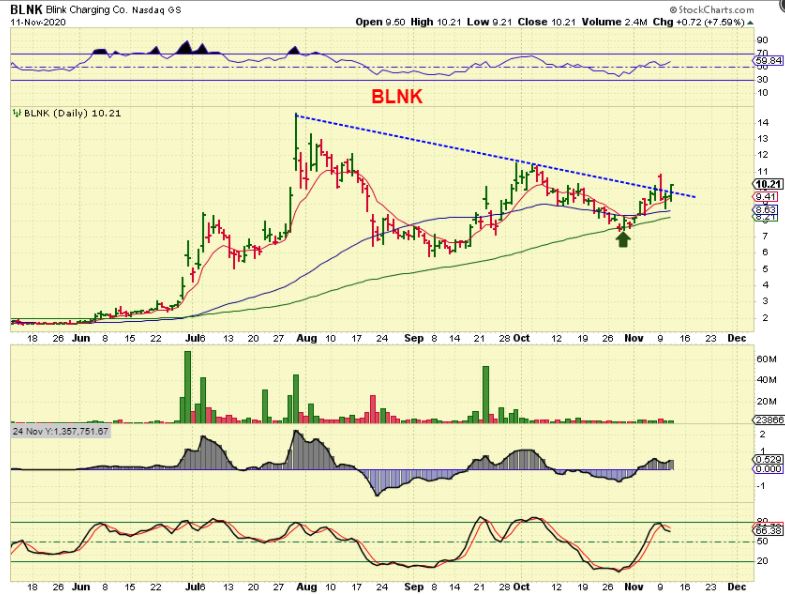
.
BLNK WEEKLY – Look carefully at the weekly chart. We saw an ENOURMOUS move in SOLO, PPSI, BLNK, etc., but look at the weekly triangle that formed on BLNK before this rocketed 133% last week alone. STARE AT THE TRIANGLE.
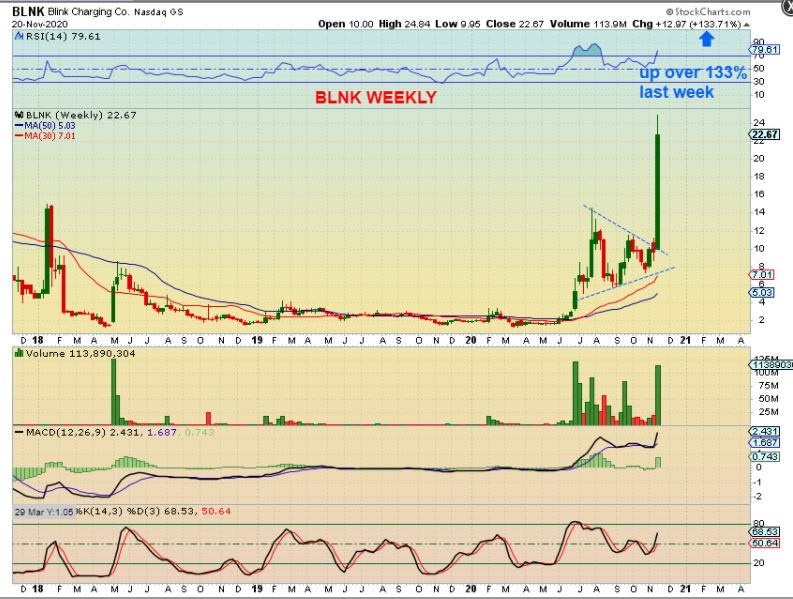
.
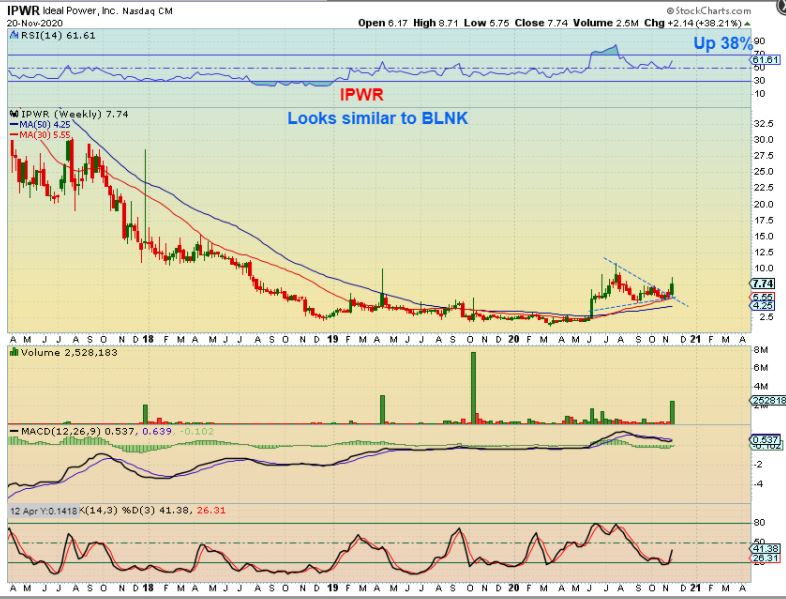
IPWR – Now look at the IPWR Weekly chart. This was also a buy in my reports this week and it broke out. It was up 38% last week, but is it done? Scroll up at BLNK again and you have to admit that this looks a lot like BLNK before the explosion, right? We’ll see if it gets further upside next week. It is ‘oversold’.
.
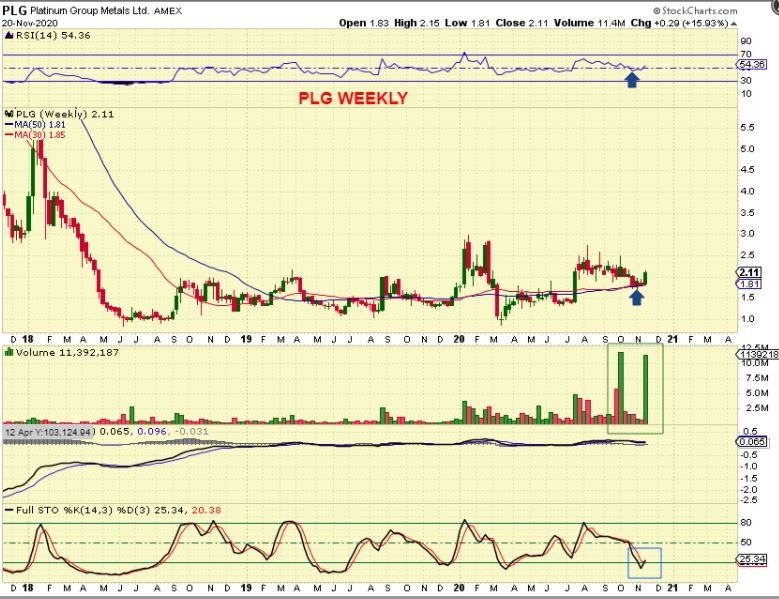
THE PLG WEEKLY & DAILY CHART is Bullish, I bought it Friday after we had discussions in the live area about it.
Mark & Rob had discussed that Platinum itself looks to be ahead of Gold on Thursday and at that point I noticed the volume in PLG was showing up as bullish.
Then Code name ‘SOG’ mentioned PLG in the final hr of trading Friday and I looked and bought it then. It is a BUY Monday and the weekly is Very Promising. PLG is at $2ish and a run to $4 should be easy.
.
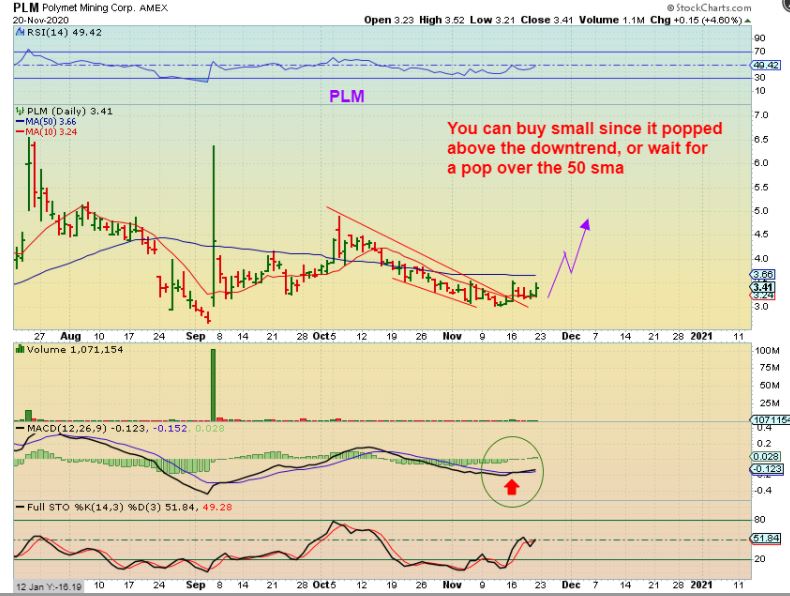
ALSO code name Ombibulous 🙂 mentioned PLM this week and I think that it is a buy too. Read the chart and thanks to everyone everyday for the extra pairs of eyes in the live commenting area.