Wednesday November 18th – Still Running
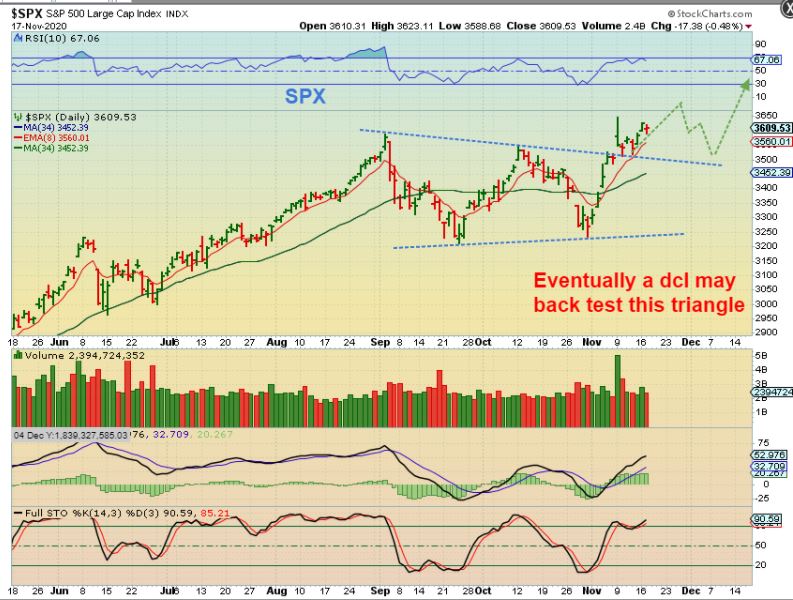
THE SPX lost 17 points but it is a mild dip and looks normal. I can see this going higher and then eventually dipping into a dcl, but for now the General Markets remain Bullish.
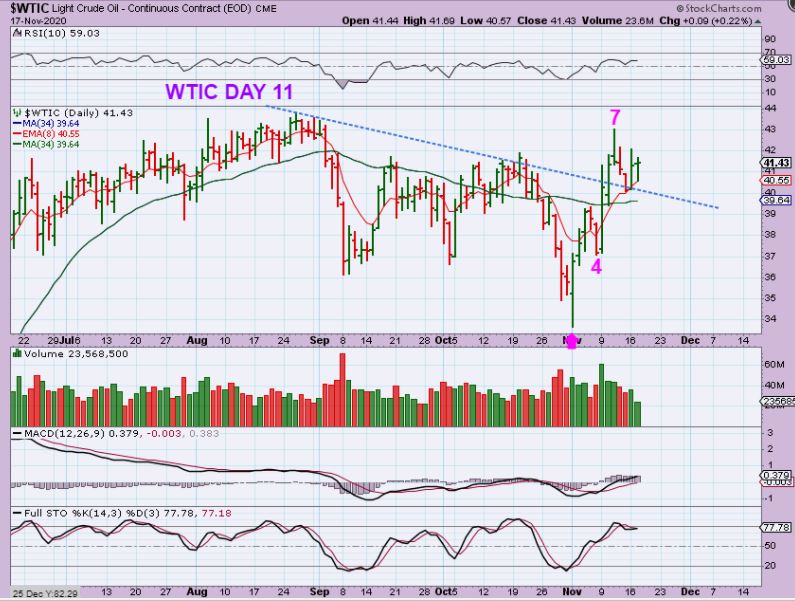
WTIC – Oil dropped and reversed off of the 8 ema yesterday and this sector has been bullish too.
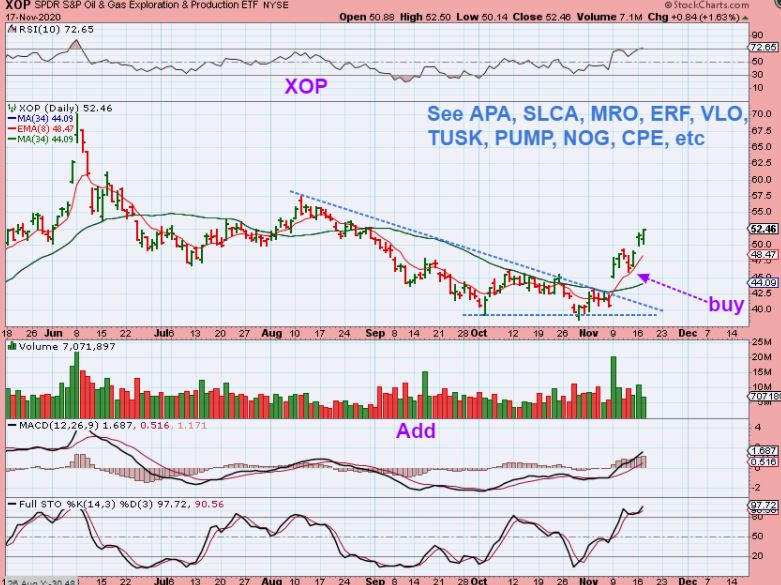
THE XOP just gapped up higher again after dipping to the 10sma . These Gaps are making it very hard for Buyers to comfortably enter a position. The Oil stocks that I have been mentioning are all doing very well. Oil stocks are running away out of the lows.
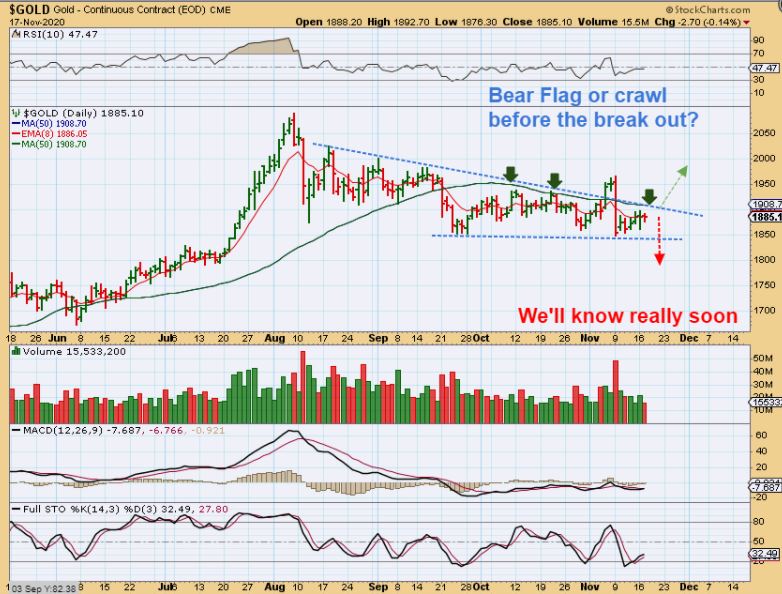
GOLD – We are looking for an ICL amidst this 4 months of sideways chopping. Is this a Bull Flag? Or can this break out leaving the lows behind? We are entering an apex, so we will soon find out.
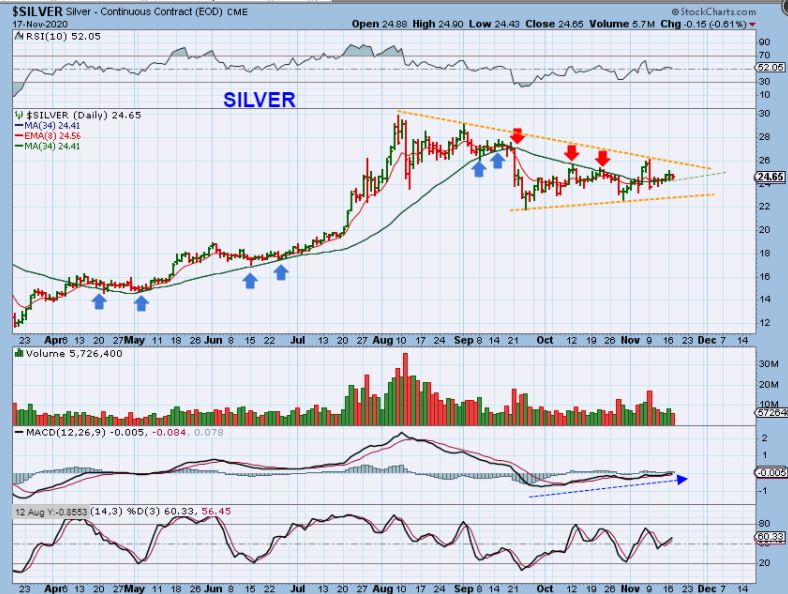
SILVER actually looks good. Notice how the MACD is rising along with the price chop. The arrows here are pointing out how Silver finds support along the 34 sma and it is above that line now. The problem is Miners…
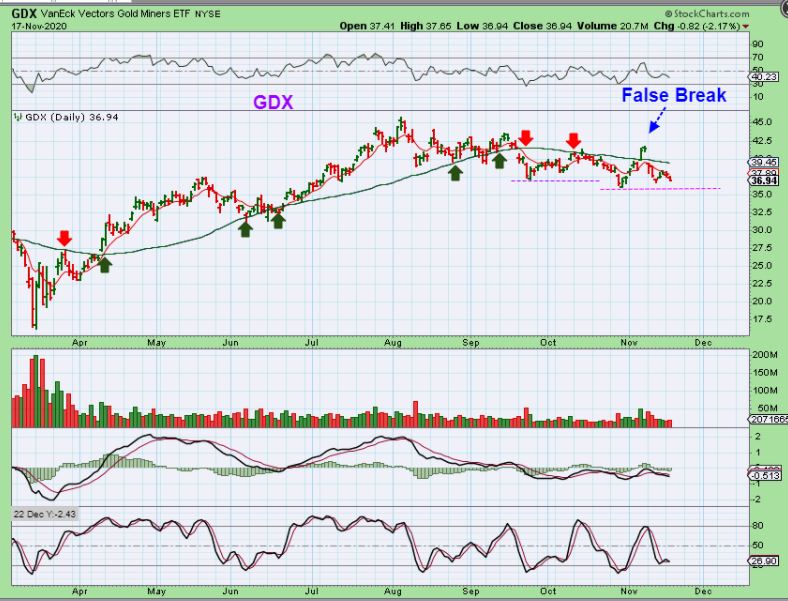
THE GDX is also chopping sideways but the MACD is choppy, price is again trapped under a major moving average after a false break out and the RSI is weak. Miners do look weak.
.
Let’s just do a close up ‘Gold review’ using this LIVE GOLD CHART from 6 a.m. Eastern Time: This will show what part of the dilemma is .
.
I took a close look at GOLD SPOT again and it has started to dip lower this morning. In this close up snapshot the lowest low on the last daily cycle was day 33 by a few pennies (Not day 31). Then counting forward we see that the current day 30 was both the high and the low of this current daily cycle. That is very odd since that would make it a right translated daily cycle. We would usually need the ICL to be in place before we see a higher high R.T. Daily Cycle. So that still raises Questions:
1. Was that day 33 the ICL as first suspected and verified as the trend line was broken? That is THE LOW so far.
2. Is this a long first daily cycle that is just running sideways and driving everyone crazy?
3. Or…Can this be day 37 and an ICL drop is next, breaking all of the lows?
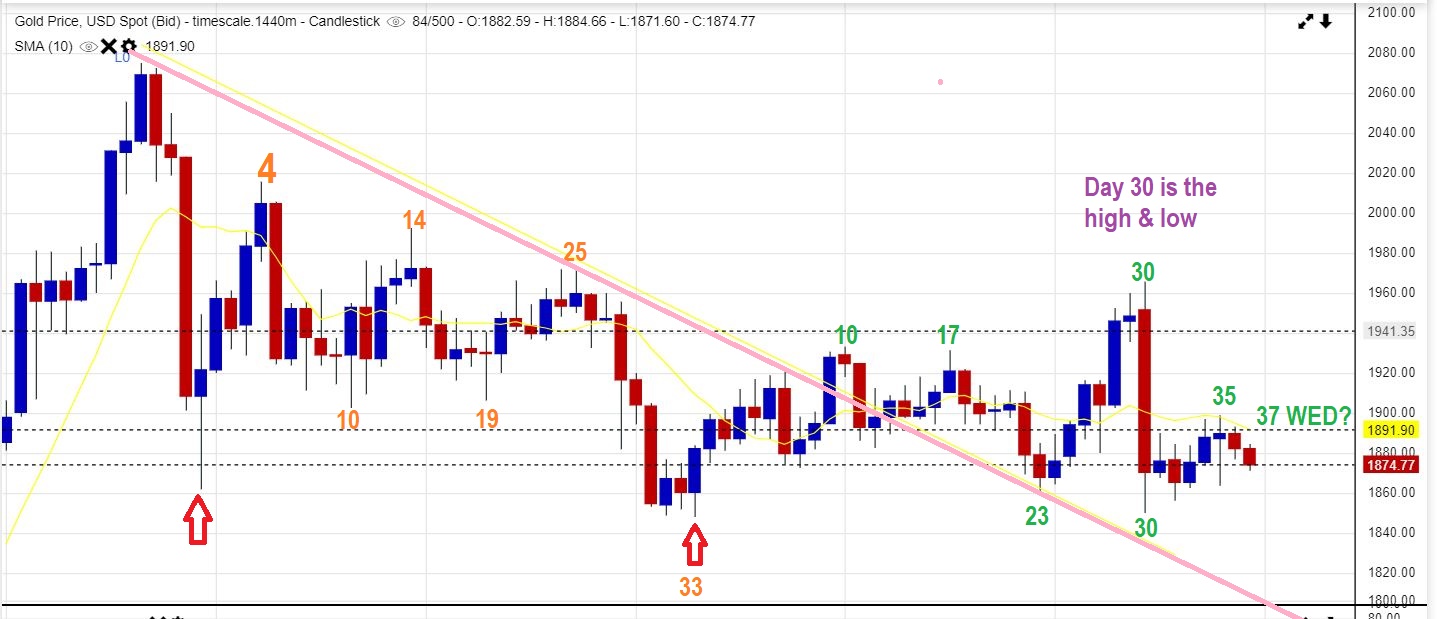
You can see how the day 30 candle really distorts the cycles picture. That candle is making this right translated and also represents the High and the Low of the Current Daily cycle (so far). It would seem that that day 30 low needs to be broken, and if it is broken along with that past day 33, then the ICL is still ahead. If the high of day 30 is broken instead, the ICL was that prior day 33 low and this is just one Very LONG sideways first daily cycle. I hate to say it, but due to that odd day 30 candle, we need more time to know for sure. Below I will discuss a few of the current trades again, since questions are coming in.
.
Enjoy your Wednesday trading.
.
~ALEX
.
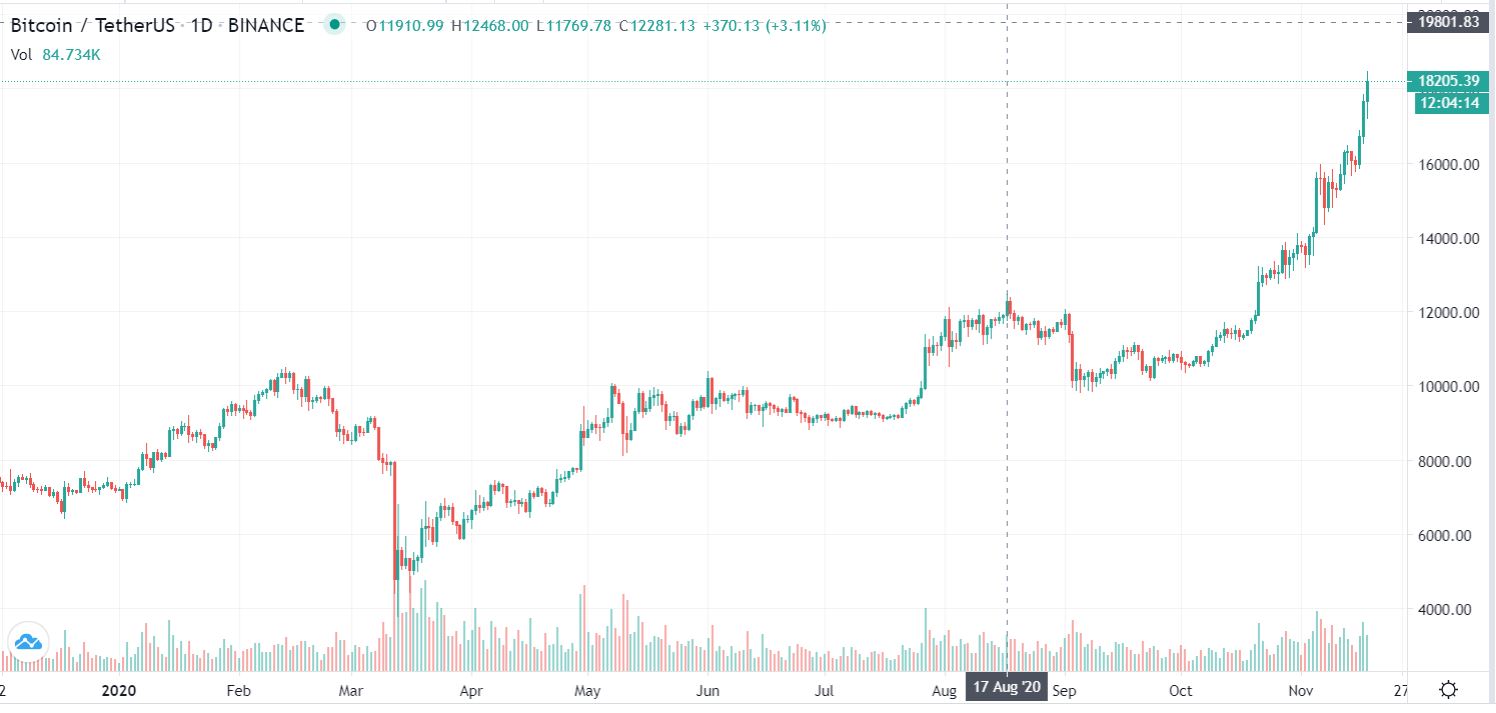
NOTE: BITCOIN hit 18,200 this morning. It is running very strongly and that can boost RIOT & MARA and a few of the other blockchain trades.
.
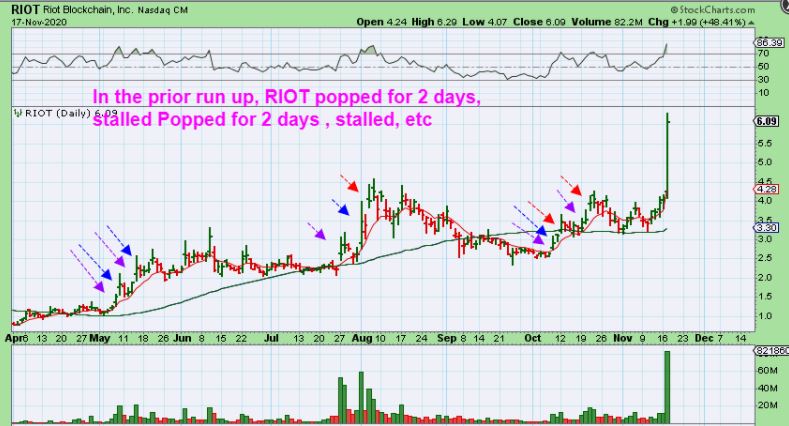
We discussed these little Rocket Ships blasting off and I added a few to the report yesterday ( RIOT, MARA, NETE, etc). RIOT shot up 20%, and then 30%, and then 40% and 50%. Now I am being asked, “Where will you sell them? Where will this run top out? How high can this go?”
I have answered these questions in past reports and nothing has changed. You need to sell some on the way up or just lock in big gains when they pop 20-50% and walk away happy, but the choice is yours. In yesterdays report I even showed an example: CBAT and showed how it ran Big for a few days, while other rockets just Pop and drop in 1 or 2 days. It’s like that old game of musical chairs- you want to lock in money before the music stops. I have showed how to do this in the past. Maybe sell 20% at first and then let it ride another day. You can then sell another 25 % , etc . Or sell 1/2 on day 1 and the other 1/2 on day two? Or just sell the entire pop and move on? Or let it run until you see how it pulls back. Really it is YOUR choice. I will review a few of those stocks though…
.
YESTERDAY I WROTE : NETE – Nete has an Electric Vehicle too, but the earnings release Monday morning caused it to drop during yesterdays excitement. To be honest, this drop looked mild so I posted this in the live area as it dipped to $7.25. It closed higher at $7.35 and volume was very light, so this might run later this week. Big potential can be seen on the chart, I own it.
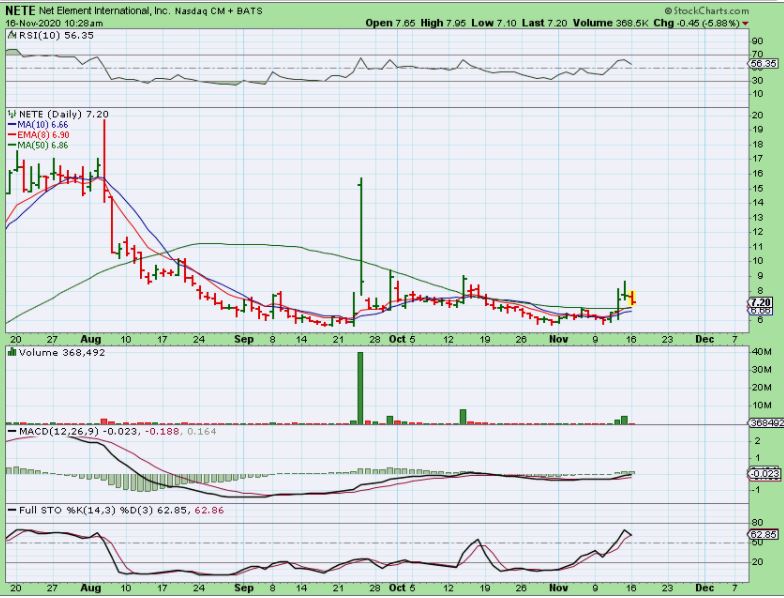
NETE did Pop Tuesday and was up 25%. If you are happy with 25% gains, sell it and walk away, but I honestly think that this base can keep price going higher over time. WILL IT DROP WEDNESDAY? Maybe, maybe not.
Take a look at the pop last week above the 50sma.That was a 10% pop and then a 14%pop and then the back test of the 50sma. Now we have a 25% Pop and this can run or bull flag and tag that 10sma again. 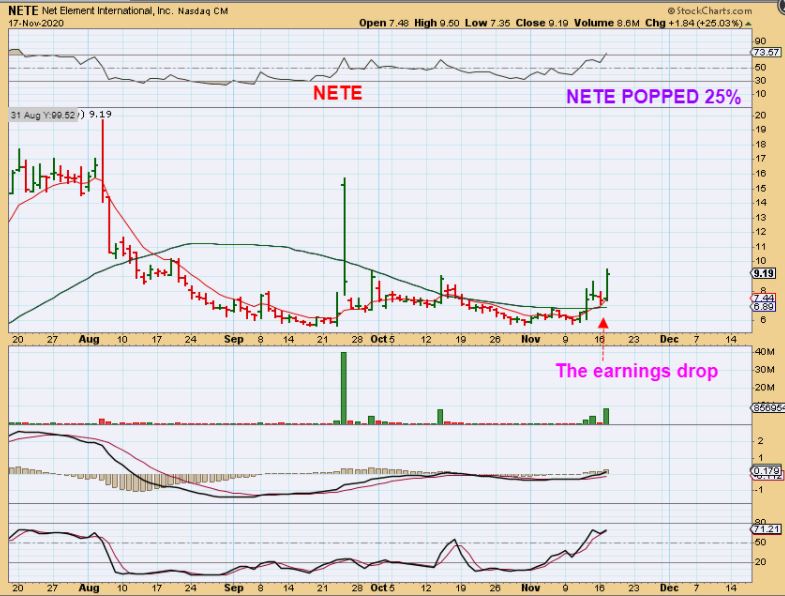
EVENTUALLY this NETE stock could get back up to the former highs. How you play this is up to you. You have 25% gains if you bought when I said to so now you must handle the trade because I cannot cover these day after day. I will need to also cover other stocks.
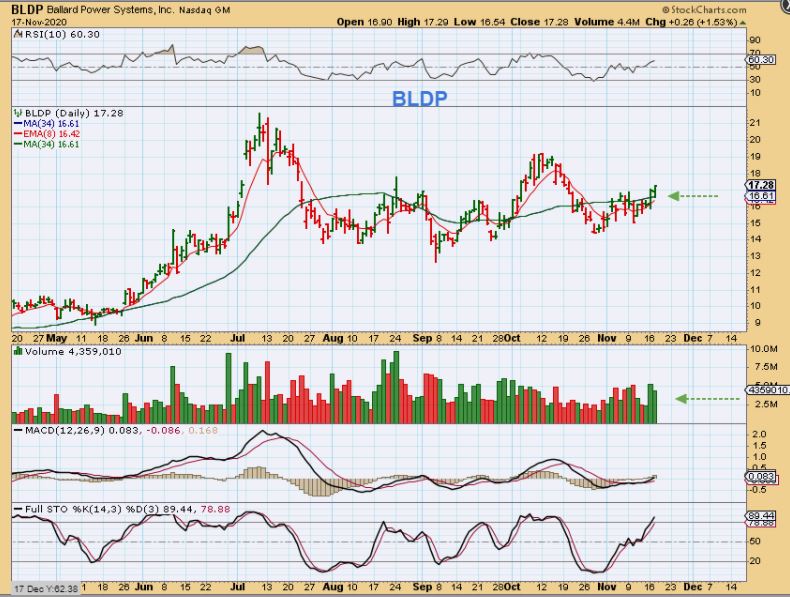
BLDP was in yesterdays report and has increasing volume as it SLOWLY climbs higher. This is still a buy as it closed above that 34 sma. It hasn’t made the Massive POP, but it is slowly making gains.
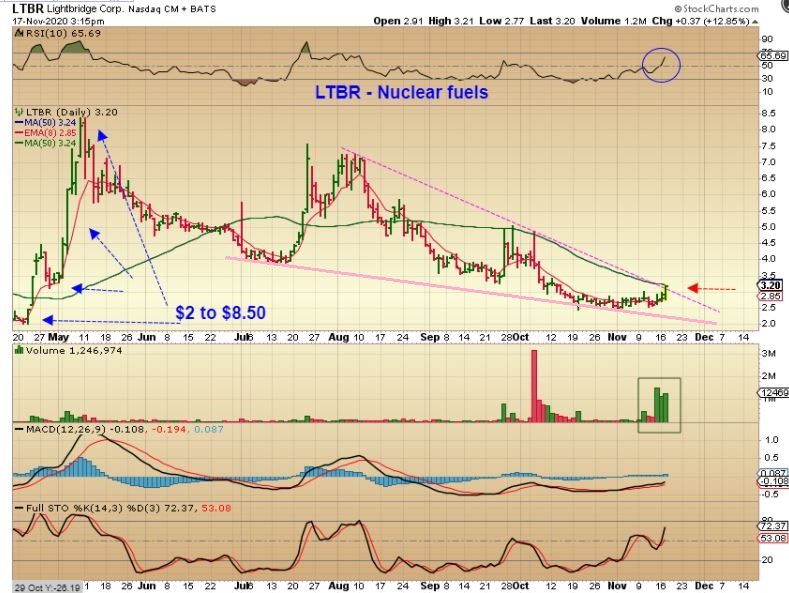
LTBR is new in this report. I was watching it rise up & now it is pushing on the 50sma. I am drawing a downtrend line as the volume surges well above the average. I VIEW THIS AS BULLISH. Look at the RSI and price has hardly climbed higher? I think that this one can break out and run too. You can wait for confirmation and buy the break out or buy it here and use a stop.
YESTERDAY MARA WAS IN THE REPORT WITH RIOT. I wrote that MARA really has some nice upside potential as it breaks above the 50sma and bounced off of it a few times. It is a bullish set up. I bought starters in both RIOT & MARA and added yesterday.
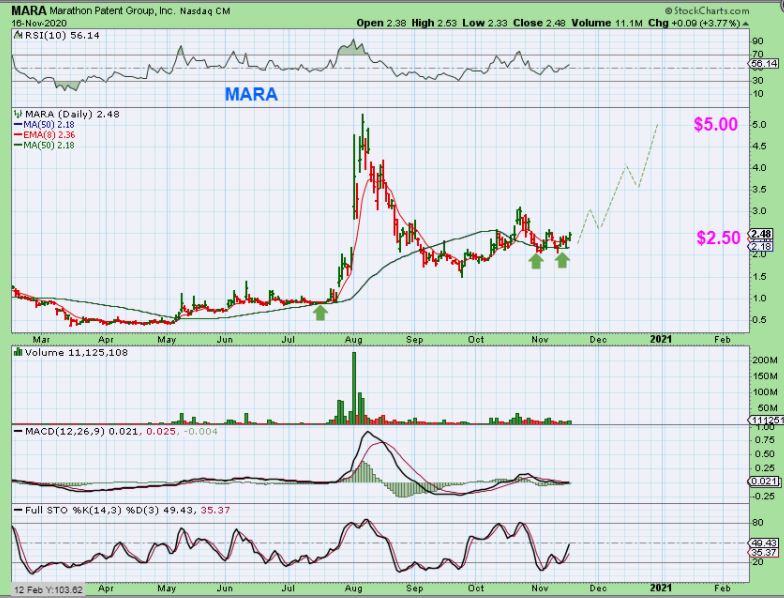
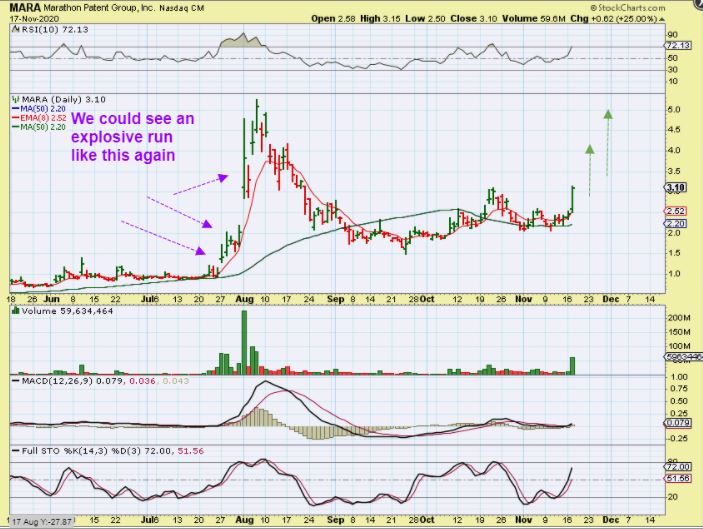
MARA popped 25%, but I didn’t sell it because in the past this one ran for a few days. This MIGHT do as CBAT has done with a few big Days in a row. Also if you step back…
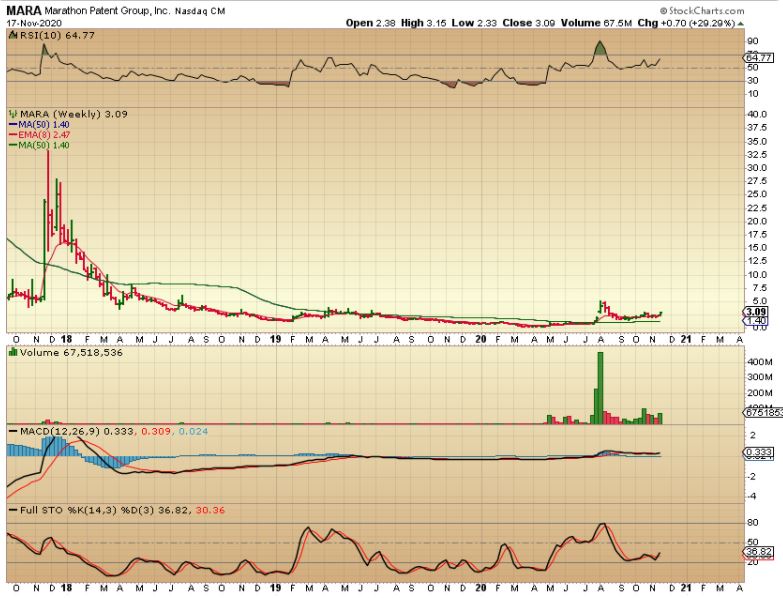
THE WEEKLY MARA BIG PICTURE makes that 29% Pop for the week look tiny, so there is potential for this to continue higher over time. I’m not saying that this will just run straight up, but this weekly volume only represents 2 days and this chart indicates that MARA is still oversold! I would say that MARA can run higher before another consolidation takes over.
.
WHOA! RIOT actually popped 50% yesterday. You could just sell and walk away since we could see a drop, but in the past we have seen 2 or 3 days in a row higher. This could even drop for a few days and Then continue higher, we saw that in the past too. AND…
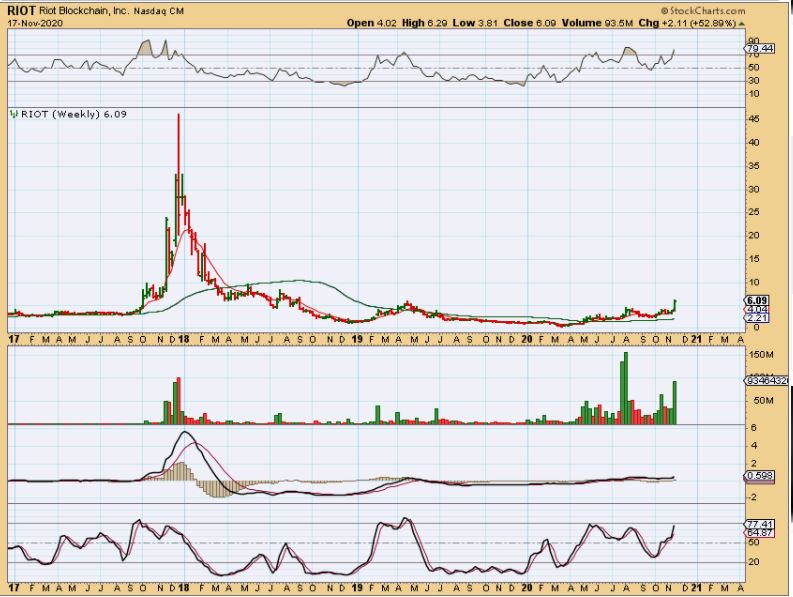
RIOT WEEKLY – RIOT actually popped up 52% this week so far and this weekly chart represents only 2 days of volume for the week too. So this ‘Might’ keep running and has lots of potential, but I sold a little just to lock in gains.
.
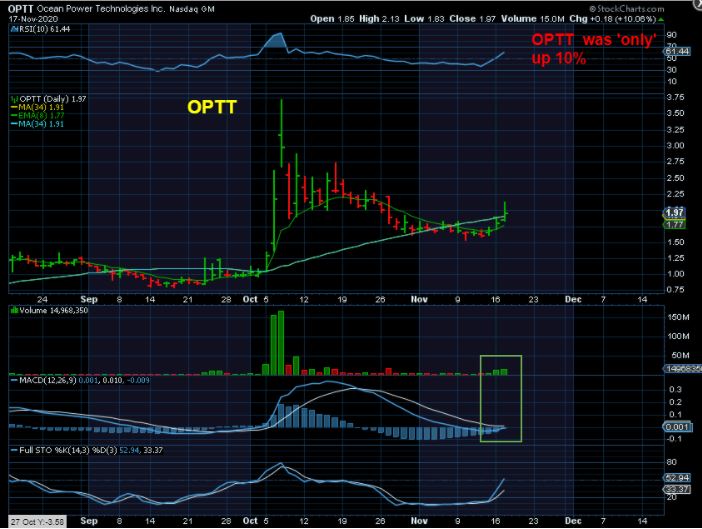
Yesterday I pointed out OPTT as another potential runner. I love that OPTT moved up another 10% and people were disappointed. 🙂 I was asked why my “OPTT pick is acting so weak?” I like a slow steady climb too, because it can just keep going up 10% each day without a strong reaction lower. This is still a bullish set up and this can run higher.
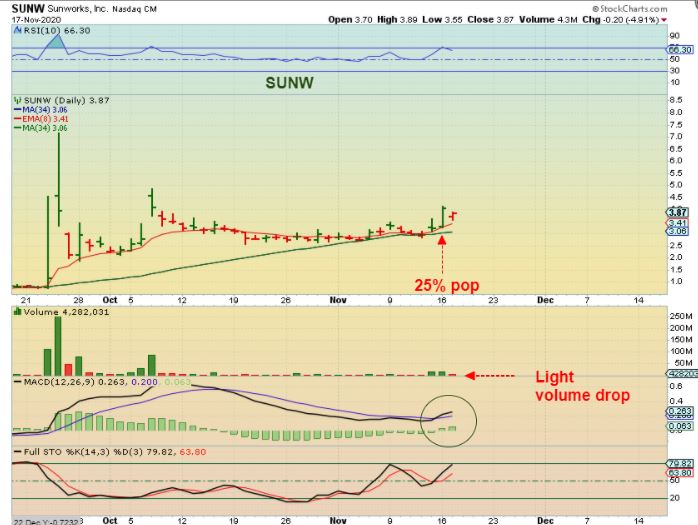
SUNW popped 25% Monday and then dropped on Tuesday. It was down 12% in the morning, but recovered as the day went on and landed only down 5%. I think that SUNW has more upside left in it too. SUNW is likely taking a rest after a 25% Pop, but I wouldn’t be surprised to see this higher over time. Solar stocks have been great!
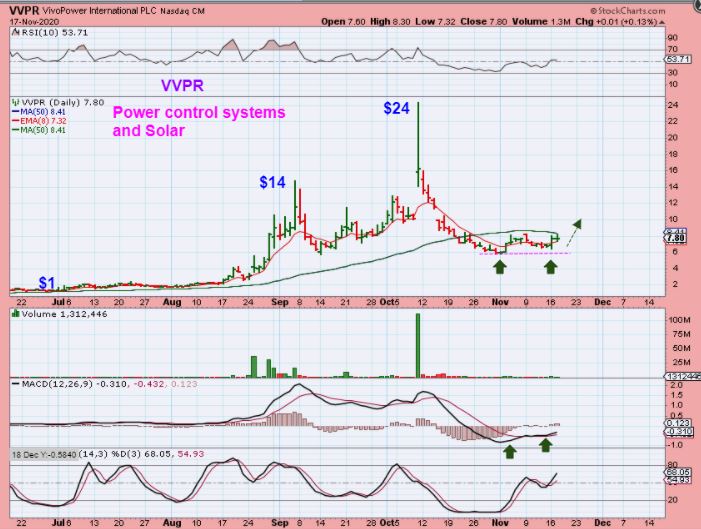
VVPR- I traded this one and made fast gains when I did. It looks like it may be ready to go again. I do not own it yet, I was just watching how it has been acting and I like it. I may buy a break out above this 50sma. Read the chart.