
November 14th Weekend Review
Monday we experienced a rough ride from our infamously tough Golden Bull, so I focused on that in a special Precious Metals report on Tuesday. That was followed by a week that did have some nice ‘trades’ in it, especially with the EV / Battery companies and the oil stocks if you entered those trades. By the end of the week however, we see that the various Market Sectors still just gave us another week of choppy sideways trading. That kind of price action keeps those waiting for a nice trending move higher (or lower) frustrated, but what happens when the choppiness comes to an end? In a bull market, this sideways choppy price action builds up energy for the next run higher and it will then run for weeks. We are waiting for a break out with follow through in the Precious Metals Market and we are close. Let’s review our markets.
.
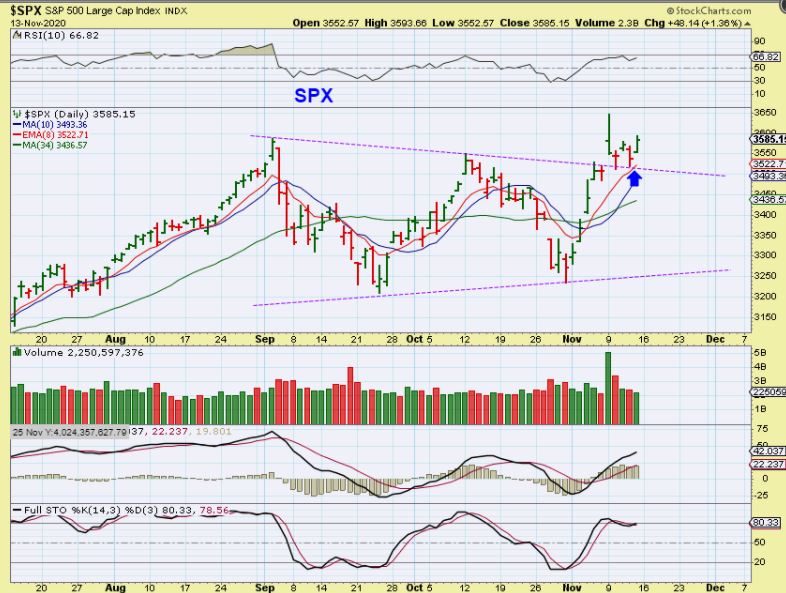
SPX DAILY – The S&P 500 broke out from a W-Pattern or triangle type of consolidation. It has back tested as expected and can continue higher, but I wanted to show you this daily chart because the weekly chart is questionable in the short term…
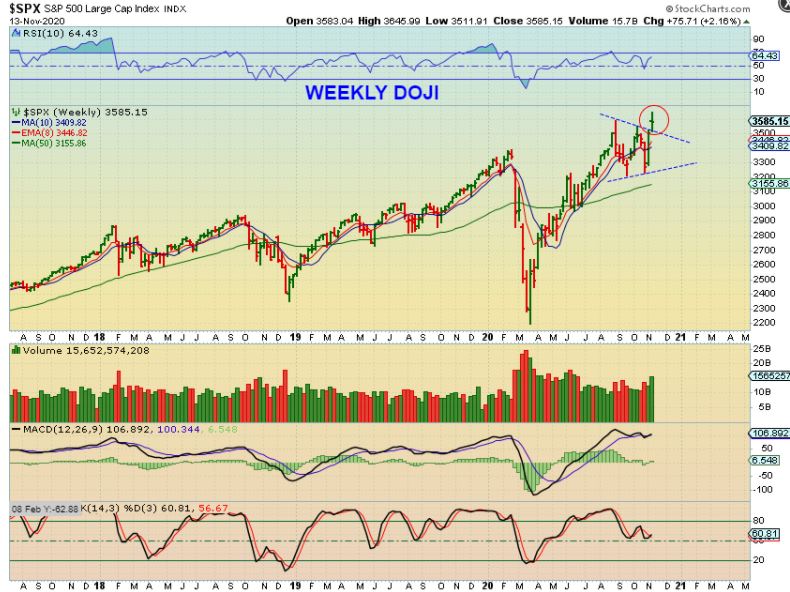
SPX WEEKLY – The weekly chart formed a Doji star and they are considered to be candles of indecision. At the top or bottom of a run they can also be reversal candles, so it is conceivable that price sells off or maybe simply rides down the triangle for a week or two giving us some chop during the uncertain times that we are living in.
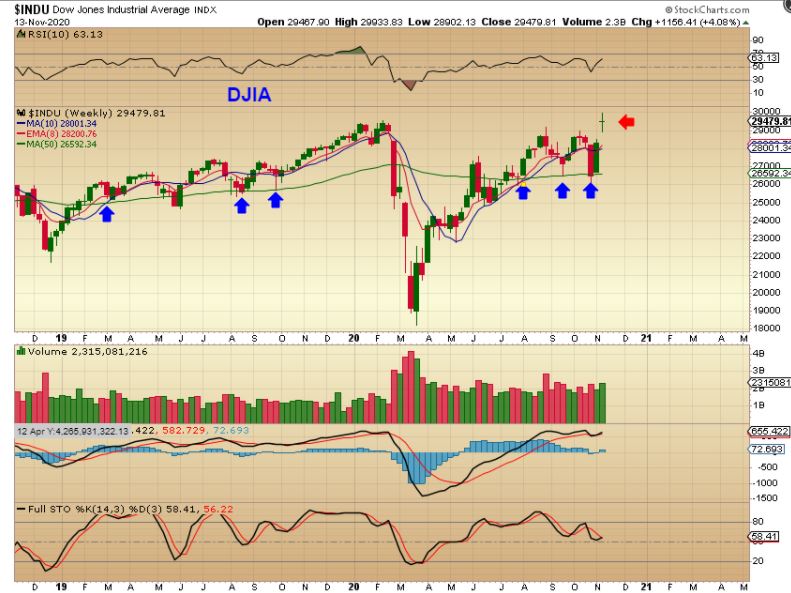
The DJIA also has a Doji that Gapped open higher. This can be bad if we gap down Monday, because abandoning a doji star in midair is usually quite bearish, so we need to watch the General markets next week and I’ll be watching to see how they open on Monday.
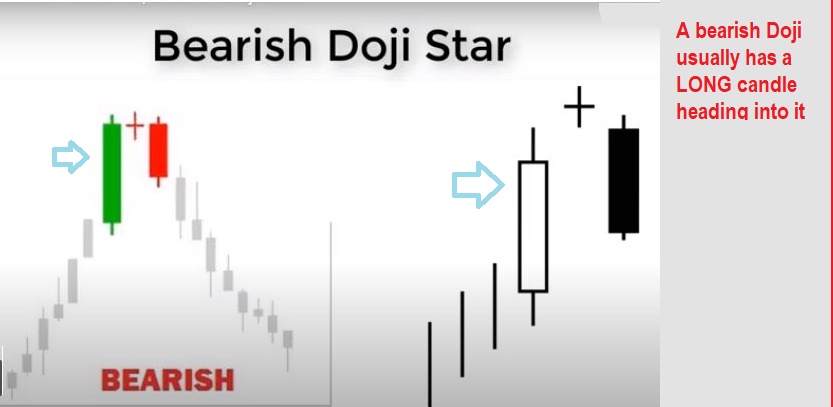
To help reduce any major concerns: I want to point out that for me, a true reliable Bearish Doji Star often forms at the top of a long bull run as an exhaustion move, as seen below. You can see that it is more of an exhaustion move after a long run, and to me that would make it more reliable. Right now ours came after a sideways move and I view that as Less Bearish, but it still can lead to a ‘pause’. We’ll see.
.
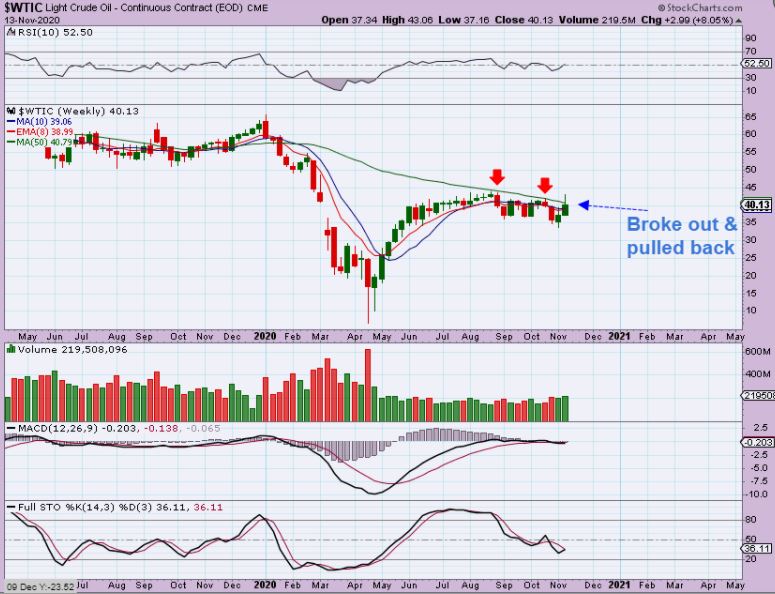
WTIC WEEKLY – Oil did a false break out similar to what we saw with Gold a week ago. It broke above the 50 week ma and then pulled back. Volume is good and it remains oversold on a weekly, Oil still has a good chance of making progress, but it has been sideways, very choppy, and frustrating so far.
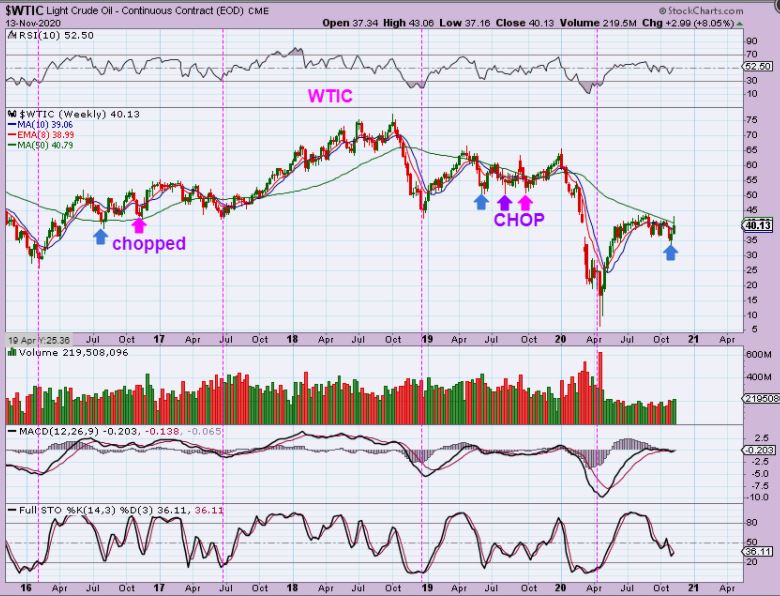
WTIC THE BIGGER PICTURE – So I always go back to the bigger picture to point this out:
I have seen a rocket out of the ICL (lows) that suddenly just levels off and chops sideways. We have been seeing that this time too, and if Oil prices are not going to get more expensive, that is what we’ll continue to see.
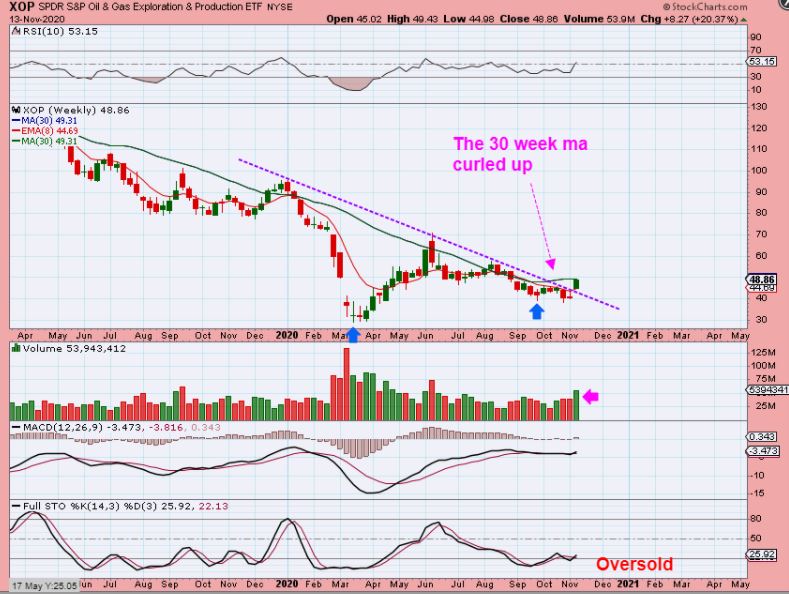
The XOP – Oil stocks started to look good as mentioned last week, and I ever since I said that they looked like a buy they continue to improve. I am even seeing the major 30 week MA start to curl up, which is a bullish sign. Now take note of this: Since mentioning that this sector looked bullish last week…
1. The Volume increased
2. The MACD and RSI are curling up with the 30ma and
3. The XOP was actually up 20% alone! GUSH (leverage Oil & Gas) was up 41%.
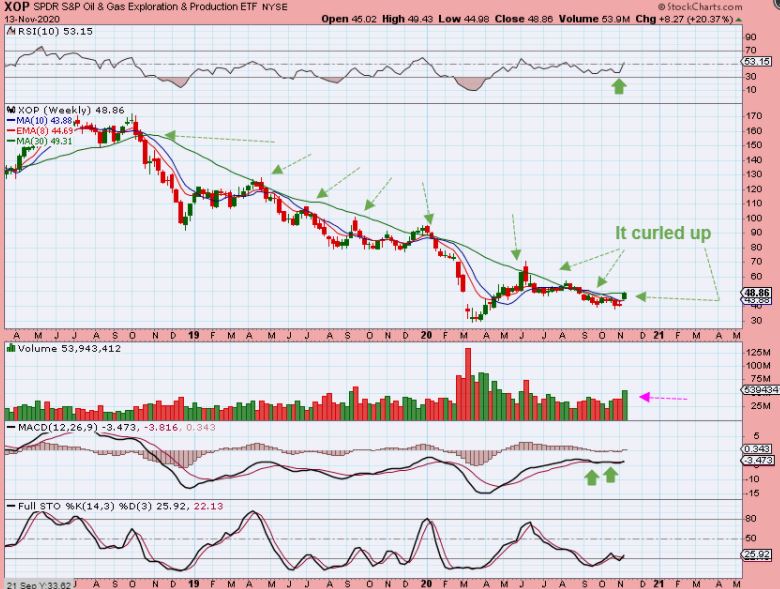
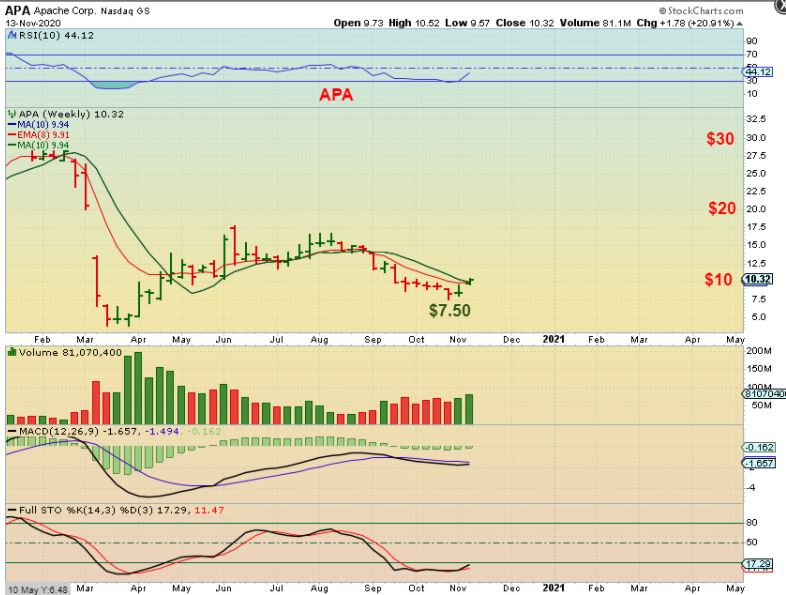
THE XOP also gapped over that down trend line that I have been drawing, and it still remains quite oversold on a weekly basis. As noted, Oil stocks are setting up at the lows and I have mentioned examples like MRO, AROC, VLO, ERF, APA, LPI, CPE, , etc.
.
HIGHER LOWS, DOUBLE BOTTOM
.
APA has moved from $7.50 to $10.50 ( 40%) and was up 20% alone this week too as volume increased. These remain very oversold and should also have plenty of upside if the sector remains bullish. ERF was up 35% , but gave some back closing up 22%, VLO was up 33% and MRO was up 22% , LPI was up 20%, etc. I mentioned that I took a couple of these trades ( Like ERF & APA and I removed my leverage from the Miners and cut my position size in some now that we returned to the sideways chop there).
.
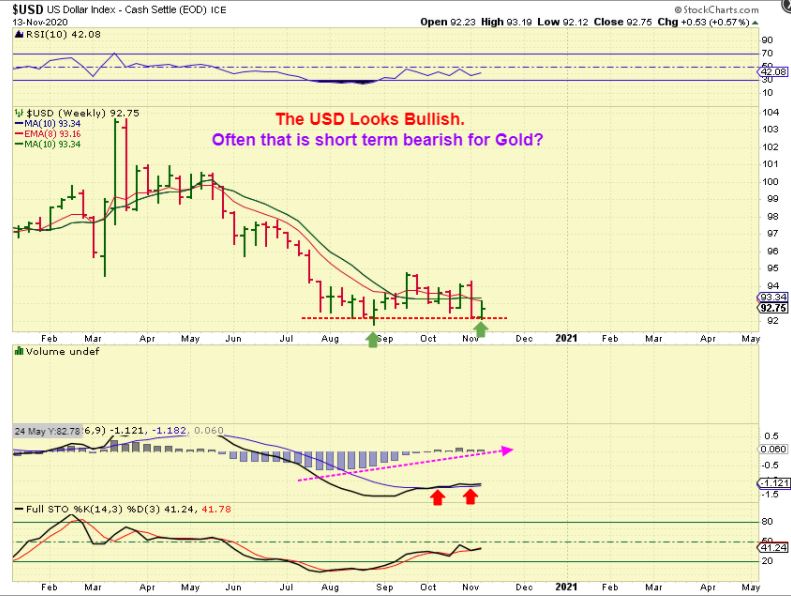
USD WEEKLY –I find that the USD Weekly is looking Bullish here at this double bottom ( Icl & Dcl?). That would concern me a little bit, since Gold often drops when the USD Pops. The USD Weekly looks bullish, but there’s a chance that it’ll just keep chopping sideways at the lows (like Oil & XOP did) and allow Gold to run higher. Why?
The Weekly chart looks bullish, but The Daily chart gives a slightly more bearish picture ( a Mixed picture here).
.
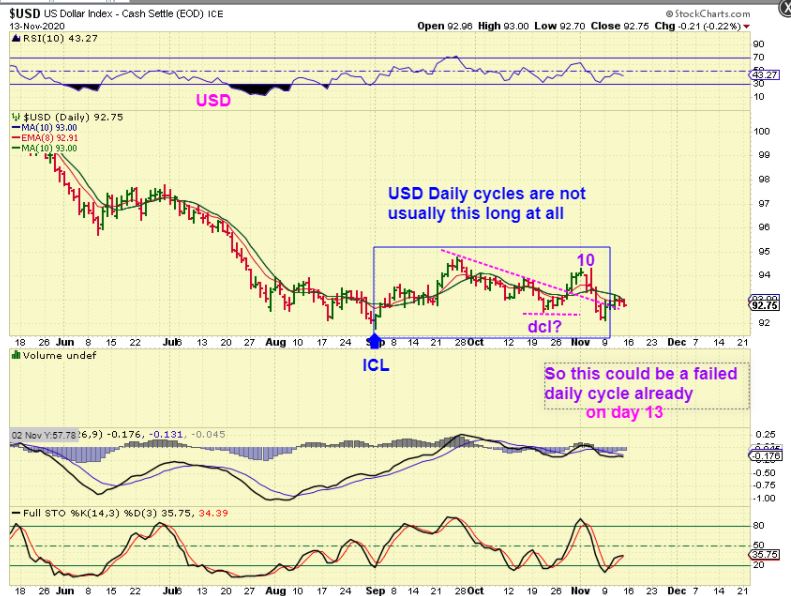
USD DAILY : A daily cycle for the USD is often 20 something days, so I put the DCL as the reversal in October. THIS WAS A LONG DAILY CYCLE AS IT IS. It then rallied for 10 days and has now crashed below that dcl. THAT should be a failure and would signal that the USD cannot rally. So with the Bullish looking weekly chart, this daily looks to have failed. We could chop sideways as this daily chart chops around & eventually rolls over, allowing Gold to rally.
.
Let me say this: I just cannot see how the ICL from Sept 1 didn’t already put in a DCL. Is the current low possibly the dcl? That would make it over 2 months from the ICL. We must have an ICL on Sept 1 and now a failed daily cycle here too. I think that this is drawn correctly, despite the bullish looking weekly chart. This might just chop lower allowing Gold to run higher.
.
The Precious Metals popped a week ago at the Fed Meeting, at the same time that the USD broke the dcl. Then suddenly Gold dropped back inside of that consolidation zone on Monday, so
1. I wrote an entire report showing that we are simply now back inside of that choppy consolidation.
2. My report mentioned that we saw a false break out or a ‘Bull Trap’, so I then admonished that we might want to re-consider how we are positioned again.
3. As a trader, I cut leverage and position size in this sector again as a way to reduce risk as mentioned ( and I added to Oil trades and EV/Battery trades).
.
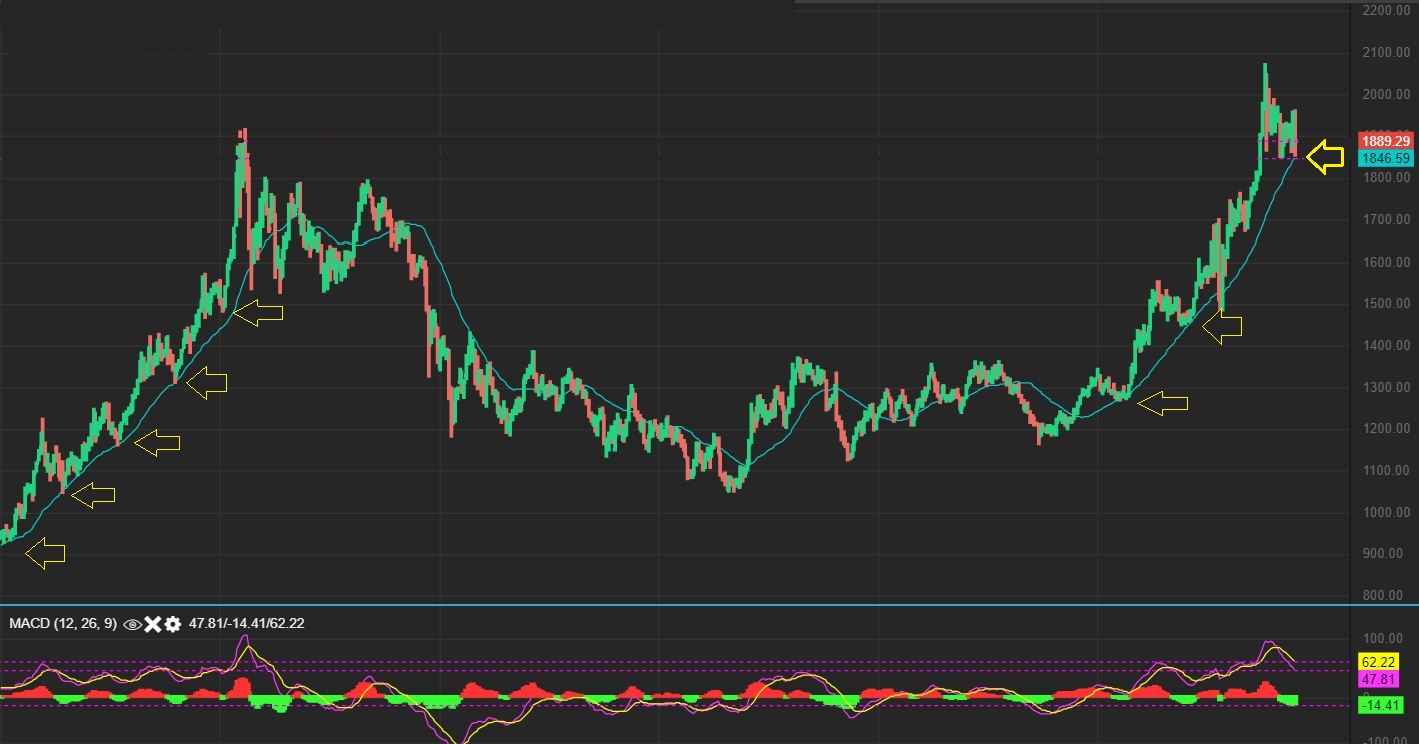
GOLD – We finally tagged the 30 week ma this week! That is good news. This is actually something that I have been pointing out as a plausible target for months, so even with the frustrating choppy sideways move, we are now seeing expectations play out bullishly. We MUST be close to the real break out. We also reached oversold, another thing that I have pointed out over time.
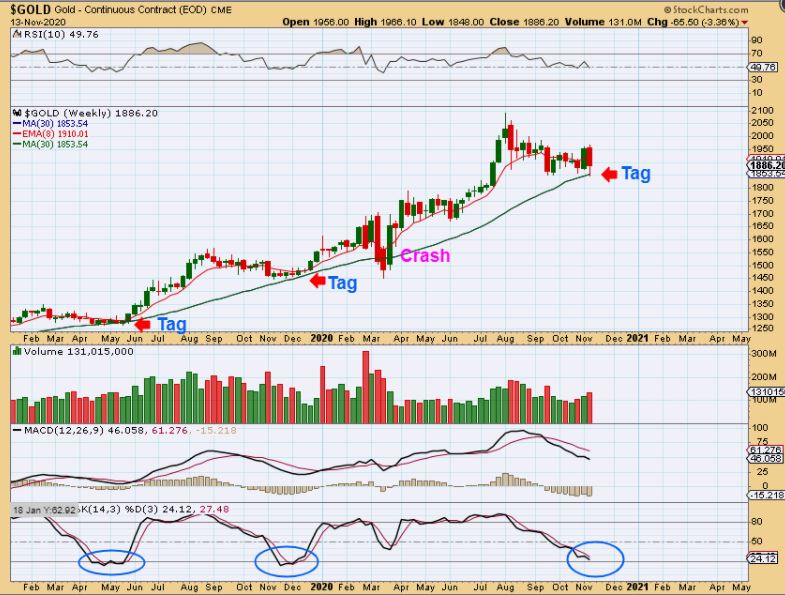
LOOK AT THE DATE ON THIS OLDER CHART: WAY BACK IN JANUARY I was pointing out that even in a Bull Run, we have to expect these pull backs to the red line. I pointed out the importance of that ICL dip down to the red line, and we have been waiting for that now too.
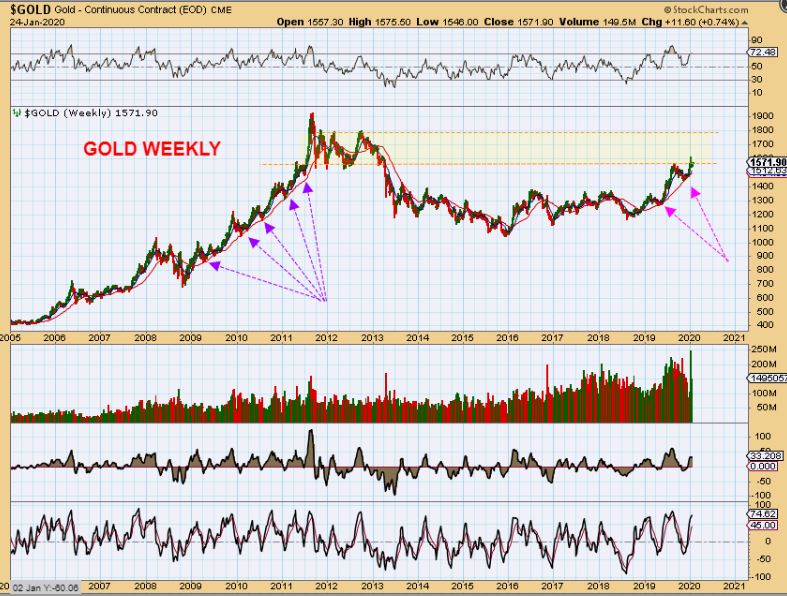
GOLD: And here we are finally reaching that important area. Now we wait for the reversal & true break out with follow through. Last week was a false break out, to shake off some bulls, but this helps us to see that we are close.
.
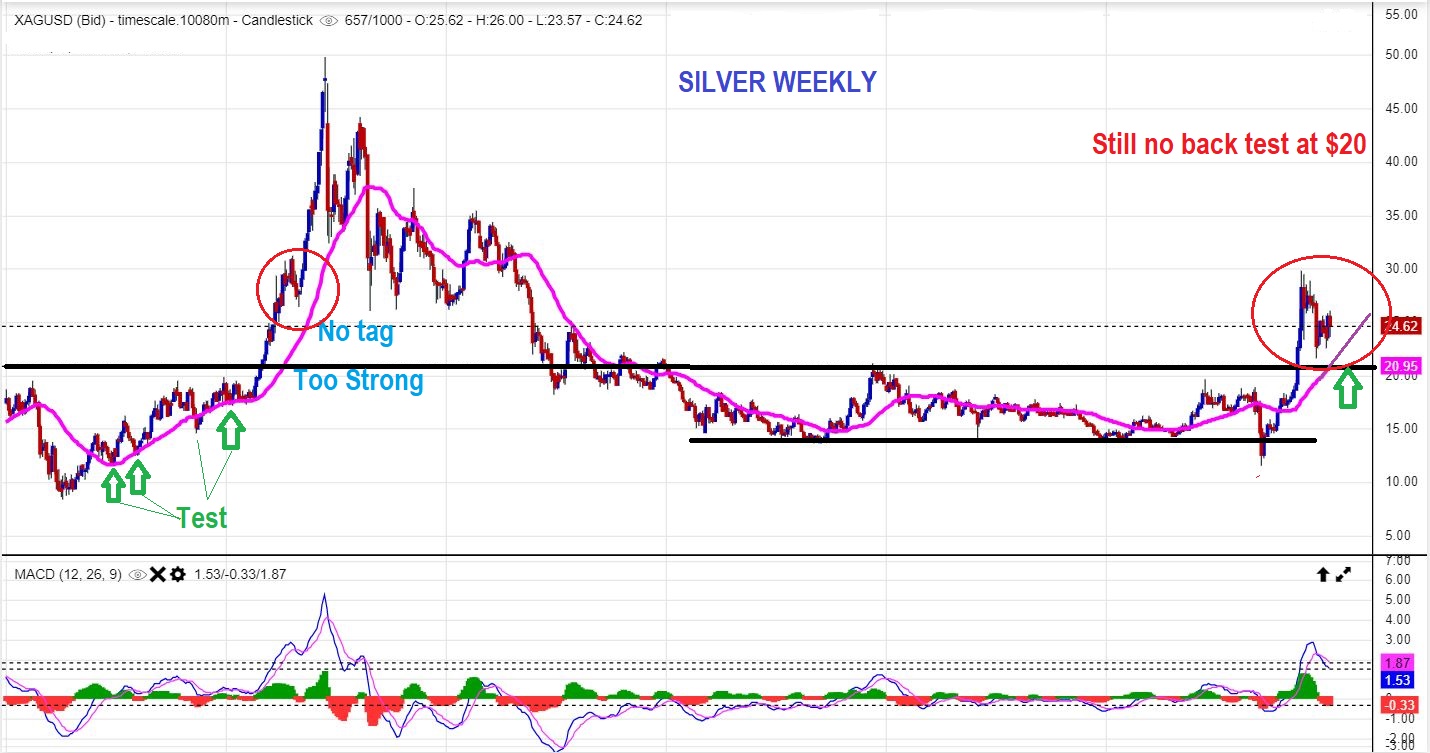
SILVER WEEKLY – Yes, we could see a break out from here and I actually thought we did see one a week ago with that Fed Meeting, but can I be honest? Doesn’t this Still looks like it could drop to $20? Gold looks fine, but to my eyes this looks like it could drop. Look at the Magenta line on the left side of the chart. Price dropped there often and now? I’m not going to tell the markets what to do, and if you look at Silver in the Red circle on the left, it did NOT tag the Magenta line. This may be enough if the sector is ready to go.
.
SILVER dropping down would still form a normal a-b-c drop and it would tag the 30 week ma too. Silver also never got oversold. Basically Silver & Silver stocks have been looking stronger and I own a few Silver stocks, but this chart still looks like it could go either way. THAT SAID…
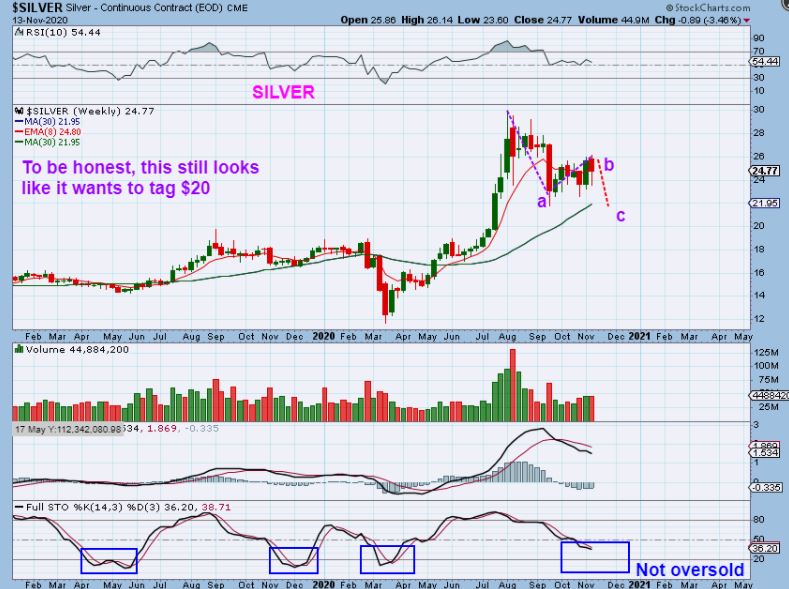
That said, The Silver Chart above still looks like it could go either way. Even so, The Miners do look like they have sold off enough.
.
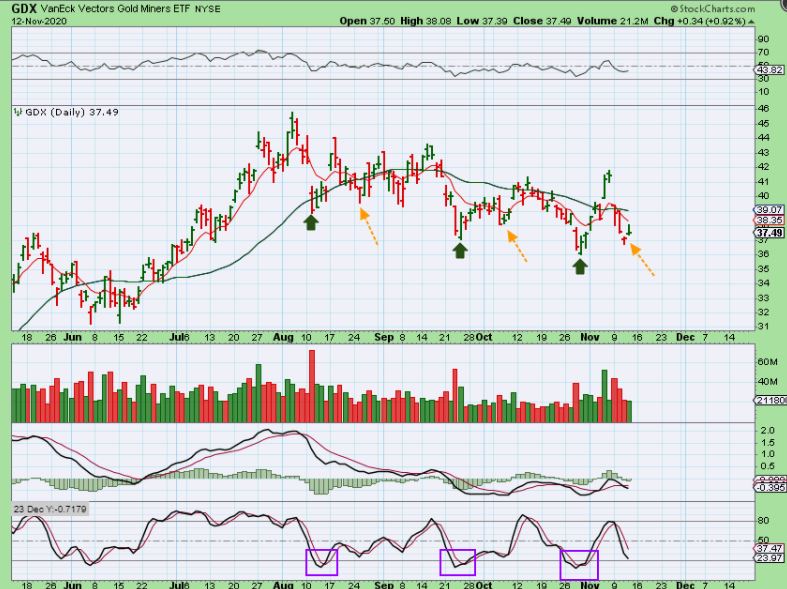
This was in Fridays report: GDX already had that 3rd drop and that is why I have been leaning toward the idea that Miners may resist the sell off if we get a quick sharp drop. We could be seeing a higher low, but really only time will tell. Basically Miners remain choppy.
.
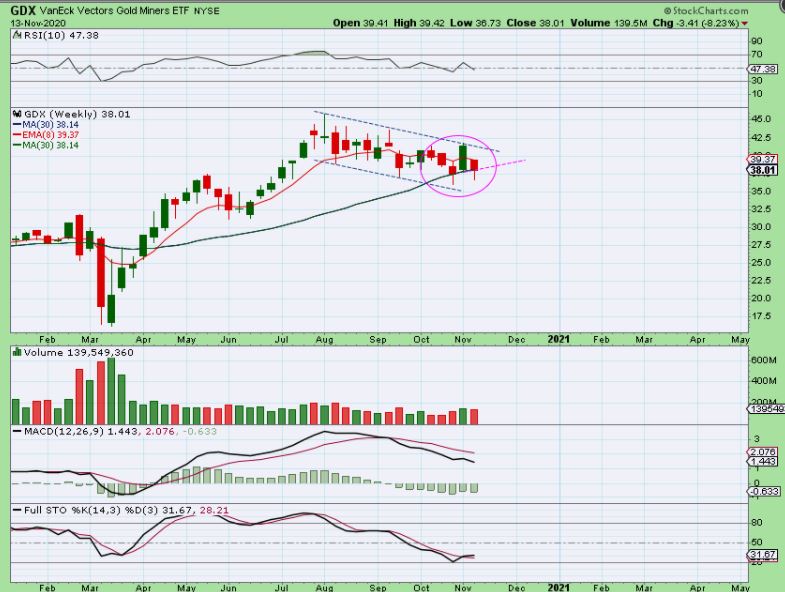
GDX WEEKLY – 2 Weeks ago we had a reversal off of the 30 week ma followed by that Pop to 7 week highs and then it sold off this week again. We didn’t close at the weeks lows so now we have another reversal right at the 30 week ma. Lets see if we move higher from here next week too.
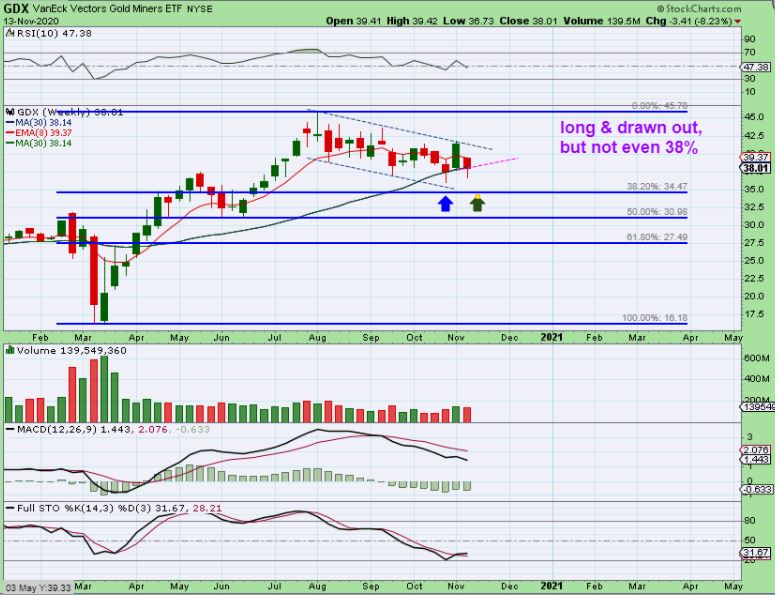
Even though we have been in a long drawn out consolidation, GDX still has not even dipped down to a normal 38.2% fib level. That drop would be normal. So if Gold & Silver do drop, there is a chance that GDX will slightly cut to new lows 1 more time. Honestly though, I expected a tag of the 30 week ma and we have that . GDX is oversold on a weekly basis and the Lows might be in for Miners.
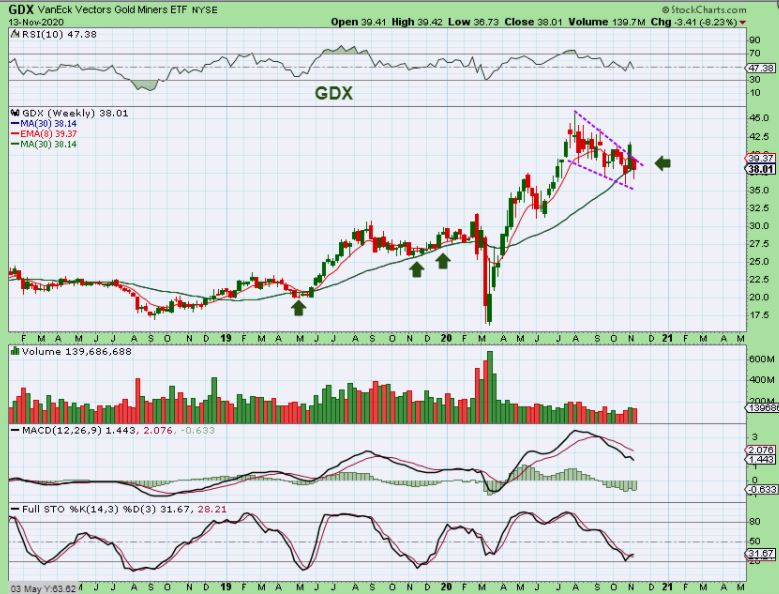
Bigger Picture GDX – Stepping back we see that the Mines actually have done everything that I was expecting to see at an ICL.
.
1. I’ve mentioned that it usually tags or slightly breaks the green line & recovers. It did that.
2. I’ve mentioned that it will usually reach an oversold level in the stochastics. It has done that.
3. We look for a reversal at the Green line and now we have 2, with the lower low possibly an ICL for GDX.
.
– The General Markets broke higher, but they did form a weekly doji, so next week will show us if its time for them to take a break or if they’ll continue higher a little longer and then dip down into a dcl later. It remains a bullish set up.
.
– Oil did a bit of a false break out, but the XOP double bottomed and did find some follow through. Buyers are stepping into the Oil Stocks and they can be bought on pull backs as a ‘buy the dip’ trade.
.
– The XOP is curling the 30 sma higher and all oil stocks were up 20% or more. It is a bullish set up and buying the dips should become a good trade.
.
– USD : The weekly chart does resemble a bullish double bottom with divergence, but that daily chart looks like a failed daily cycle. We saw an ICL and then a rally and a dip into a dcl. That low was broken so we would have a failed daily cycle. Why? The USD Daily cycles are never really 2 months long, so we must have broke that dcl and that signals a failed daily cycle and lower prices in due time. That USD dip would help the precious metals.
.
– Precious Metals : From the above charts we saw that enough ‘time’ has gone by for this consolidation to finish up ( at least in Gold & Miners). Sentiment today is that people are getting pretty tired of the lack luster performance of these miners, despite what looks like much improved fundamentals and earnings reports. So we now appear to be very close to the next rally phase in this sector and when it happens it should last for weeks and months. We are close.
.
Enjoy your weekend and thanks for being a Chart freak with me!
.
~ALEX
.

