
November 3rd – It raises Questions
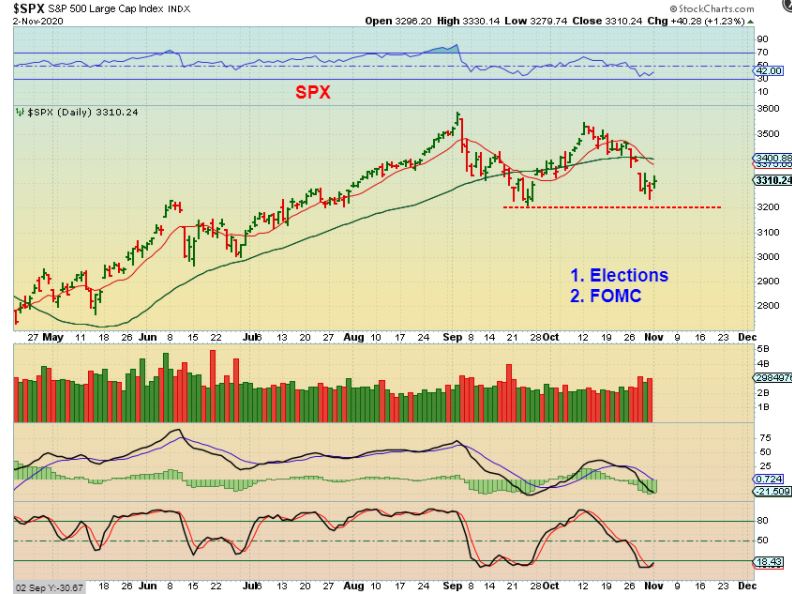
SPX and the NASDAQ have a higher low, but with the elections still ahead, we could see this go either way. If you bought this as a deep 1/2 cycle dip, you could use a tight stop at the red line.
WTIC – Oil dropped to new lows and suddenly reversed with a strong bullish reversal candle. These candles are a buy, but it is not without risk. If this is not an ICL, it may just be a final dcl. This could still be a final daily cycle that gets rejected at the green 50sma but again, it is a buy with a stop at the lows of Monday if you don’t mind the risks.

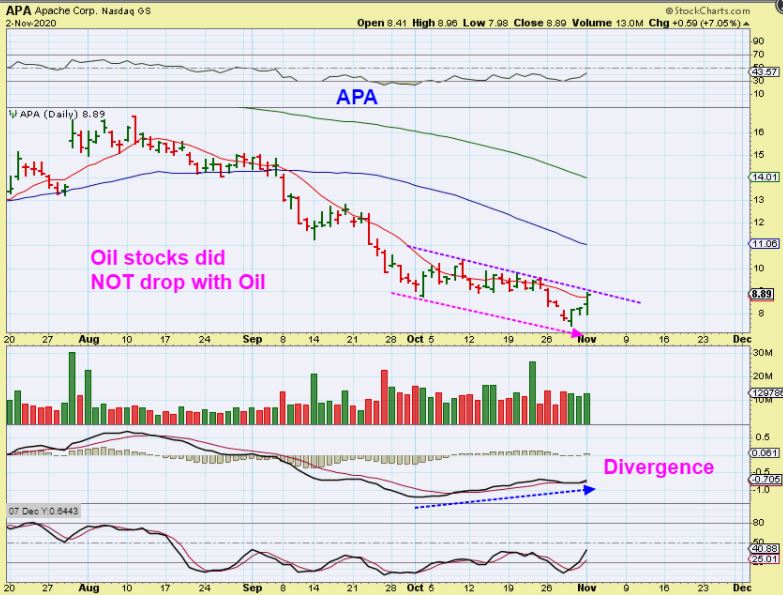
XOP– I looked up MRO, VLO, LPI, APA, etc and none of them made a new low like Oil & none of them dropped Friday with the General markets. In fact, they all look like the XOP and that actually bottomed 3 days ago. I see strong MACD divergence and this finally looks like a legitimate low. Let’s look at & discuss APA.

APA – This looks like the XOP and it also becomes a buy for a few reasons. It is not without risk, but it is a basic buy.
1. The General Markets made new lows Friday, these oil stocks all ignored the markets sell down.
2. Oil practically crashed Monday before reversing, Oil stocks ignored that & remained green.
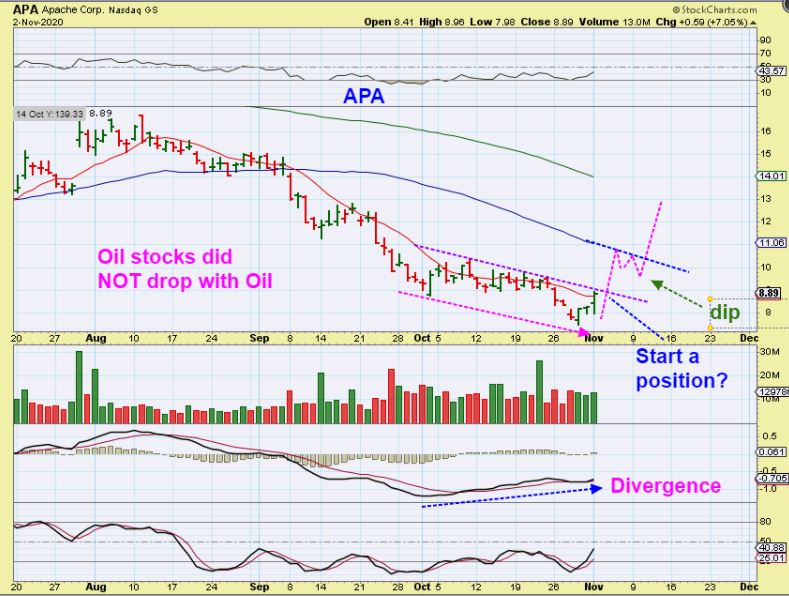
3. I have people ask me, “How would you now buy this?” There is no correct answer really, but this is how I would end up playing this…
.
I LOOK FOR A WAY TO GET IN: I may buy a couple of these with smaller start positions right now & then add on the next dip, or simply watch what it does and wait for the next dip to enter. We could see a deeper dip to the 10sma or a crawl along the 50sma.
.
PRECIOUS METALS: THIS IS THE AREA THAT RAISES QUESTIONS, BUT THERE ARE NO GAURANTEED ANSWERS YET
.
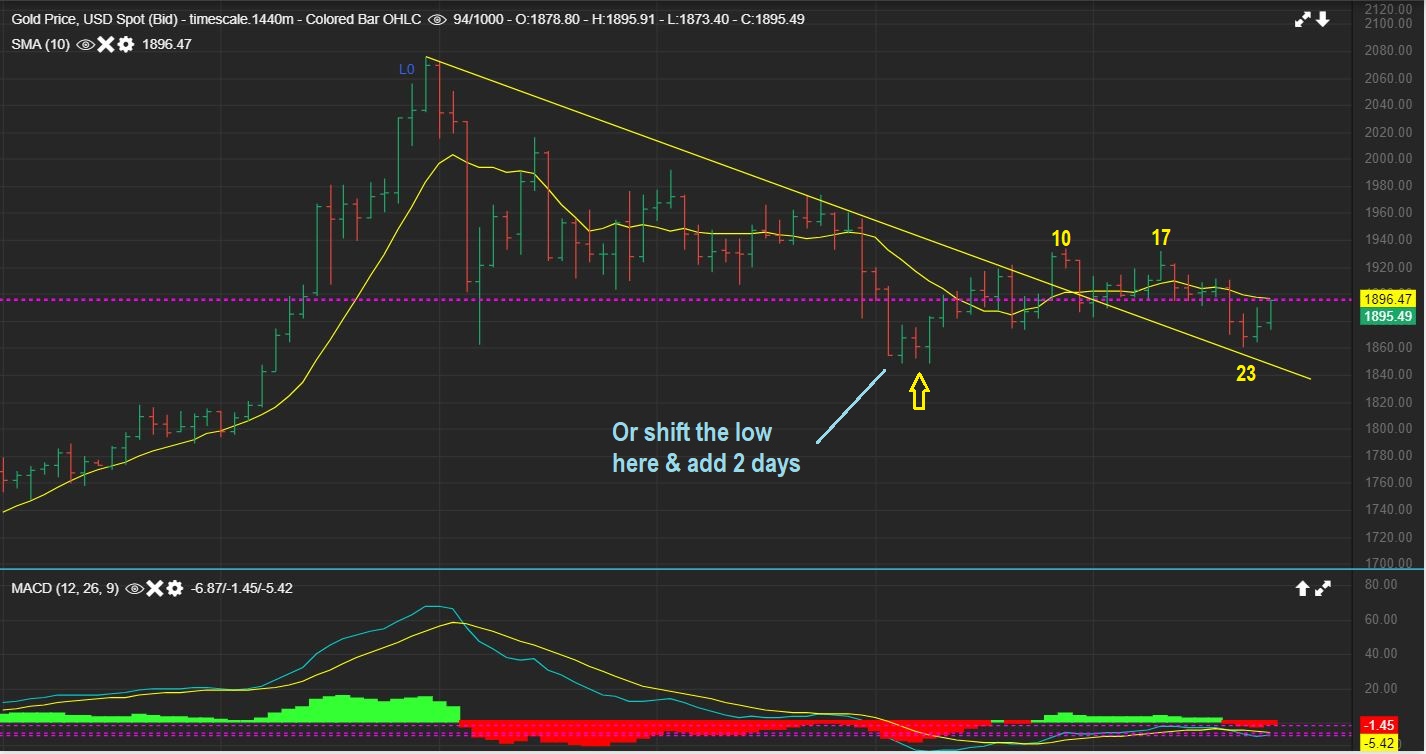
GOLD – is pushing on the 10sma and looks like it could continue higher. What question does this raise?…
.
SAME CHART FOR GOLD – Weeks ago I said that Gold broke the downtrend and that could signal an ICL. It was a buy with a stop at the lows. Those lows have not been broken. So Miners broke the lows from that time period, but Gold & Silvers have not and THAT raises questions.
1. Could Gold have bottomed and be waiting on the Fed at the lows, while Miners broke to a new low and simply have bottomed later?
2. The answer is that it is possible, since I have seen Gold bottom before the Miners in the past. Let’s discuss this…
.
When Gold broke that trend line & Miners meandered higher, I remembered the lows of 2016, but I didn’t want to say anything yet. It was too early to risk ‘confusing’ the set up with too many possibilities, but now I will point us back to the ICL at the time of that massive rally in 2016.
.
In fact, if you have been with me for a while, you may remember that I have discussed this many times. For the ICL before that 2016 massive rally in Miners, Gold actually bottomed on December 3 2015, and Miners Broke those lows and bottomed in Jan 2016 before the big rally. That means that Gold bottomed over 1 month before Miners in 2016. I will post some of my older charts showing this below.
GOLDS ICL WAS DEC 3, 2015- Notice that price never dropped in Jan 2016

.
Now we look at GDX at that 2015-2016 time period and MINERS CRASHED & BOTTOMED OVER 1 MONTH LATER THAN GOLD IN JANUARY 2016. Let me discuss this a little bit more compared to our current set up…
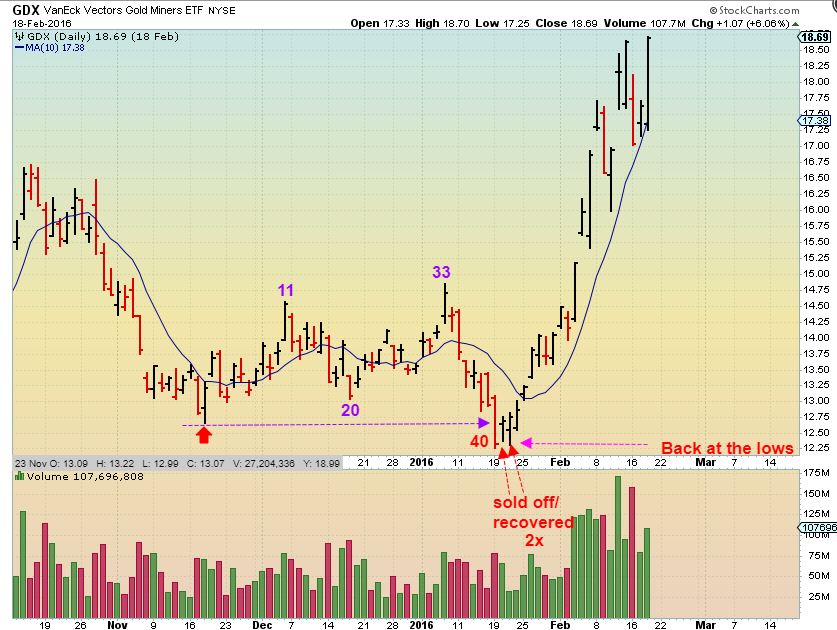
GDX had a 40 day daily cycle that January and Gold bottomed on Dec 3. Didn’t it look like day 33 for GDX was bullish and Miners were off to new highs? Suddenly it crashed into day 40? So even if we think Gold bottomed already we do still need to be careful with an FOMC Mtg ahead, right? Even this raises 1 more question…
.
Even this raises 1 more question: Look at day 40 , and then day 1, 2, & 3. Gold was already bottomed in Dec, Miners bottomed with 4 days at the lows & then broke the 10sma. Are we at THAT point now? 4 days at the new lows & then a rally? Lets look at our GDX…
GDX – 4 days at the new lows, now breaking the 10sma. Yes, other than a much shorter day count, it looks a bit similar with Gold making higher lows and Miners spending 4 days at the new lows. To prevent people from getting overly excited…
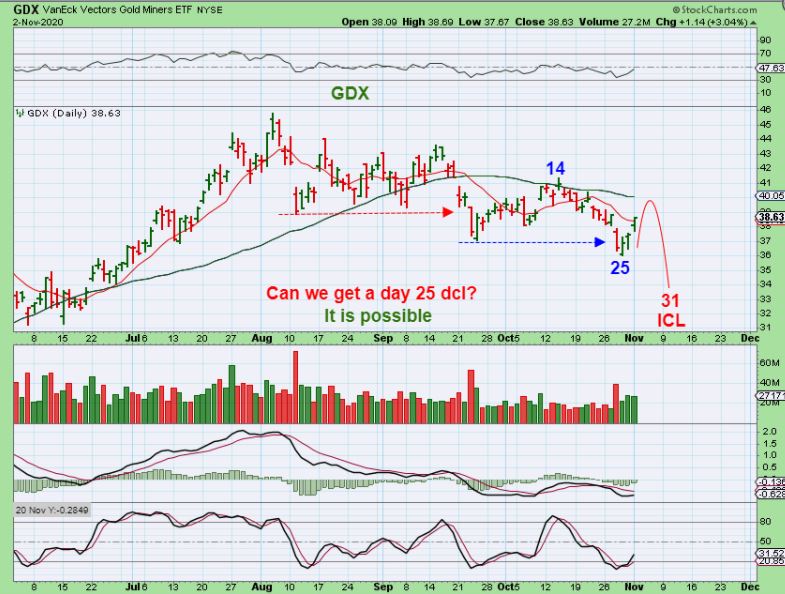
.
To prevent people from getting overly excited, I drew in an FOMC DROP to day 31. THAT is still possible and that would also look like 2016 with Gold bottoming a month ago and Miners plunging down.
.
So I wanted to explain what I am seeing and what questions it may raise, but unfortunately there is no way to answer the questions that are raised. I can point back to a prior ICL in 2016 and see that Gold bottomed 1 month before Miners, yet Miners crashed down to new lows. We still have a Fed Mtg ahead, so that leaves us with future uncertainty and often it is a time of whip saw. I also would say that my last weekend report clearly showed that even GOLD & SILVER could drop to new lows after the FOMC. The charts do indicate that a drop is still possible (See the weekend report again).
.
You may also recall that back at that last DCL with Gold I said that you could buy or start smaller positions and ‘see what happens’. Some of those Miners broke to new lows already, others have not. All we can do at this point is see if Gold breaks out higher from here or does it sell off to a new ICL Low after the FOMC Mtg. Many Miners are still at their recent lows, so we have avoided a lot of choppiness and selling. This week should present the buy for Miners, but I’m still waiting for that FOMC MTG to answer that final question: What will Miners do on Fed Thursday?
.
Below I will discuss some Miners again, enjoy your Tuesday trading!
.
~ALEX
.
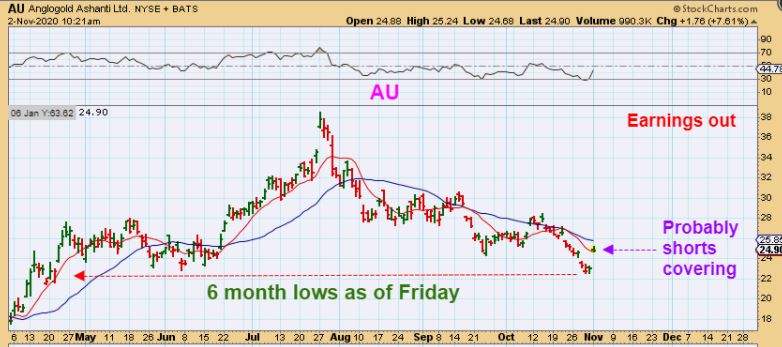
AU had a good earnings report and gapped higher yesterday, but notice that it was still at 6 months lows last week. This could be THE LOWS for AU, but it does have a gap that may also fill. If you wanted to buy AU, you could always start a small position & add on a gap fill / reversal or break out.
.
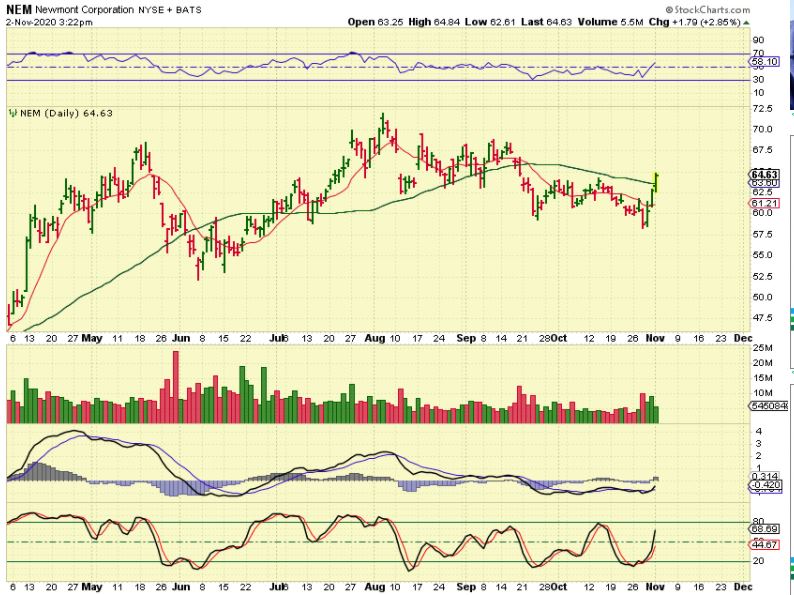
I grabbed this chart at 11 a.m. as NEM broke above the 50sma. I mentioned that I am actually getting a buy signal on NEM and that often means that even if we get a sell off, NEM can hold above the lows.

.
NEM WAS $64.73 AT THE CLOSE: This was just before the close. If Gold sells off after the FOMC, NEM may not break these lows.
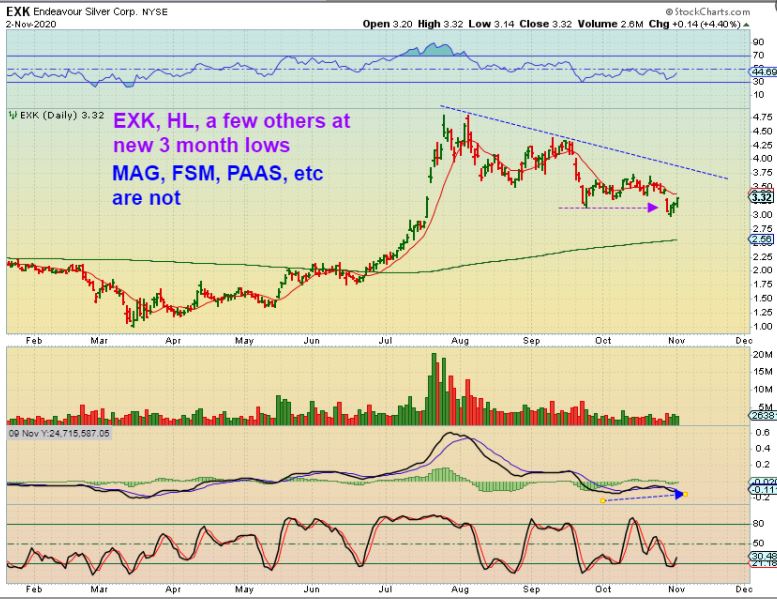
EXK broke to new lows, but shows bullish divergence. CAN this drop to the 200sma? Yes, but it also could break higher & run. We are getting a mixed picture at this point, unable to tell if GOLD has an ICL or will those lows be broken later this week. Conclusion: The downside would probably be the 200sma, but it may have the lows in place now too.
.
SMALLER MINERS / EXPLORERS
.
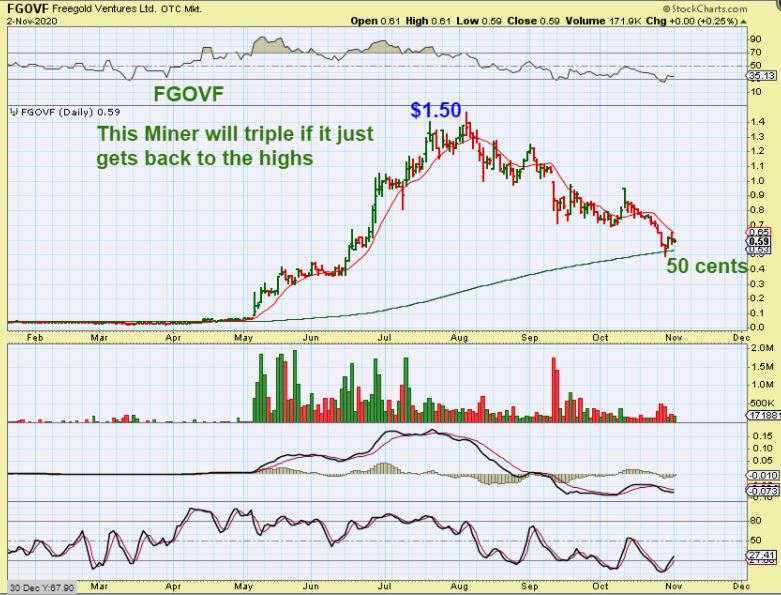
FGOVF – Recently I pointed out some of the junior / explorers that have dropped significantly. Even a move to where this one was 3 weeks ago is a 100% move, and a run to former highs is 200%, so we are at the lows and the gains should be very good once we get back to rally mode. The 200sma may be the lows for this one.
.
TDRRF has been crawling & pushing along the 50 sma. Did it put in the lows when Gold put in its last lows? It hasn’t dropped with GDX or GDXJ, but could revisit the lows if the Fed decision sells miners off, but this is a nice consolidation.

.
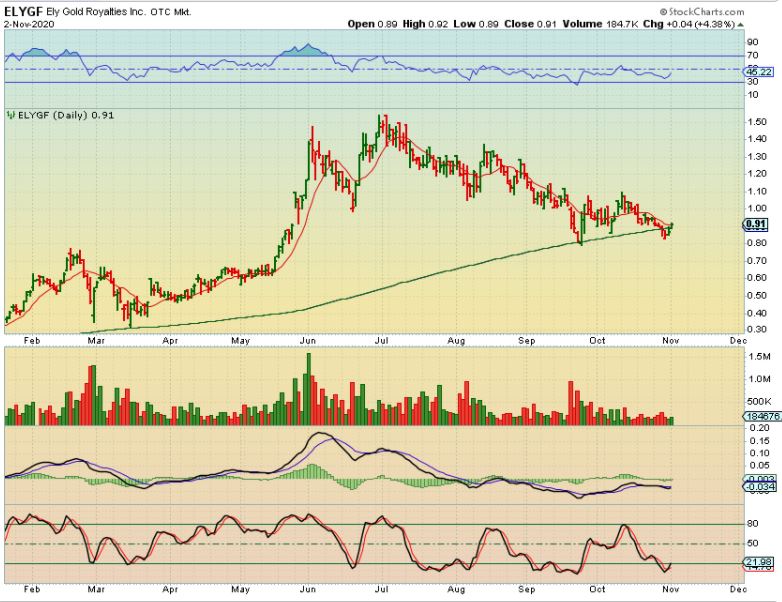
ELYGF broke the 200sma and recovered yesterday. These may be the lows or support for ELYGF. It also has higher lows like Gold and did not break to new lows like GDX/GDXJ, so this may be a buy with limited downside too. Start small and build on it? Or wait for the FOMC.
.
SO WITH MINERS IT REMAINS A MIXED PICTURE. You will need to decide if you want to start positions before the end of the week? If so, how big of a position? What if it sells off after the FOMC? Ride it down & Add or stop out & try to reenter? This is where we are at this point. This week should be the buy though, whether you start now or after the FOMC Mtg.
.
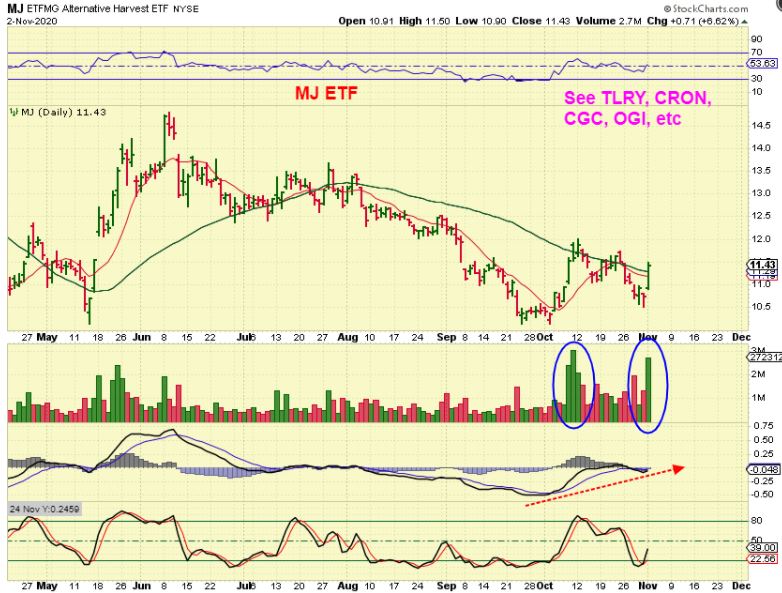
MJ – This sector has been pointed out by me recently as possibly bottoming & Bullish. With the Market Choppiness it has been a very rough ride, possibly even stopping many out. Despite that, this sector still looks to be bottoming. The gains in this sector are always big when it gets running.
.
OGI pushed up 6% midday and it is one that held the support of the 50sma & looks bullish.
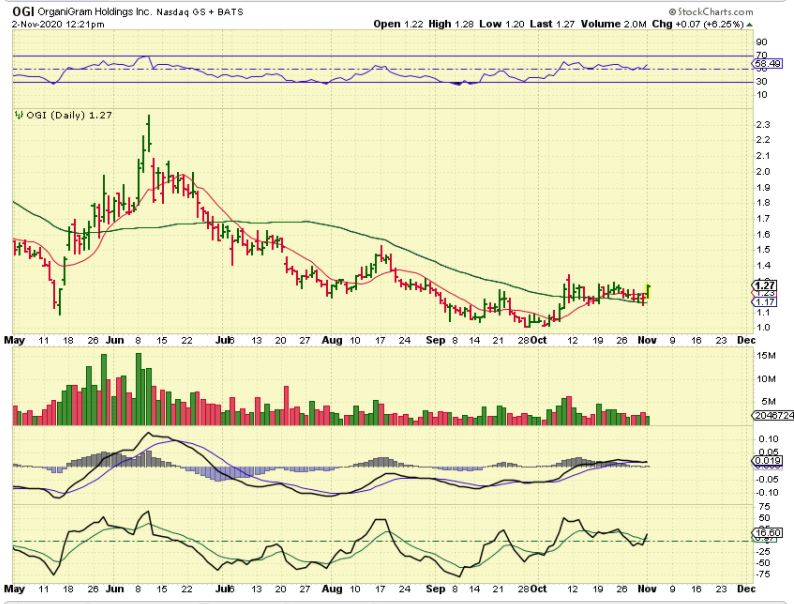
OGI closed up 10% with strong volume. It’s a buy, and especially if it dips back down would it be a good one to add. It didn’t break the 50sma. 
.
.
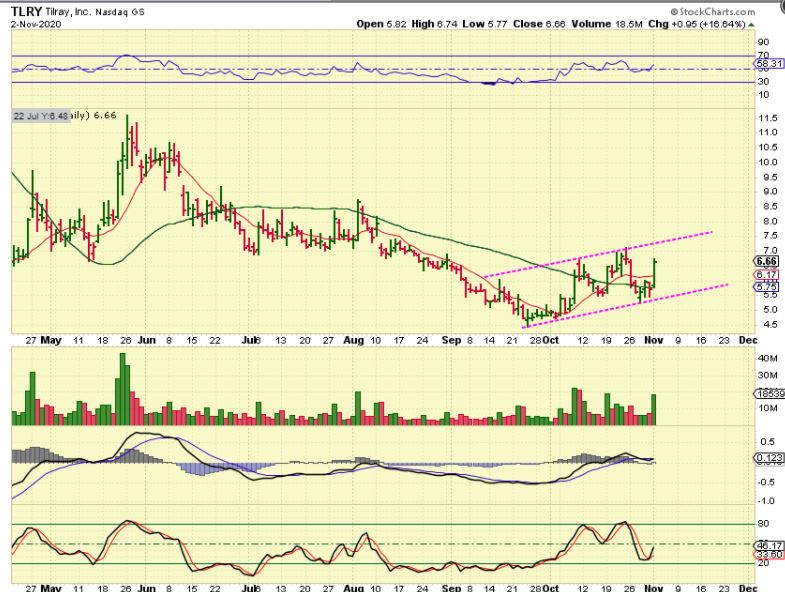
TLRY is one of the hardest ones to ride. As you can see, it also looks to be bottoming and bullish, but it has very wide swings!
– It bottomed from $4.50 and ran to to $7.
– Then it dropped to $5.50 and ran to $7 again.
– It then dropped from $7+ to $5.25 and now is back at $6.66. It is a rough ride, but still has the potential to easily double.
.
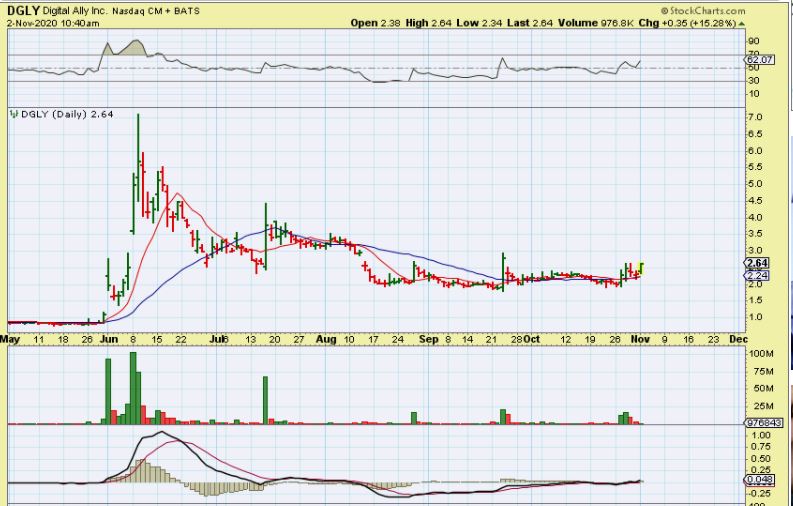
WITH THE POTENTIAL FOR UNREST AROUND THE ELECTION, I HAVE BEEN MENTIONING IN THE LIVE TRADING AREA LAST WEEK ‘DGLY’ AS A SECURITY COMPANY ( Body cams, etc). I SAID THAT I OWN IT & WAS BUYING DIPS.
.
DGLY started to push higher again yesterday, so I posted this chart. It has that long base and great upside potential. It went on to gain 30%, so it may be too extended to enter now, but a pull back may offer an entry. I also mentioned 2 others that I thought could do well under the same line of reasoning….
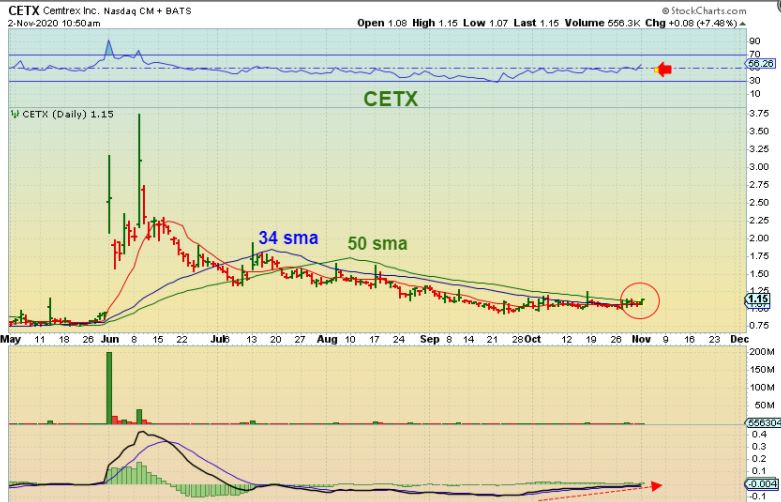
CETX was mentioned too. It also has the long base after an explosive move higher in June. Notice how price was rejected at the 34 sma at one point and the 50 sma at another? They now lined up tightly and price is breaking out. I think this also has good upside potential, at least for as long as ‘security’ is in the headlines.
VISL has also formed a nice tight looking base & could pop above the 50sma at $1.41, so I posted this one in the live area too. If it does break out, it could stair step higher. This was at 11 a.m. and volume was a bit light, but suddenly volume started to flow in…

.
VISL actually closed above that 34 & 50 sma and volume was big. There is always a potential for Short cover too, since the short positions are high. The hard part is that it closed up 18%, but you can see that the upside potential is pretty big, so you could buy a dip if we see one.

.

