
October 31st Weekend Report – Is It Time yet?
SPX WEEKLY– As expected, we have been seeing sideways chop and indecision with the US Election approaching and major earnings releases this week. We more earnings ahead and an Election & The FOMC MTG next week, so the choppiness should continue until these events pass.
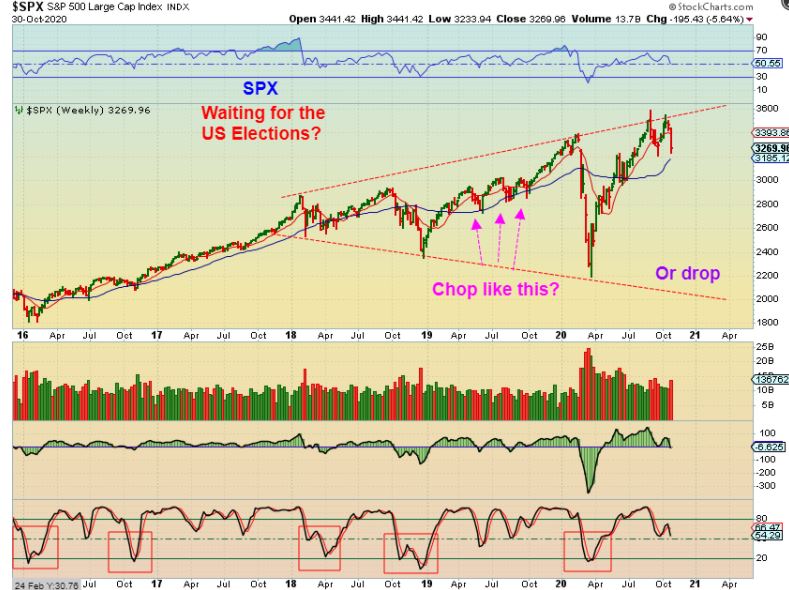
,I want to show you a series of Possibilities, since at this point we cannot tell whether this will resolve Bullishly or Bearishly. The next 4 charts will give us examples of patterns that could develop from here & play out. The day to day daily reports will follow the progress and identify what is happening after the above mentioned Major events pass.
.
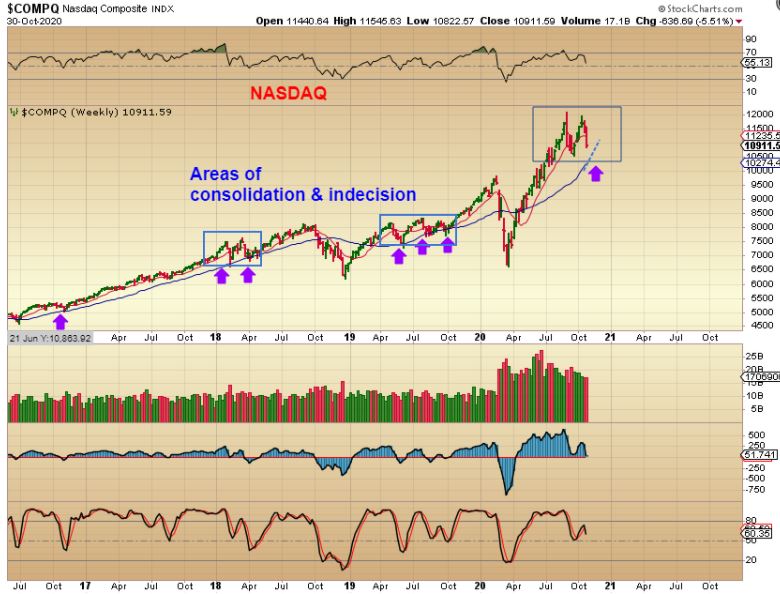
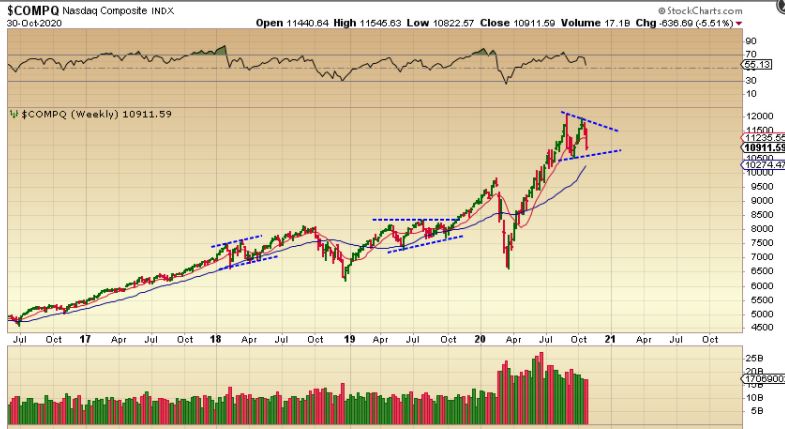
NASDAQ WEEKLY – I am simply pointing out our current consolidation with past consolidations to show that it is normal to see such times of choppiness, even in major bull runs. How might it resolve? …
,
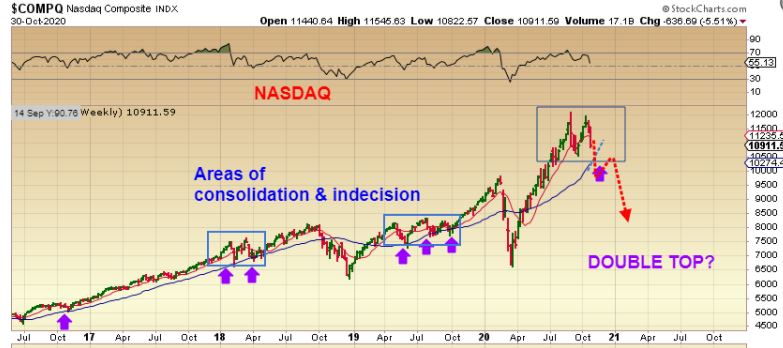
NASDAQ WEEKLY (Double Top) – Look at the end of 2018 and the beginning of 2020. We had extra deep market sell offs that raced far below the blue support line (30Weekly MA). Those are short term market crashes. I drew one in here as a possibility if the elections or the recent Covid 2nd wave increases bearish sentiment among investors. This would be the real drop into a deep ICL.
,
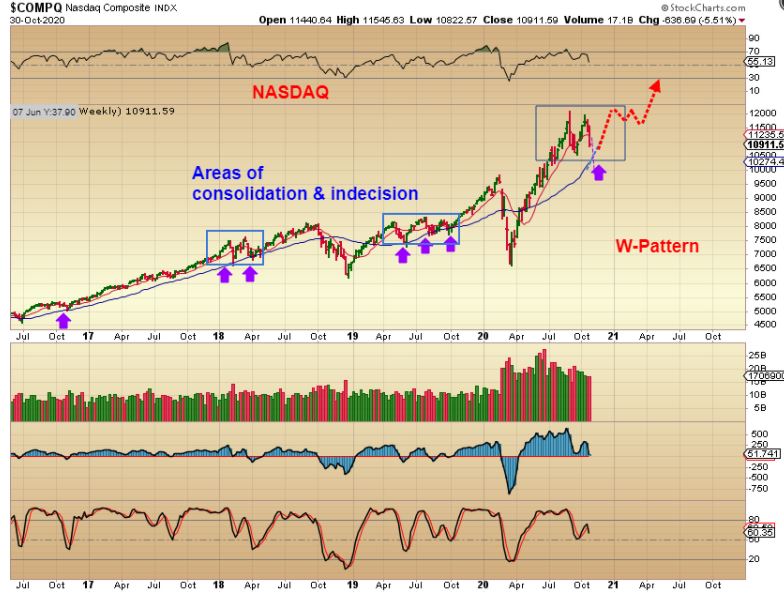
NASDAQ WEEKLY (W-Pattern) -A drop to support and reversal can be a bullish W-Pattern or it could be something similar to the consolidations in the other 2 blue rectangles that eventually led to a continuation higher ( Election results perceived as positive, Gov’t Stimulus, FOMC rates kept near zero, etc).
.
NASDAQ WEEKLY (Bull Flag) – For the same reasons as the above chart, a Bull flag just allow overly bullish sentiment to cool down. Look how straight up the run out of the March crash was. Markets run best when they climb a wall of worry.
,
So at this point the charts do point to this possibly going either Bullish or Bearish, and we have strong events ahead that could be the trigger or catalyst. A 2nd wave of Covid, US Election results, The FOMC Mtg, etc. These are big and can weigh on the markets, so we need to monitor things going forward and look for signs after this week passes.
.
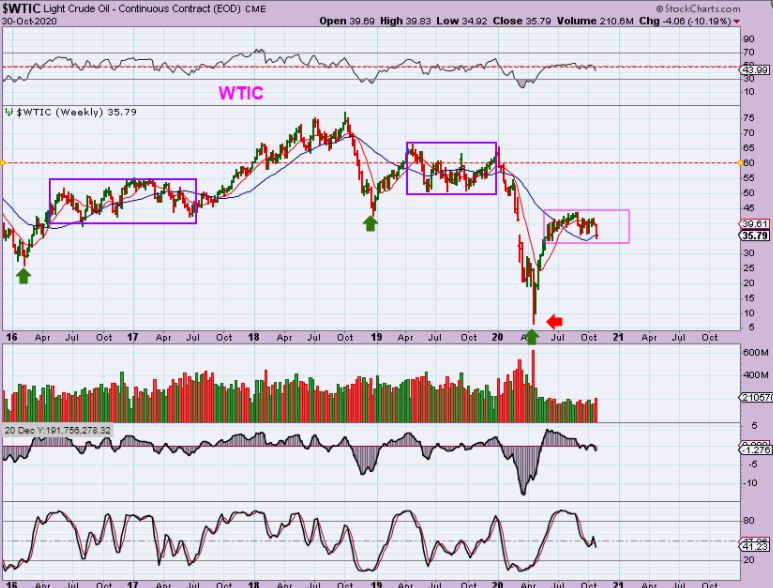
WTIC WEEKLY – I have been saying for months now that after a strong run out of the ‘Crash’ ICL lows for Oil, it often just chops sideways for weeks, and we are seeing that here. A surplus of Oil is keeping Oil prices low, gas prices at the pump in my area have been around $2/gallon, and that’s all great, but the chop isn’t offering a good trade opportunity in this sector.
.
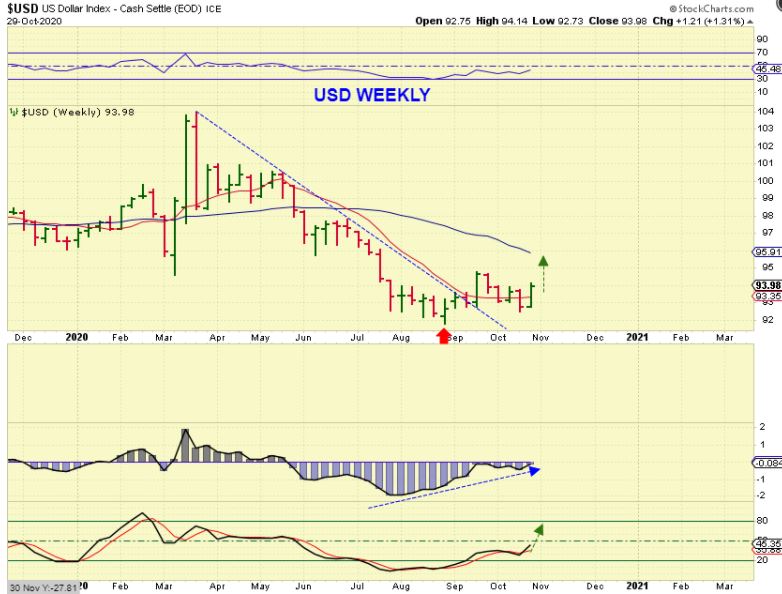
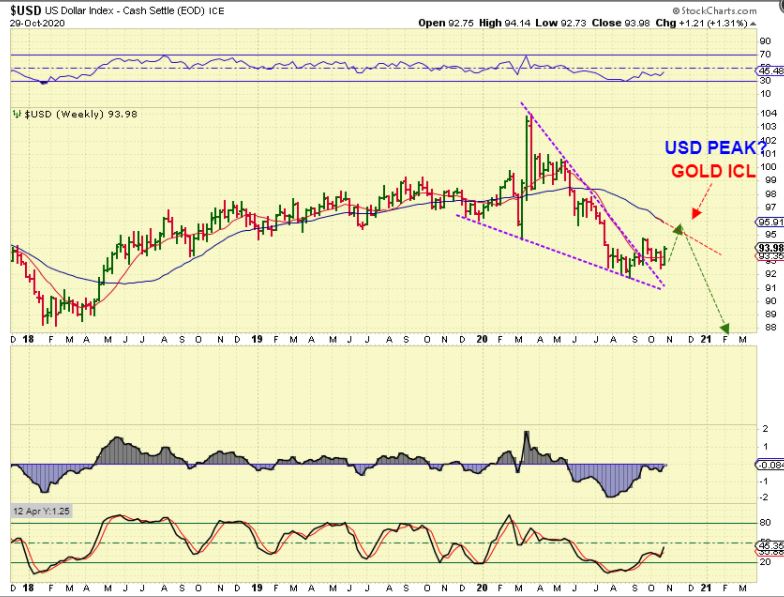
USD – The USD put in a solid ‘up’ week and I think that it can run a little higher. 2 weeks ago the USD dropped and Gold Popped. Last wee as the USD price popped, Gold dropped. Lets look at the bigger picture.
.
USD – I see room for the USD to climb a bit higher and I also see that Gold also has room to drop lower, so this is basically what I am expecting next week around the time of the FOMC MTG.
.
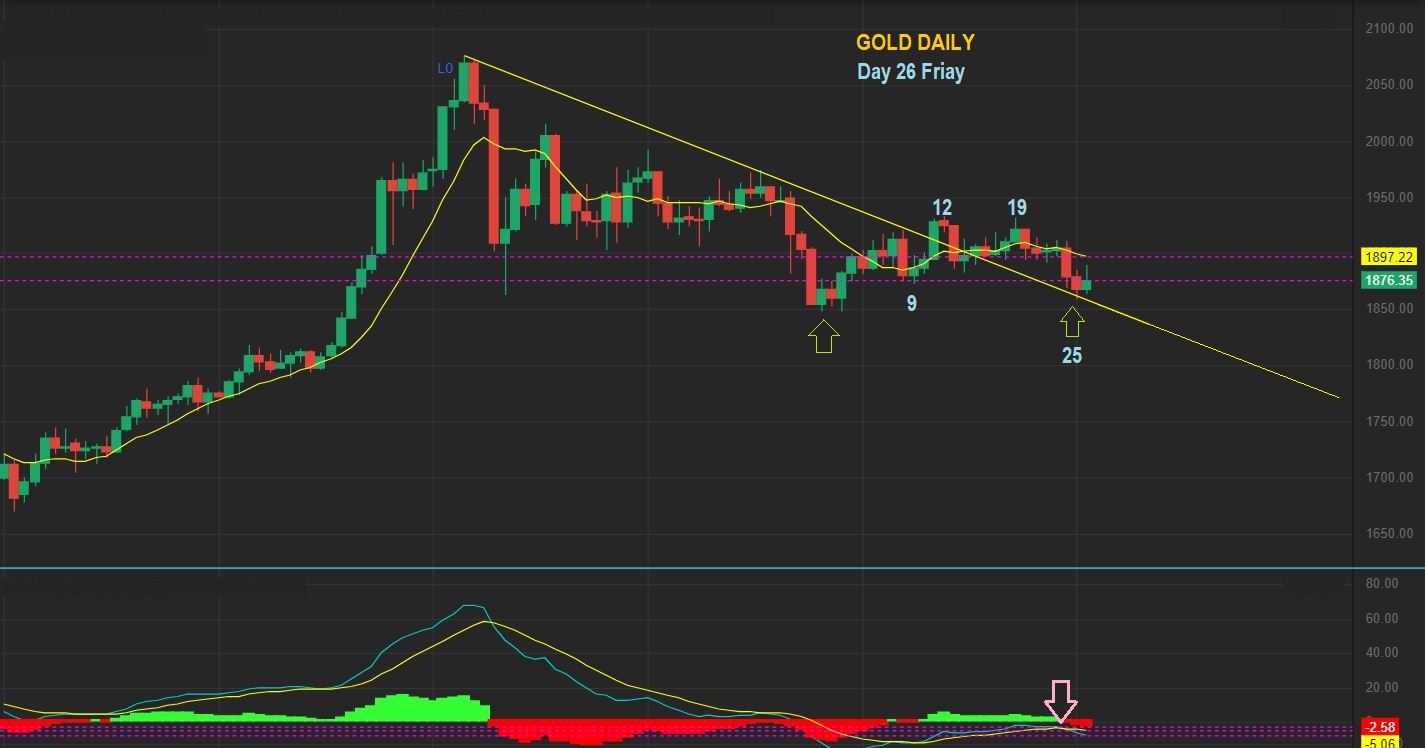
GOLD DAILY –
1. This looks like a break out from a down trend and a back test. If gold was going to dip lower, it could just climb down this trend line.
2. Using Golds Cycles & Cycle count, we were on day 26 Friday and Golds daily cycles last roughly 33 days from low to low. The FOMC MTG is on day 30. That makes this a very interesting set up.
.
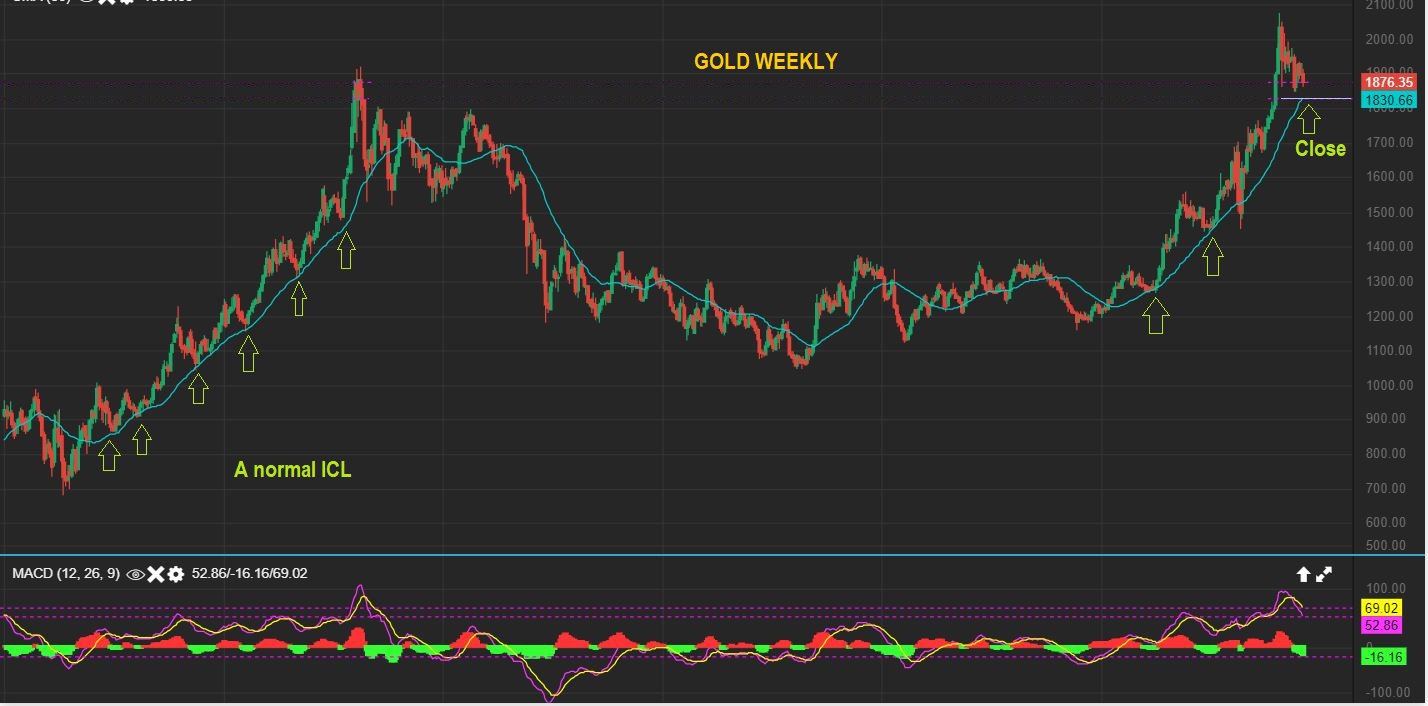
The Big Picture for Gold #1 – I am expecting an ICL (Intermediate Cycle Low). These are the deeper sell offs that come Roughly every 6-7 months ahead of the last one. The last one was in March. We are due. This chart also…
.
SAME CHART #2 : This chart also shows the Bull run in 2008-2011 and the ICL dips landed on the blue line of support reliably. Each yellow arrow is an ICL. This past run from 2018 is also landing on that blue line. If the USD pops next week, Gold can drop to support. These ICLS present a Major Buy in this sector.
.
GOLD TRIGGER #1 – I want to show you an indicator that I developed and back tested that always triggered a Buy right at the ICL (lows). It is the lower box. I used it often during the bear market sell offs and now I tweaked it for a Bull Market. Look how accurate it is.
.
SAME CHART GOLD TRIGGER #2: You can see that I don’t have a buy yet, but if we drop & reverse, I would likely get the buy that week (unless the reversal was on a Friday, then I’d probably get the buy Monday or Tuesday). 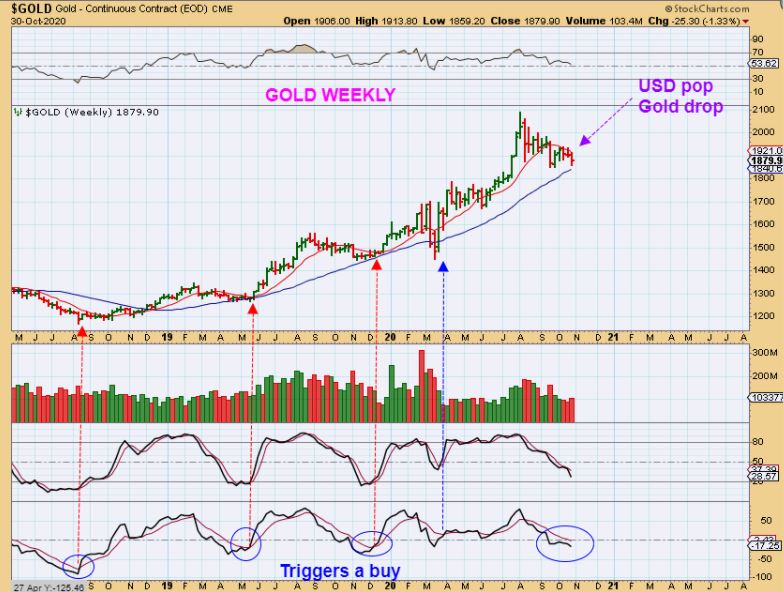
So basically we are Very Close to a Buy in this sector and I think the FOMC MTG may be the time period when we will see that buy. The only problem is that on day 30, the FOMC could actually trigger a false move first. In the past I have seen a flash sell off for a day or 2, and then a sharp reversal and rally, so it can be tricky. The Big Picture is Bullish though and is calling for a rally soon.
.
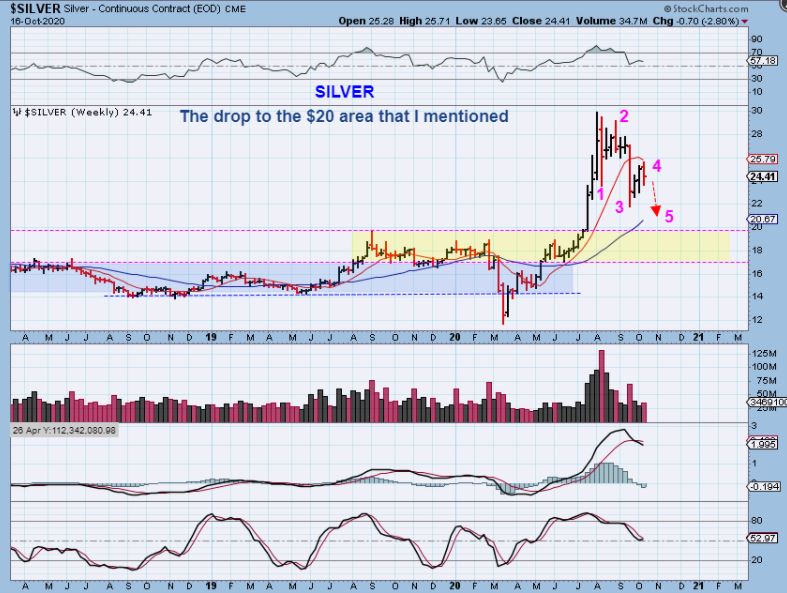
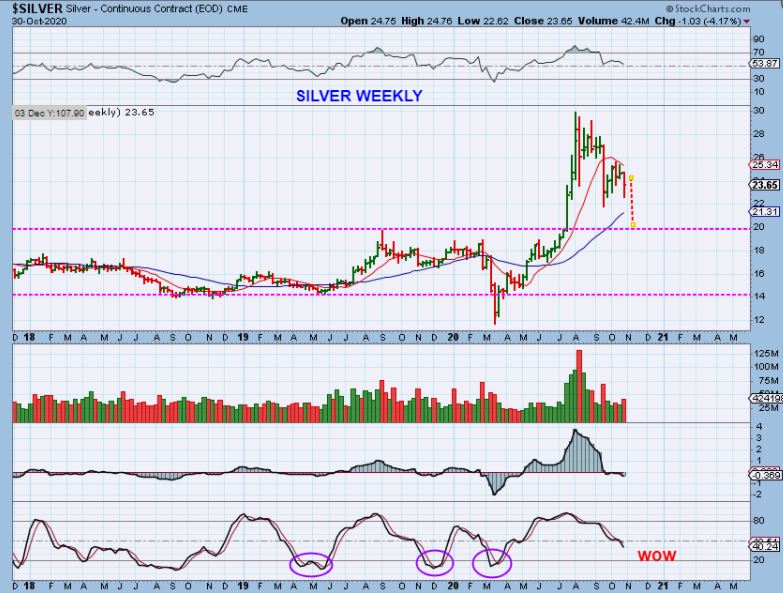
SILVER CHART FROM OCT 17 – I have been saying for weeks now that if Silver drops to $20ish, it should then bottom & become a buy upon a reversal.
.
SILVER dropped this week, but started to recover at the end of the week. We hit $22.62, but I still think that next week will drop it down lower. ( FOMC?)
.
GDX actually looks like it has been leading the way lower. Gold & Silver just dropped a little and then bounced back , but as you can see, the Miners broke to new lows & broke the blue line and almost recovered Friday. Since Miners usually lead the way, this should be their drop into their ICL. Miners may not have much more downside when I look at this chart. The lower indicator shows that they could reach that ICL Oversold area next week (FOMC?). Some Miners may already be bottoming.

.
GDXJ actually sold off over 6% last week and then bounced. It tagged the blue support line & Bounced. It has also not entered the oversold area in the lower box, but it is almost time to say that we are there. We could see a quick ‘reaction’ of some sort next week (FOMC) and the next reversal would likely be the ICL BUY.

.
I’m going to repeat myself: I have been calling for and patiently waiting for an ICL to set up for weeks and even months. We have seen weeks and weeks of chop & false Pops that have come & gone, but now I think we are finally there. Many things that I look for to all come together are finally lining up, as you have seen in this report. So basically we are Very Close to a Buy in this sector and I think the FOMC MTG may be the time period when we will see that buy reversal. Like I mentioned above, the only problem is that the FOMC falls on day 30 and that could actually trigger a false move first. Plenty of Daily cycles are roughly 33-35 days long. In the past I have seen a flash sell off for a day or 2, and then a sharp reversal and rally, so it can be tricky. If you buy early, you just want to remember that, since the sell off should not last long and should also reverse. The good news is that >>> The Big Picture is Bullish though and is calling for a rally soon. Many things that I look for are lining up here and we are also within that timing!
.
Now go rest up, because next week is probably going to be more unsettled than last week. We have a long list of company earnings to be released along with the US Elections and the FOMC MTG with a decision on interest rates. I really just can’t expect it to be calm or smooth sailing until these events of uncertainty pass, but one of the best trades of the year looks like it is about to develop too. We have a lot to look forward to heading into the end of the year.
.
Thanks for being a Chartfreak with me, and I hope you all enjoy your weekend!
.
~ALEX
.
SIDENOTE: A question that I raise for myself is this… Is it possible that Miners bottom first, we get a bounce into next week, and then GOLD breaks to new lows while Miners drop and resist breaking their lows? Yes, it is possible. These 2 charts do seems to indicate that Miners may have already dropped deep enough for an ICL, While Gold & Silver could drop further. Also keep in mind that Individual Miners may break down further, other Miners may not.
I WROTE IN THIS REPORT: Miners may not have much more downside when I look at this chart. The lower indicator shows that they could reach that ICL Oversold area next week (FOMC?). Some Miners may already be bottoming.
.
FOR GDXJ I WROTE : GDXJ tagged the blue support line & Bounced. It has also not entered the oversold area in the lower box, but it is almost time to say that we are there. We could see a quick ‘reaction’ of some sort next week (FOMC) and the next reversal would likely be the ICL BUY.
.
Now look at the OCT/NOV 2019 tag of that blue line (ICL). It tagged it a couple of times without crashing down through it. We may just tag it again at the FOMC Mtg. Time will tell.

