October 24th Weekend Report
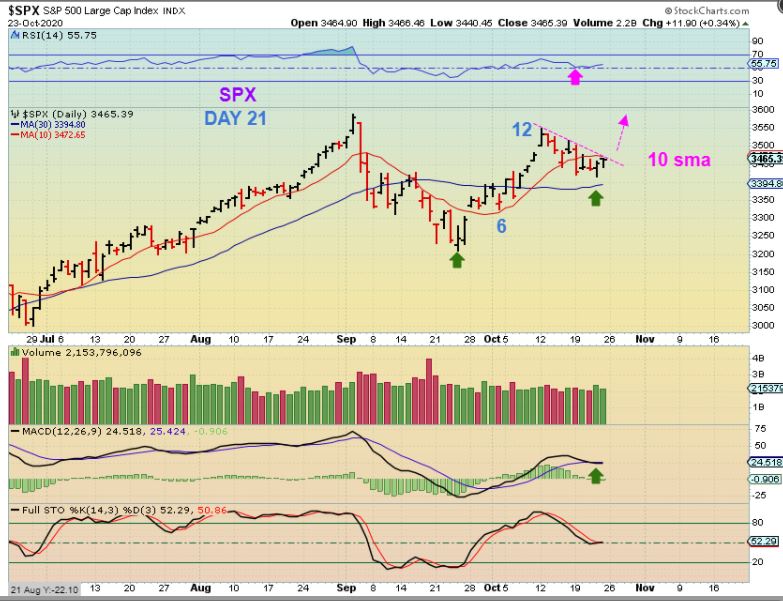
SPX DAILY – We had a reversal Thursday and a small amount of follow through Friday, pushing price against the 10 sma & a downtrend line. I would label this a 1/2 cycle low & look for follow through, but with the US Elections a week away, we may continue to just see choppy trading.
.
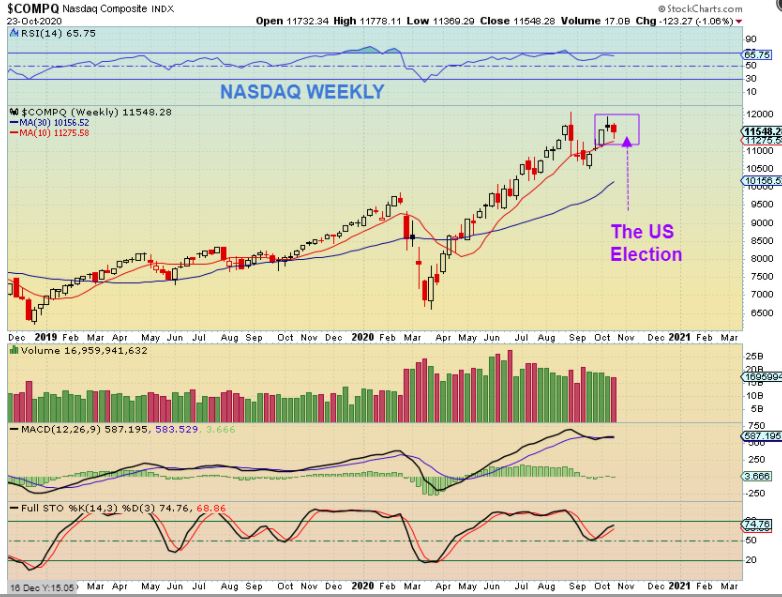
NASDAQ WEEKLY – The weekly has a small weekly reversal candle on the 10 week ma, and that remains bullish for now.
.
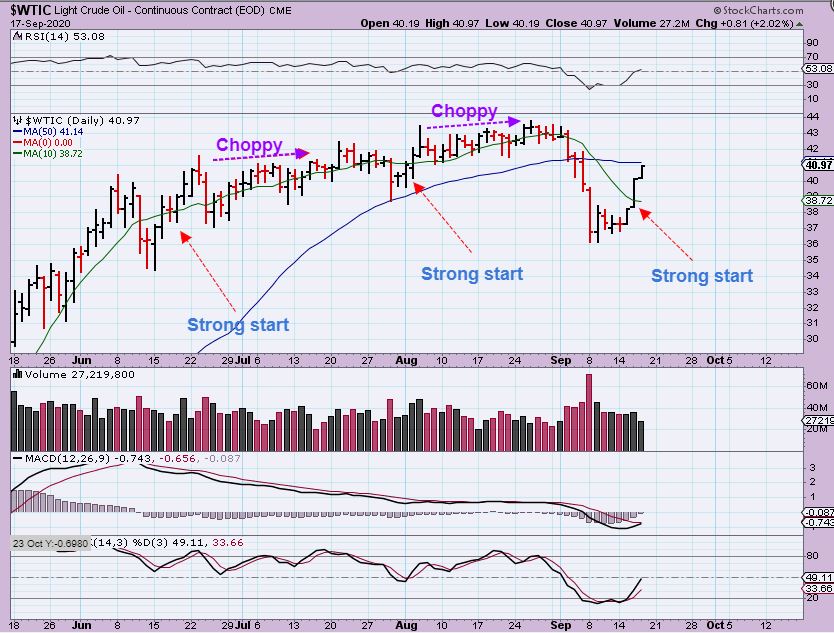
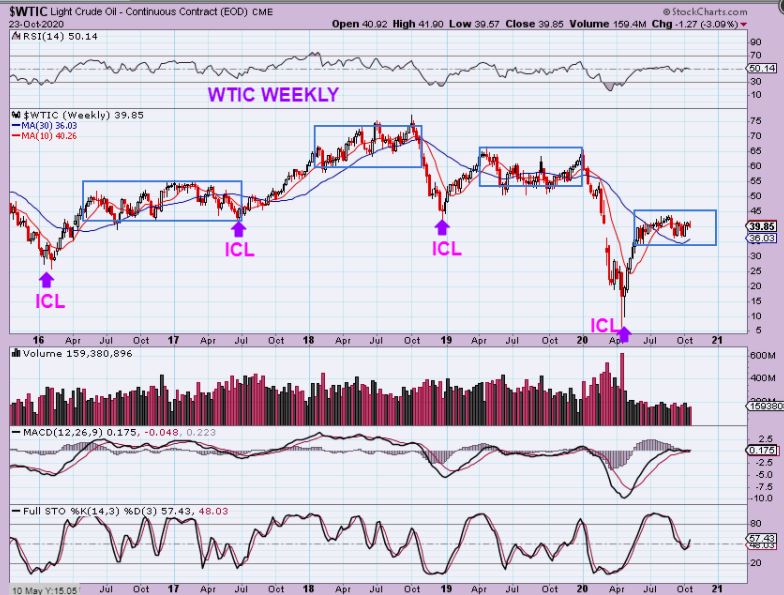
WTIC WEEKLY SEPT 17 – I have mentioned several times in the Big Picture Outlook that after a strong run out of an ICL, we can then get weeks or even months of just sideways chop that is VERY hard to trade or invest in. I mentioned that we may get that as we hit resistance and…
,
So far I would say that we are seeing that sideways chop after a strong run out of the lows play out. Choppy sideways action can be frustrating.
.
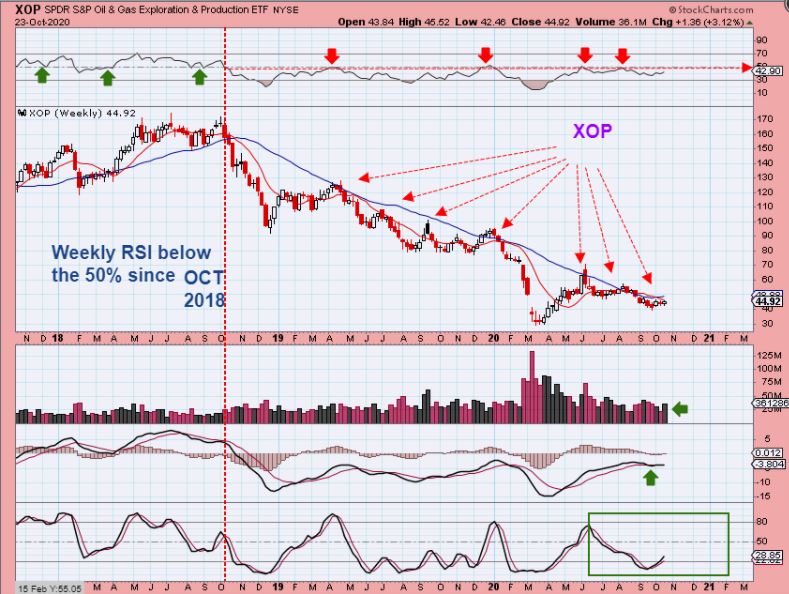
XOP WEEKLY – Oil Stocks are still pushing on that resistance area too, and it is in a downtrend. Lets zoom in though…
.
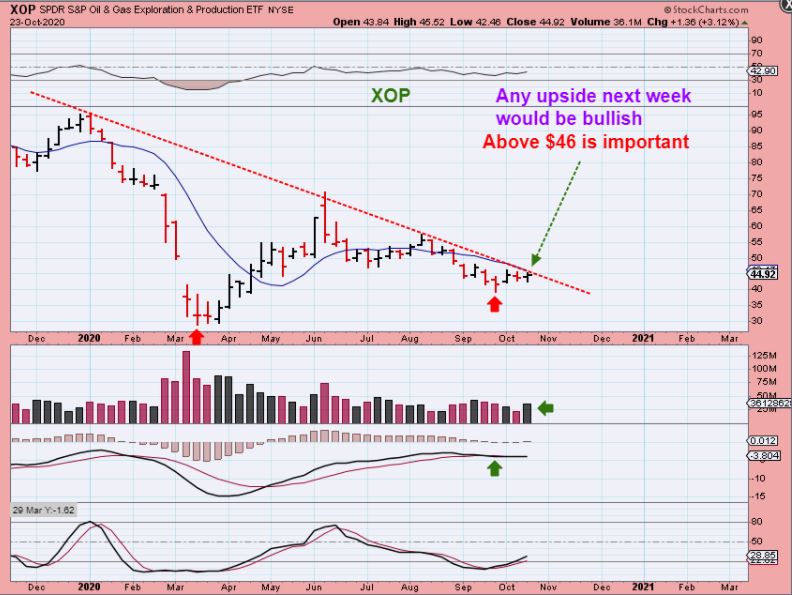
XOP WEEKLY – I pointed out last week in the daily charts that the XOP and some Oil stocks ( APA, MRO, VLO, LPI, etc) could be taking on a more bullish look. I would watch for a real break out above $46 to start to confirm more of a bullish set up.
,
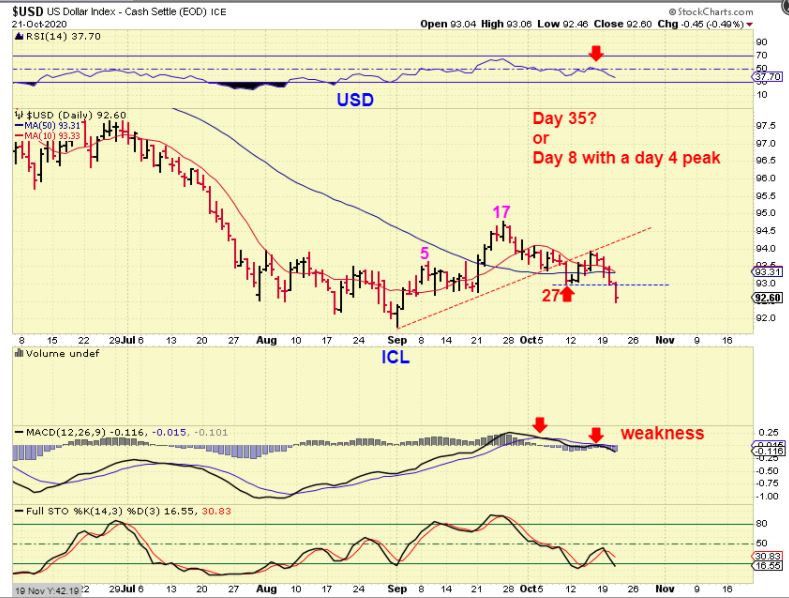
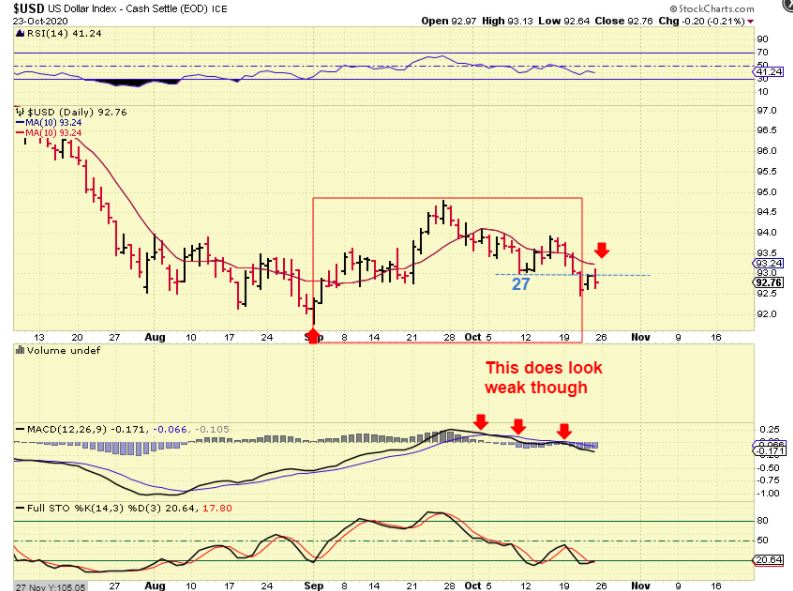
The USD Daily Chart looks to have broken a daily cycle low and that would mean the the USD has failed on the 2nd daily cycle already. That also means that the USD could now drop for months. This would be good for Gold rallying out of the next ICL. Lets discus this :
.
The USD FROM A MIDWEEK REPORT: This is important. The USD dropped below what I had labeled as the daily cycle low at day 27. That would be a failed daily cycle & lead to a lot of downside. This made me wonder:
1. Are we seeing a failed 2nd daily cycle already that peaked on day 4 (quite bullish for Gold)?
Or
2. Is this a very long first daily cycle on day 35?
.
3. US daily cycles tend to be shorter, so day 27 dcl makes sense, but I’ll leave the idea open that we may also be seeing a day 35 dcl.
.
US daily as of Friday – This does look weak and still represents a day 27 dcl, now failed. IF the USD breaks higher and above the 10sma again, then day 35 could be the dcl. We’ll see, but…
.
,
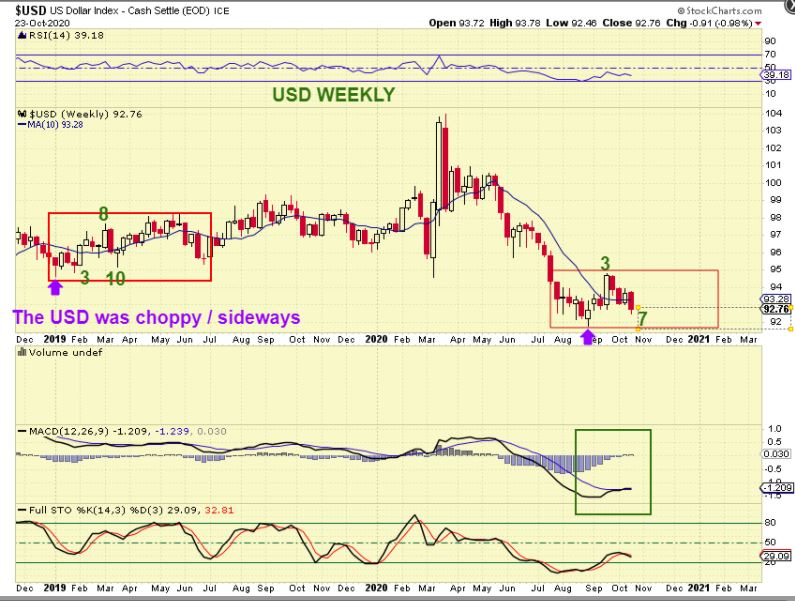
USD WEEKLY – I did notice one other thing with the USD that may be important to at least take a look at…
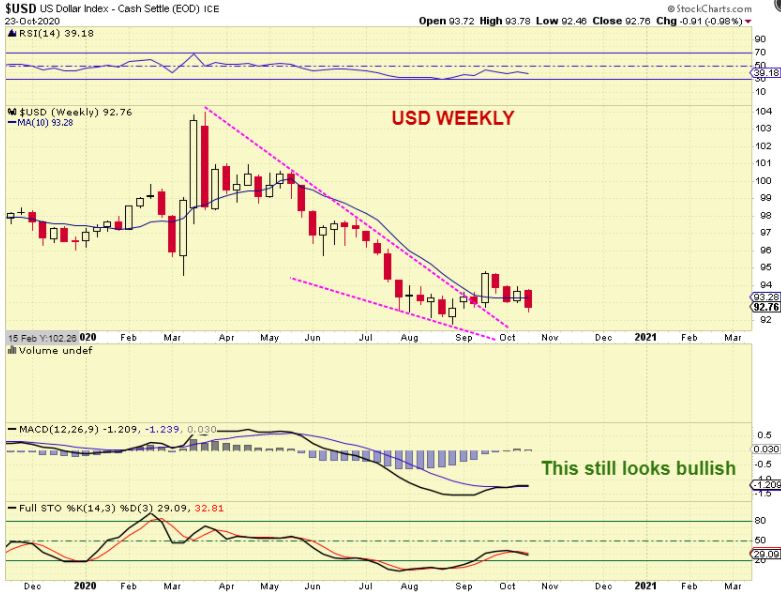
In 2019 the USD also rallied and dropped early on week 10, but from there it just bounced around sideways. The daily did not contain a failed daily cycle though, but if we have a day 35 dcl, it would look similar to this 2019 chop. If the USD holds up here for a few weeks chopping sideways, that could also allow Gold to drop to a final low ( ICL), so next let’s discuss how GOLD, SILVER, and The MINERS are currently set up.
.
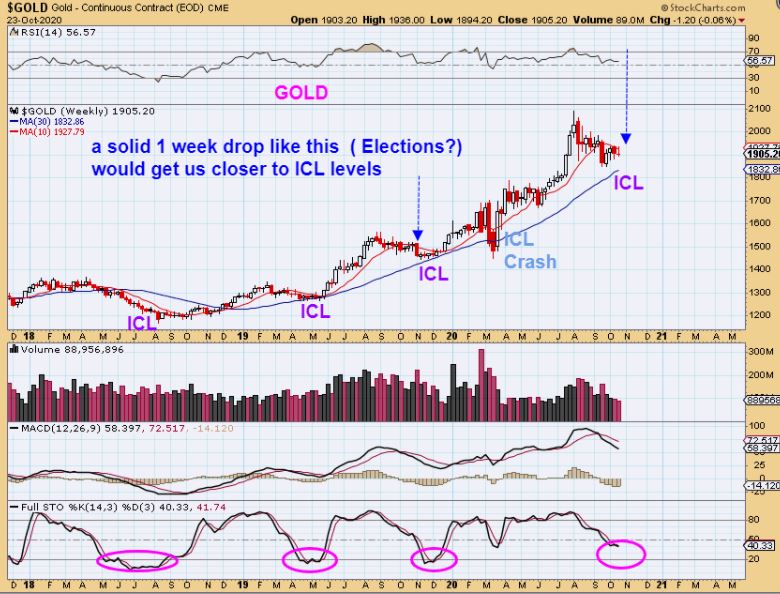
GOLD WEEKLY – If this were to play out the way Gold did in the 2008-2011 Bull run, it would have another week or 2 to drop to the blue line. This would lead to the US Election and the FOMC Mtg on Nov 5th.
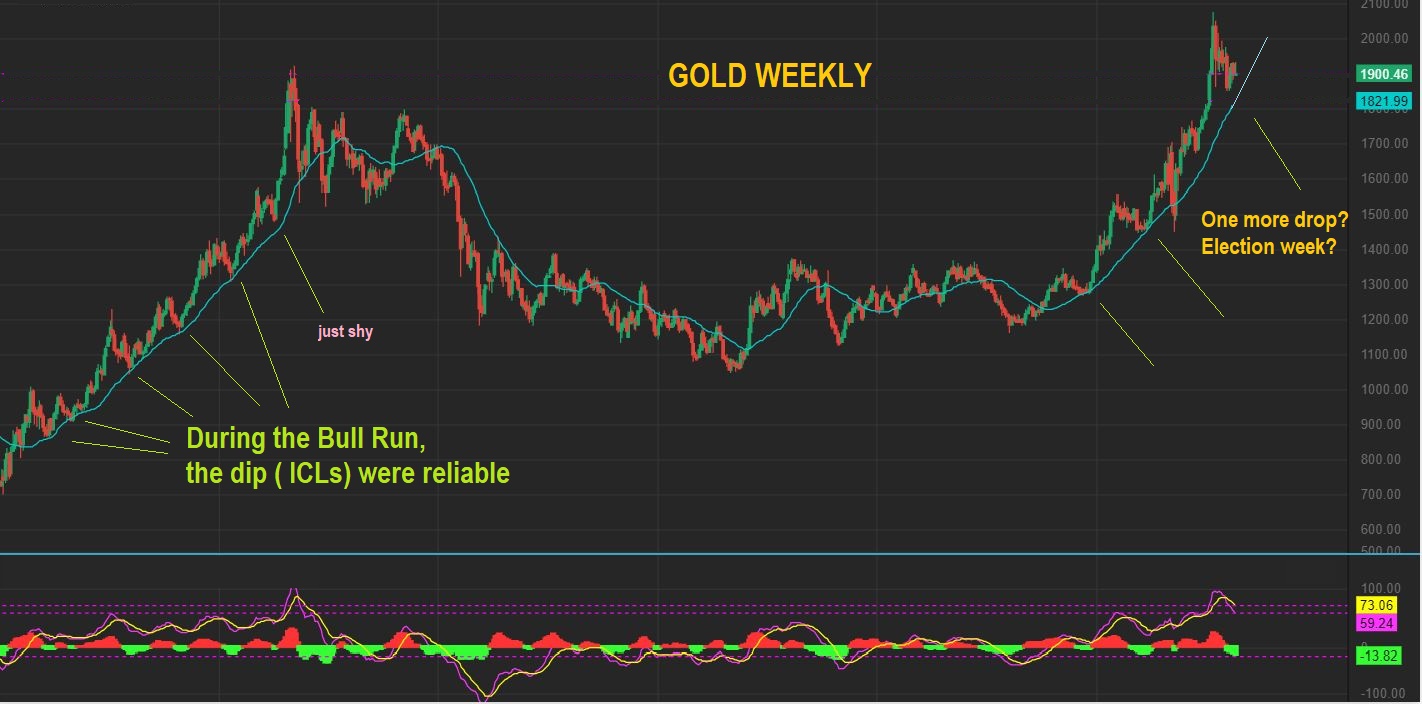
.
GOLD WEEKLY – I am pointing to a big 1 week drop ( first blue arrow) to show what we could see that the week of the elections and that would bring us to an ICL.
.
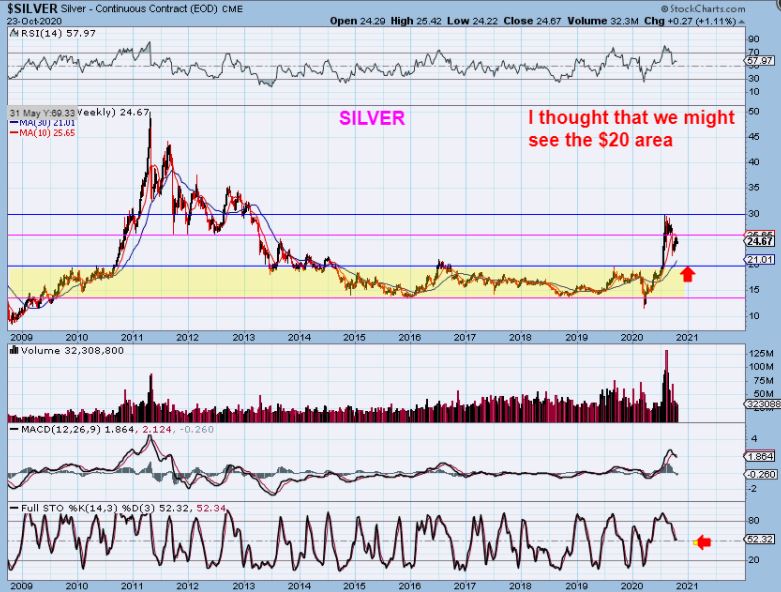
SILVER WEEKLY – I have discussed a possible drop to the $20 area. Silver remained at $24 this week. Can it still drop to $20?…
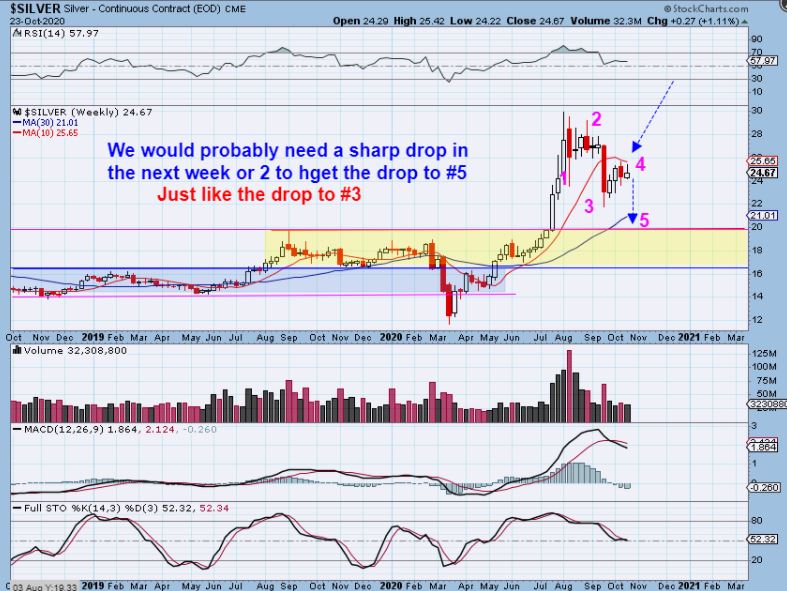
SILVER WEEKLY – Look at that large 1 week drop into the #3. A similar drop would get us to $20 as #5. We have the FOMC Mtg & US Elections at Nov 4 & 5, and we’ll see if either of those causes a reaction as it approaches.
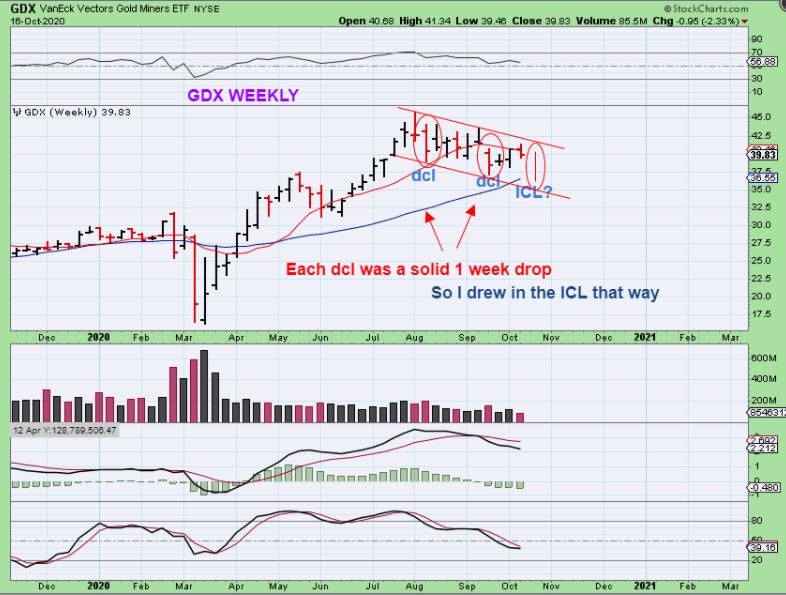
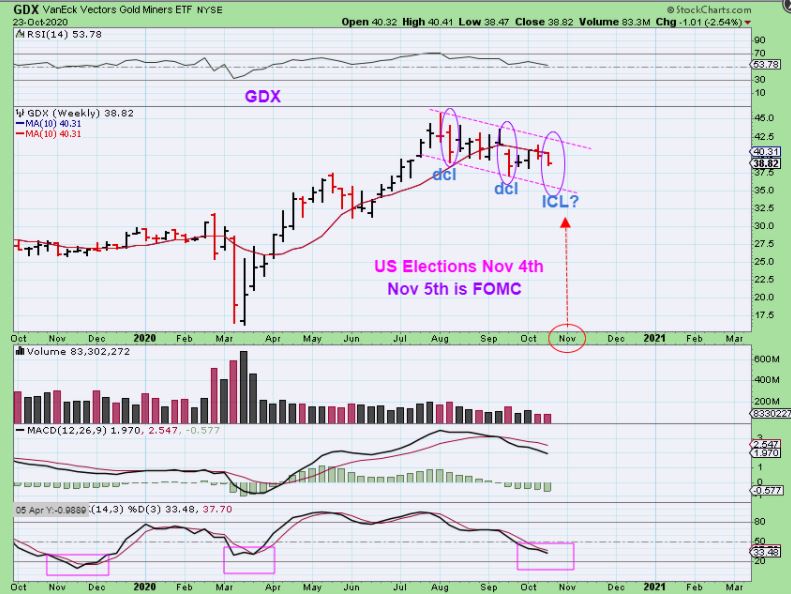
GDX WEEKLY – Last week I used this chart and drew up the GDX this way. I mentioned that a solid 1 week drop is not out of the question. We have seen those drops at the last 2 dcls, as shown here, so a drop like this could get us to the lower trend line. Did we drop like that?…
m
NOT QUITE.
.
GDX WEEKLY – We had a small one week drop of 2.5%, but notice that price was rejected at the overhead 10 week ma. We could get the rest of that drop as we head into the FOMC Mtg. We really just have to wait and see, but seeing this ahead of time is a good reminder of what could be ahead ( and it should be a great buying opportunity too).
.
Most of what we saw this week was what we expected going forward.
– The General Markets reversed higher near support as expected.
– Oil chopped sideways.
– The Precious Metals dropped down for the week, but maybe not as deeply as I would like to have seen.
– There was a chance that an ICL formed in Gold when we saw it break a downtrend line on a daily chart, but so far there is no follow through higher and the Miners remain weaker.
.
So what’s next? Its hard to know exactly how the US Election AND The FOMC Meeting will affect each sector, but those events are now only 1 1/2 weeks away, so we shall soon see. The Big Picture Weekend report does still give us a good idea of what could happen, we just need to allow the time to pass to see exactly how things unfold. What do I mean by that?
Well with Gold for example :
– Will we get a Precious Metals sell off into a low next week as we head into the Elections & FOMC Mtg?
– Or will the results of the election released on Nov 5th along with the FOMC MTG CAUSE the a slam down reaction into an ICL on Nov 5th, 6th, & 7th? We don’t know for sure. That remains to be seen, but so far with the way things are lined up, it would seem that we are very close to finding out. The next week or 2 could be a bit choppy and volatile as the uncertainty builds heading into that U.S. Election time period.
.’
For now? Rest up and enjoy the rest of your weekend! =)
.
~ALEX
.
BITCOIN -This was in a report this week to show that a measured target could get Bitcoin to the $13,868 area, though it might pause where it was at the blue horizontal line.
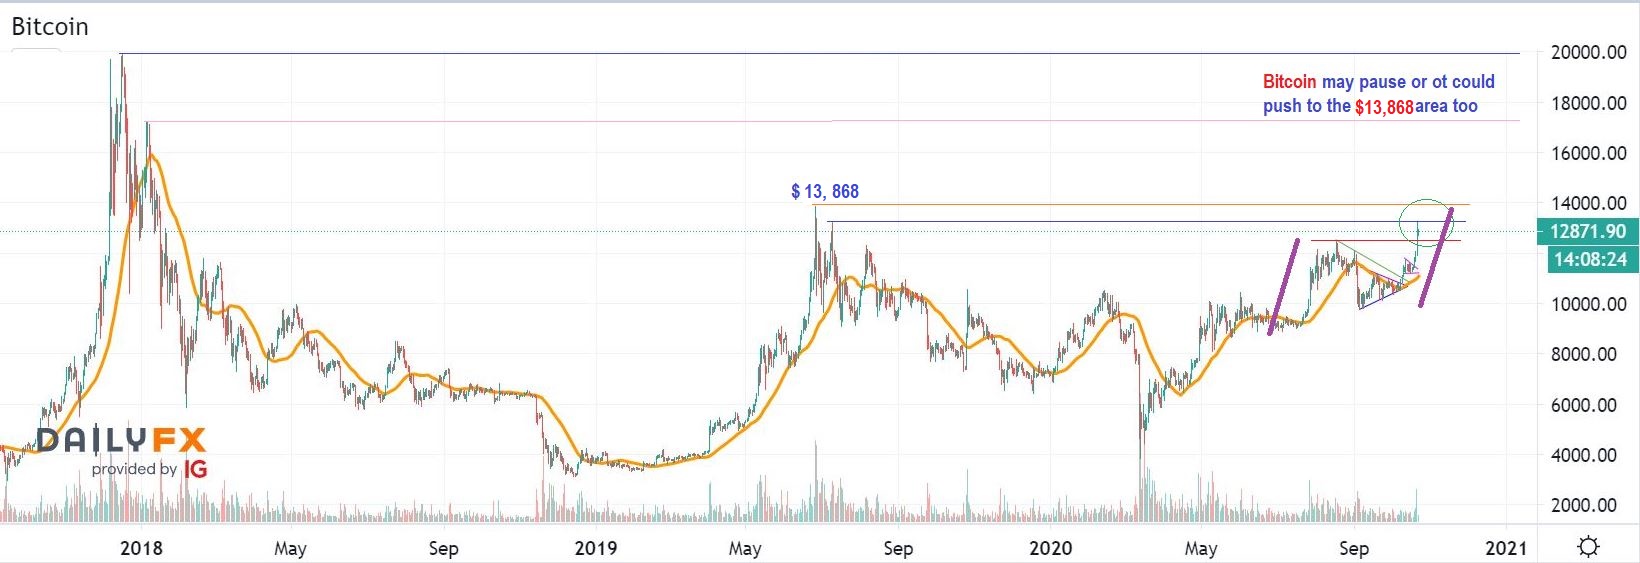
.
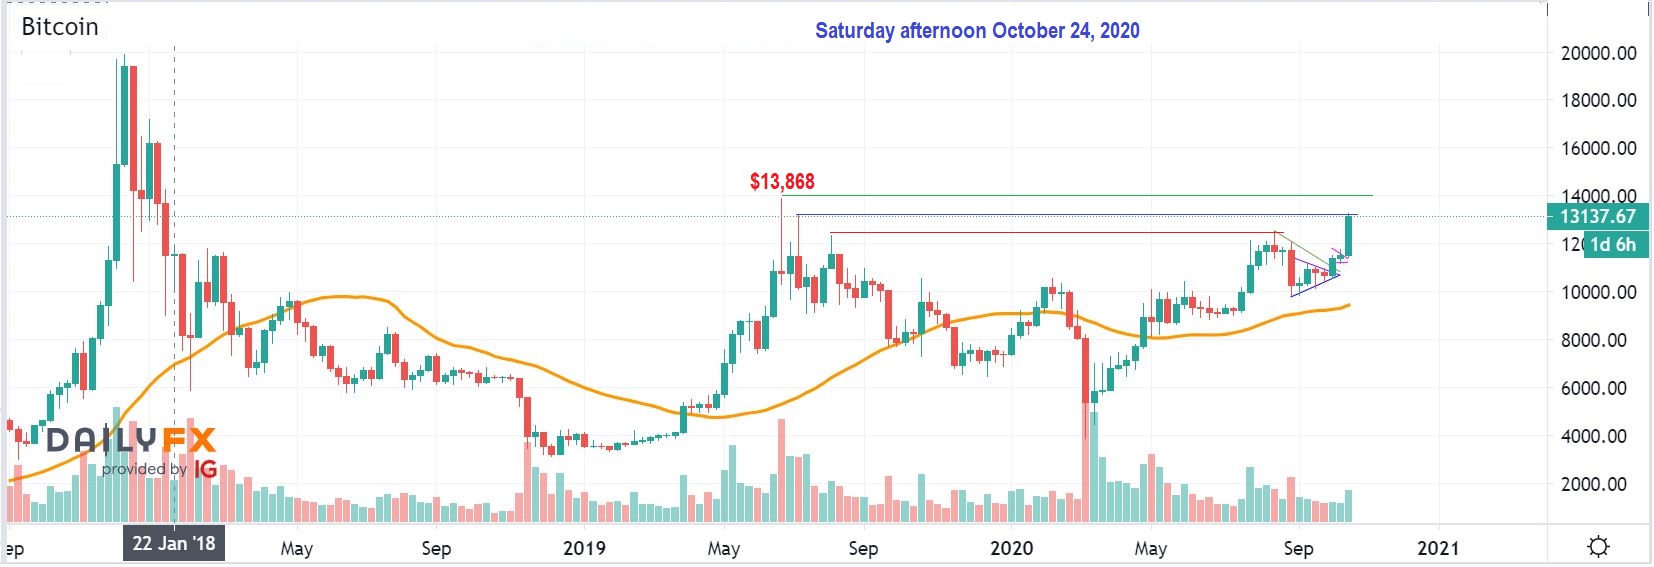
BITCOIN WEEKLY – Bitcoin dipped down on Friday, but the weekly chart shows us that Bitcoin is pushing higher. As I write this report Bitcoin is back at those recent midweek highs. Bitcoin remains Bullish.
.
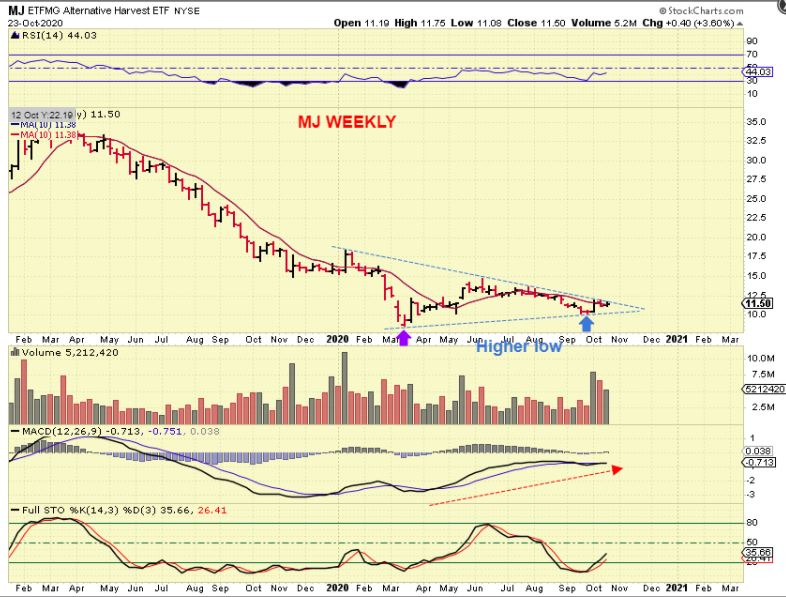
MJ ETF WEEKLY – The ‘Alternative Harvest’ and MJ Stocks were reported as setting up bullishly by me over the last couple of weeks too. The MJ ETF closed up 3.5% last week and looks ready to break out. The MACD is strong and volume has increased coming out of the lows. It also remains oversold on a weekly basis. This sector continues to look ready to move higher.