
October 17th Weekend Review – The Long And Winding Road
With my father in the hospital and several other things that need to be cared for, I have a little less time this weekend to write the longer 20-30 chart Weekend Big Picture Report that I usually do. The good news is that I have actually had a little extra time to study the charts while ‘waiting’ for my fathers X-Rays, Covid test, and various other tests to come back. That allowed me time to figure out how to put together a nice concise, yet clear and easy to understand weekend report with maybe 15 charts. Though it may be just a tad shorter than normal, this will be a very clear Big Picture Report when all is said and done.
.
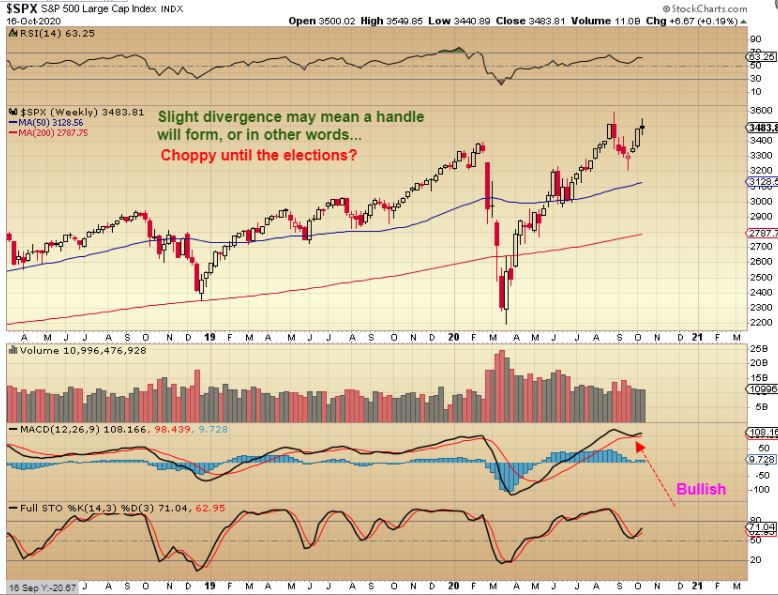
SPX WEEKLY – I discussed last week that I felt we have an ICL in place and would run back up to the highs, maybe new highs. I see very slight divergence at the highs, so that means that we may stall and put on a handle to this cup. For the General markets that would mean that we should expect possibly choppier trading heading into the US Elections.
Look at the Weekly chart of Oil here. After a run out of the ICL we have had choppy sideways trading after we reached resistance. 3 possible paths would cone from this.
1. We break out and rally to the next area of resistance (Green arrow)
2. We continue to chop sideways
3. Oil sells of after being rejected at this resistance (Red arrow).
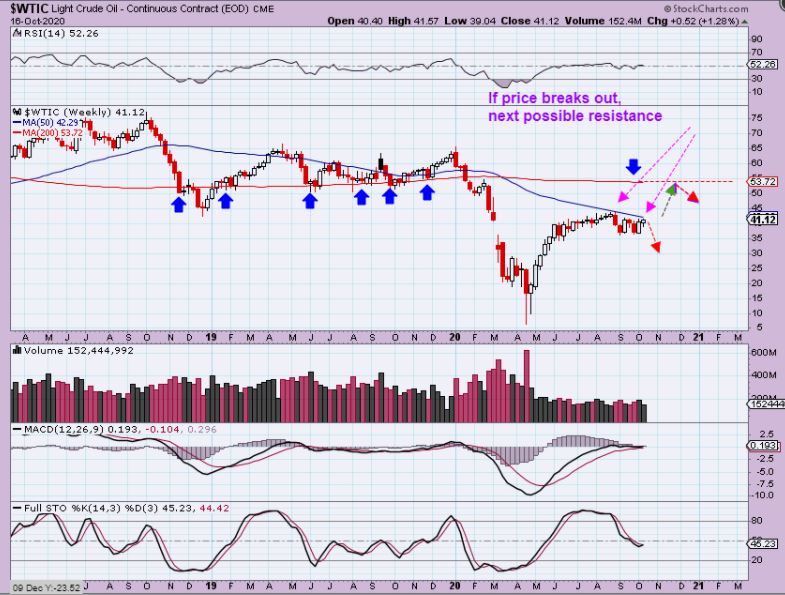
It’s not a really bearish set up , so I think we chop sideways or break higher over time.
.
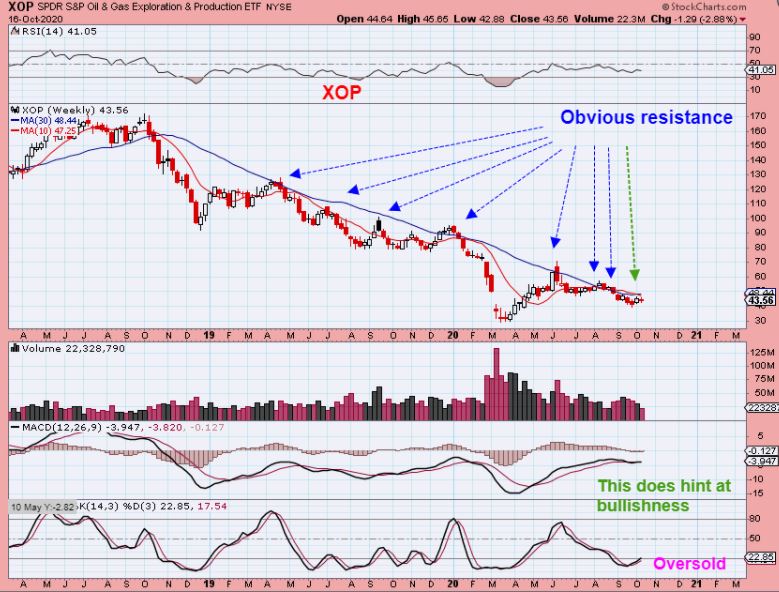
XOP WEEKLY – The Oil stocks are starting to look bullish on the daily charts, as pointed out in Fridays report. The weekly chart still has the XOP pinned under overhead resistance. A break out would be quite bullish, I will continue to monitor this sector in the daily charts.
.
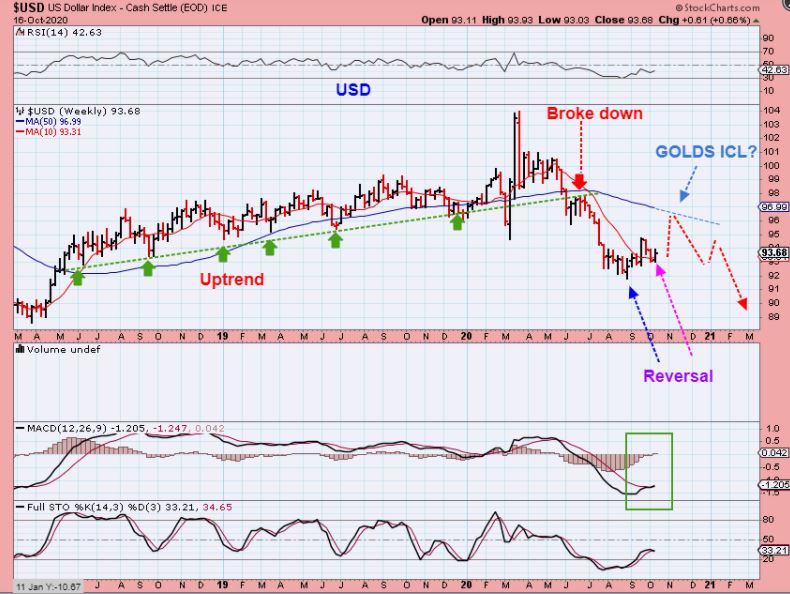
USD WEEKLY #1 – Let me describe what I see in the USD, please follow along on the chart.
1. Green arrows show the USD uptrend
2. Then it broke down (red arrow) and back tested, starting a downtrend/crash phase
3. An ICL Reversal was put in place as the USD Bottomed/Gold topped in August/September.
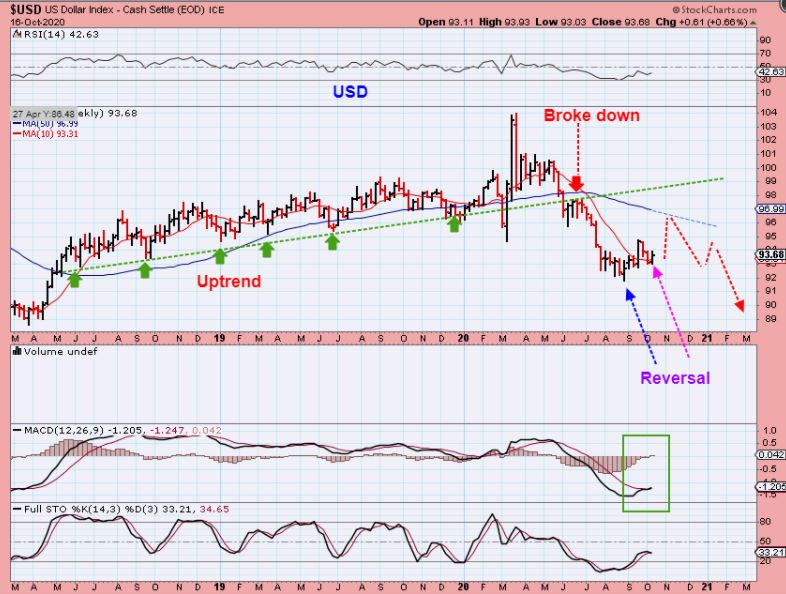
USD WEEKLY #2 – It makes sense that the USD would put in a dcl now and Golds bounce would top now.
1. This weeks reversal could run to the 30 or 50 week ma as shown
2. Gold would then drop to an ICL, see the chart .
3. This is still what seems to be the most likely scenario, even though Gold broke a down trend line and some Miners are rallying. Let’s look at GOLD…
.
GOLD WEEKLY – I have pointed out that past ICLs were sideways drift and eventually the stochastics reached oversold. Price made it down to the blue line then and we would be there with 1 more drop. This matches the USD pop, Gold Drop to an ICL scenario and I have to view it as very likely. This would still be a very bullish ( and beautiful ) Chart.
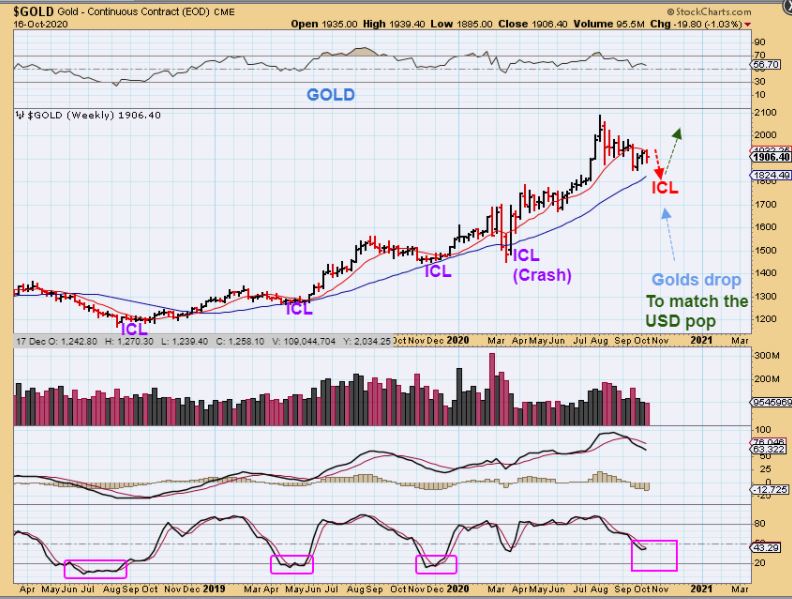
Same Chart: If there is already an ICL in place for Gold, it would likely just ch0p along sideways until that blue line catches up to price.
.
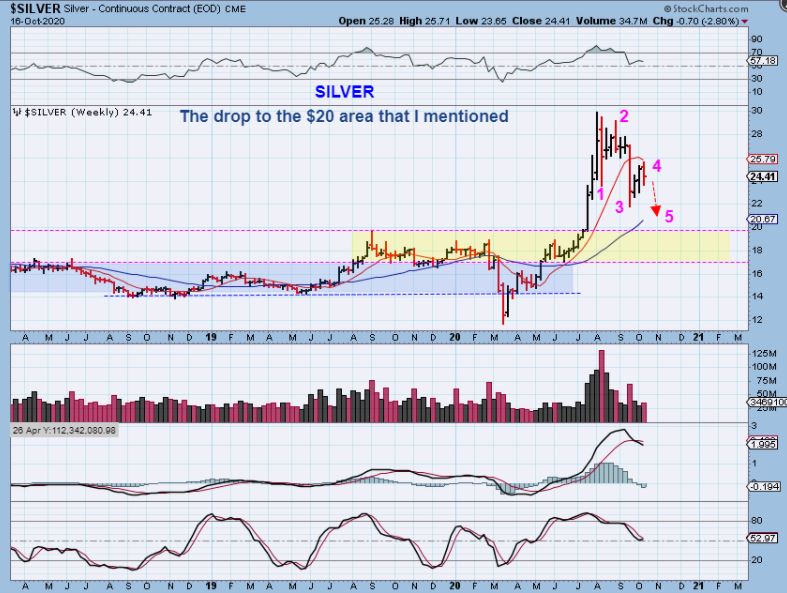
SILVER WEEKLY – At the end of September and early October I used this chart on OCT 2nd I discussed a possible drop completing down in the $20 support area.
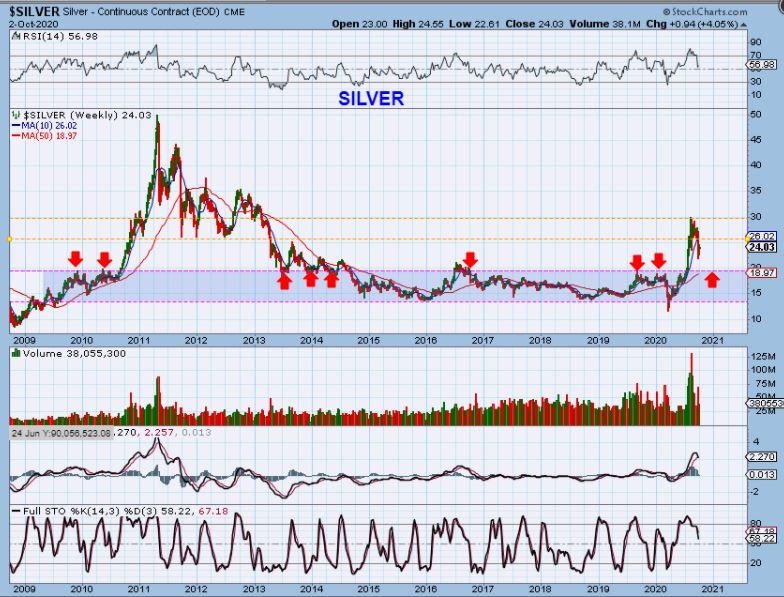
SILVER WEEKLY – LAST WEEK NOTHING CHANGED FROM THAT IDEA, EVEN THOUGH SILVER BOUNCED TO THAT $25 AREA. A drop to the $20 Support was likely unless this recovered the $26 area.
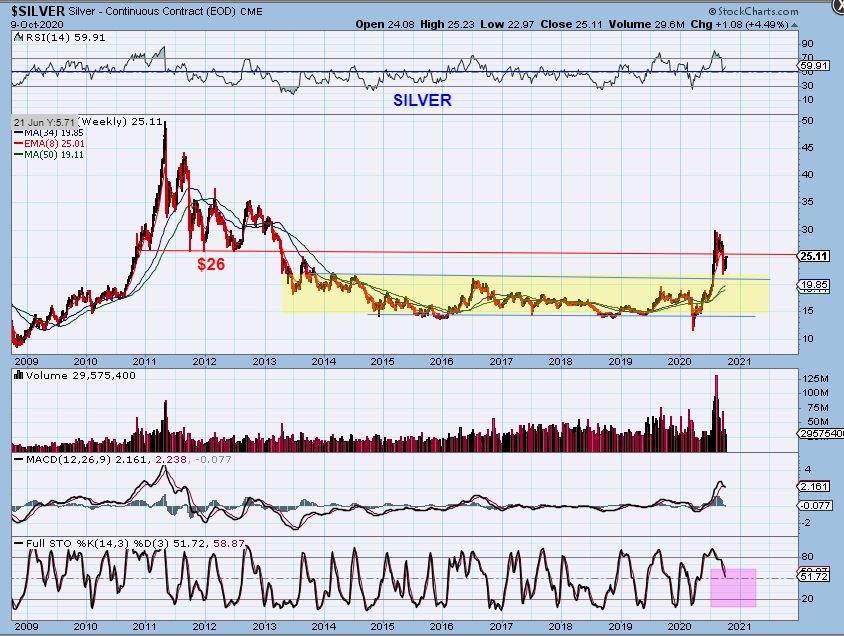
SILVER WEEKLY -So I’ll just do a close up this week and we see that Silver reversed or was rejected at the overhead 10 week ma. I can easily see how a 5 wave kind of a drop could bring Silver down to the $20 area, can’t you? This fits my idea from weeks ago that Silver could drop to the $20 area.
.
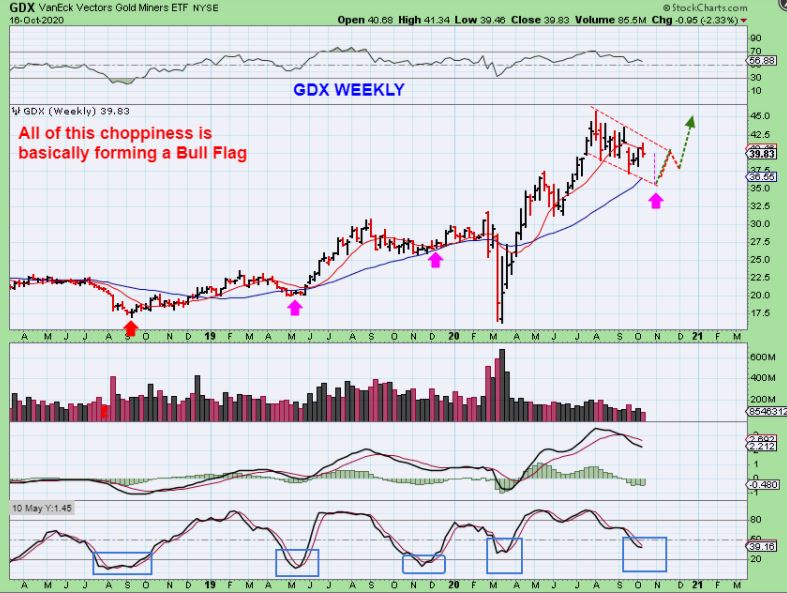
I do want to say that the daily cycle for GDX peaked on day 14 this week and is now on day 16. THAT seems strong for a 5th or final daily cycle-so it did seem that maybe GOLD & THE MINERS could be in a choppy first daily cycle. I see both signs of strength & weakness. That said, the weekly chart looks Bullish yet 1 more drop would add to the bullishness of a bull flag, so let’s just discuss the big picture.
.
GDX WEEKLY #1 – Let’s just start by saying that this recent choppiness gave us a weekly Bull Flag. I can picture one more quick drop not only as not damaging the chart, but also as completing the Bull Flag to support. Now look at the stochastics and you see that another drop would help it reach normal oversold conditions too. WE COULD GET 1 MORE DROP.
.
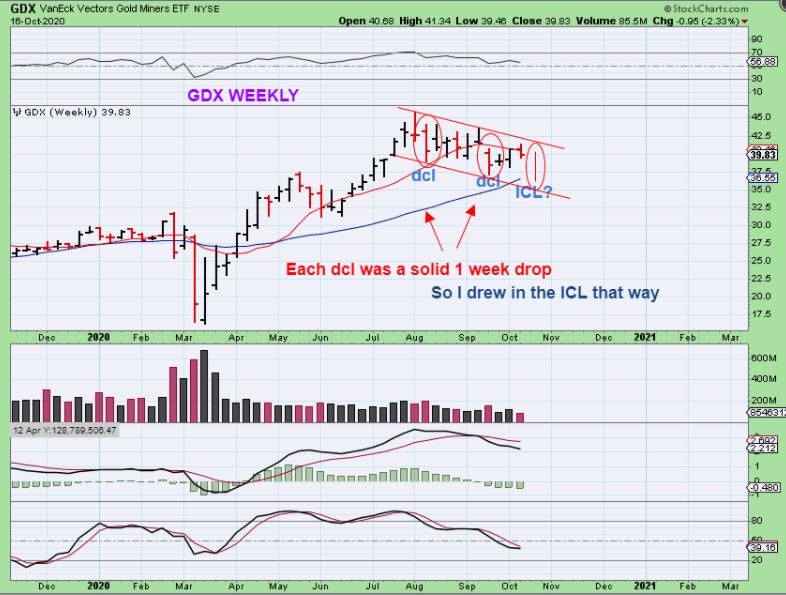
GDX WEEKLY – Each of those larger 1 week drops were what caused a dcl to form. One more is not out of the question. If it breaks the Oct dcl lows, it is an ICL. If it drops and doesn’t break those lows, this may be a first dcl and a very choppy first daily cycle. So…
SAMECHART: I also am looking at the daily chart and see that we are only on day 16. To me that means that if we drop into an ICL, the bigger 1 week drop may not be next week, but it could happen the week after ( leading into the U.S. Elections). THAT makes sense too., and helps this chart to reach oversold.
.
We didn’t see a lot change this week, things do seem to still be on track. I hope you all enjoy your weekend!
.
~ALEX

