Weekend Report: The Pieces Come Together
I would have to say that our expectations for the Markets have been playing out rather well for months. From Rallies to Peaks and then on to expecting dips to a DCL or ICL- we have seen the bigger picture playing out as expected up to this point with slight variations along the way. As time continues on, obviously choppiness can blur the picture a bit, but soon enough the sideways chop becomes directional ( Breaking higher or lower) and that helps the Big Picture to become even more clear.
Well, I have expected a dcl to form by now in the General Markets ( 60+ days is a long daily cycle), but confirmation above the 10sma has been on hold. I think that changed Friday and we will see move higher next week. We also expected the dip to an ICL in Gold, Silver and the Miners after 6 months or so, and we got a quick sell off recently. What is next? Was that an ICL or just another dcl? As time moves forward, some of the pieces just really start to fit together and that’s when things begin to really add up, leading to a much clearer picture. I think that you will see in this report that we are getting a clearer picture as time goes on.
.
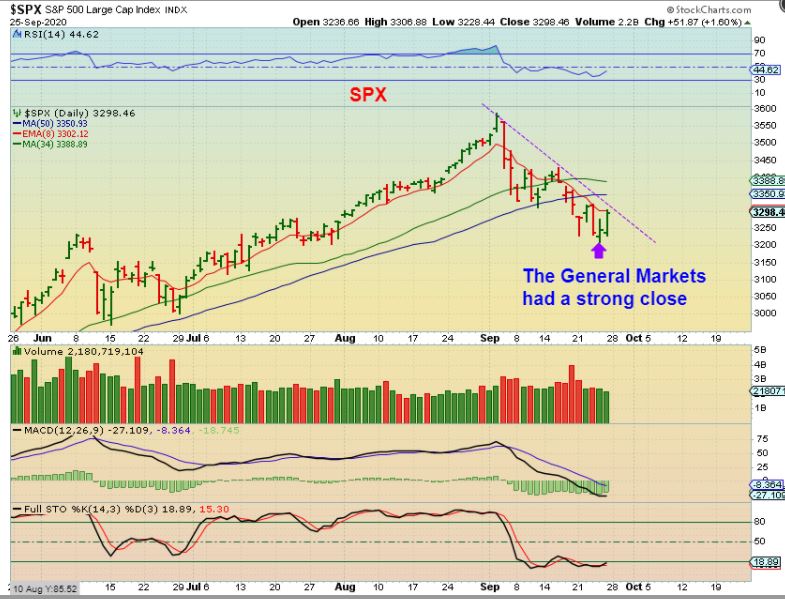
SPX DAILY – We saw the markets climb a bit Friday morning, chop sideways and then we got a strong push to the highs of the day. Is this swing low going to be the dcl? I think that it is . Why? …
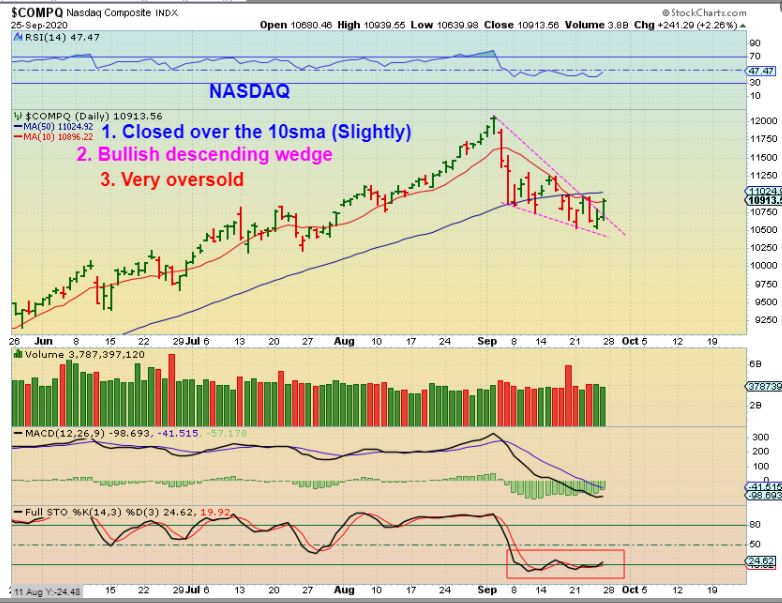
The NASDAQ DAILY actually did close slightly above the 10sma and we have a Bullish Descending Wedge break out. Notice how oversold the General Markets are too. Last week I mentioned many bullish looking tech set ups ( for example: SQ, COUP, TWTR, AMD, APPS, WORK, DOCU, ZM, UBER, etc) and they may finally get the follow through higher next week. Watch for a break above the 50 sma with the Nasdaq too.
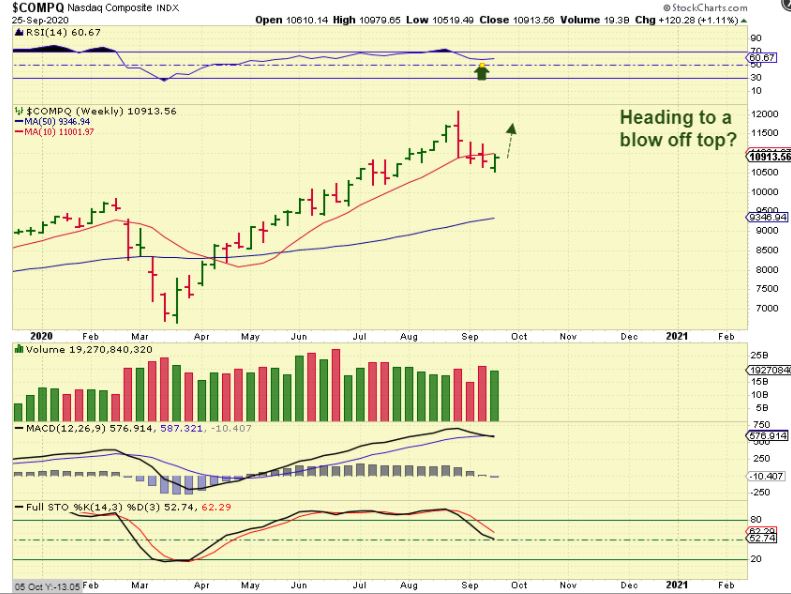
THE NASDAQ WEEKLY REVERSAL adds to the idea that a low has been put in place. Now we’ll look for additional blow off top movement, or a weaker double top, stall and chop, that could roll over into an ICL drop?
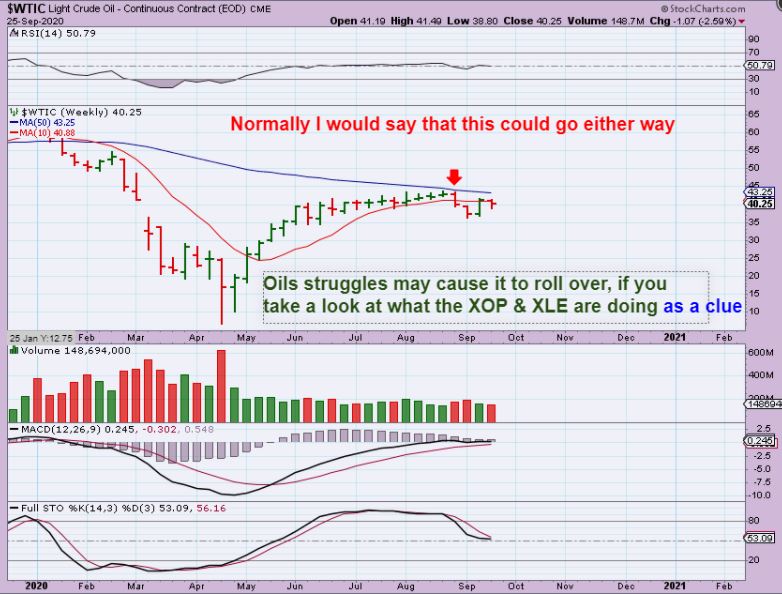
WTIC WEEKLY – If I was just looking at Oil, I would say that it stalled at the resistance and could break out higher or drop. It could go either way, but at this point I think that Oil is not going to break out higher. Read the chart.
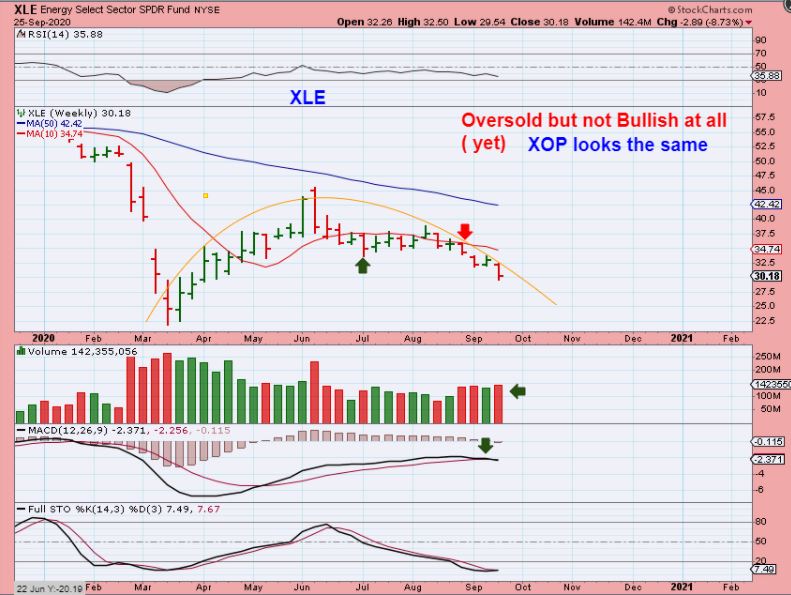
XLE ( & XOP) WEEKLY – This is certainly not indicating that smart money thinks Oil is going higher.
.
THIS IS WHERE SOME OF THE PIECES OF THE PUZZLE MAY HELP ME TO DRAW A CONCLUSION ON THE PRECIOUS METALS MARKET. PLEASE DON’T SHOOT THE MESSENGER!
.
USD WEEKLY – Recently I said that the USD put in a dcl and it could be an ICL, which would Top Gold for now. This week the USD burst out of that base and an ICL is in place. We have to take note that:
1. THE USD POPPED SHARPLY
2. GOLD & SILVER DROPPED SHARPLY
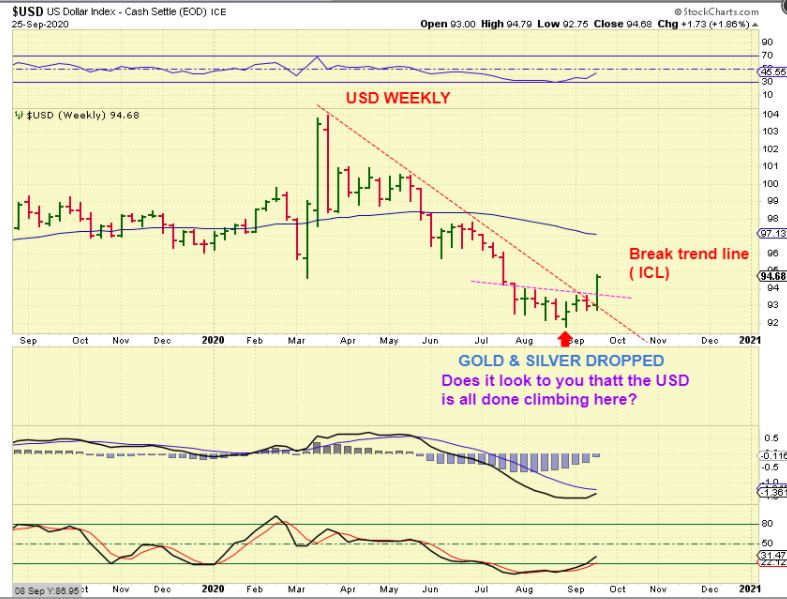
SAME CHART: QUESTION TO YOU: AS AN ICL, DOES THIS MOVE LOOK LIKE IT IS DONE? NO, so how do you think that move higher could affect Gold? Please read the chart.
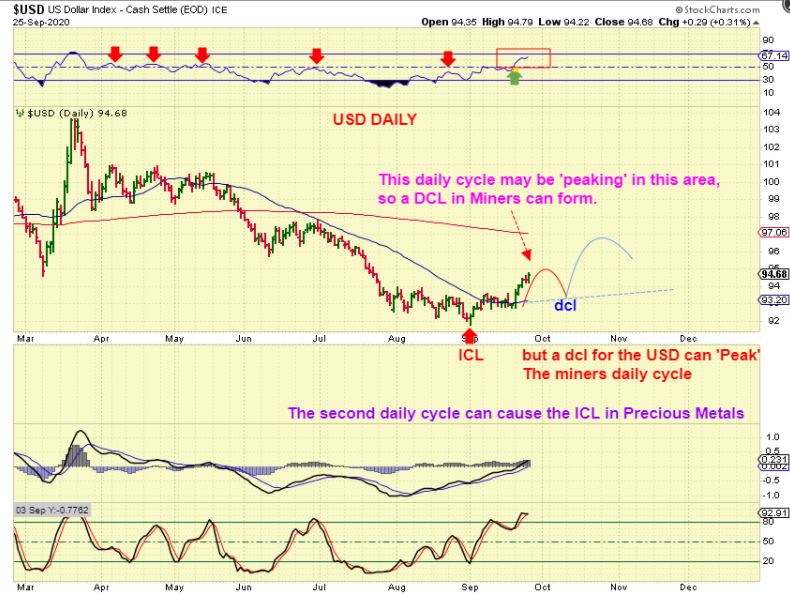
USD DAILY -We are now actually coming due for a dip to the dcl. To me, that means that this is most likely to happen:
1. The USD popped out of an ICL, Gold dropped.
2. The USD now dips to a dcl, Gold puts in a dcl & reverses higher.
3. Since that was only the 1st daily cycle for the USD, the next daily cycle will also be strong, so …
4. Golds next daily cycle could peak early again and become a final daily cycle that will be weak (L.T.) . A drop to the ICL may still be ahead.
Now with that laid out as a possibility ( Again, don’t shoot the messenger, I need to report what I see as likely), it would be good for us to look at the Precious Metals sector with an open mind and see if THAT above possibility matches our current chart set ups for Gold, Silver, and the Miners? Unbiased & unemotionally, we will take a look.
.
GOLD WEEKLY #1 – Does this drop look complete right here if the USD bounces? Not really.
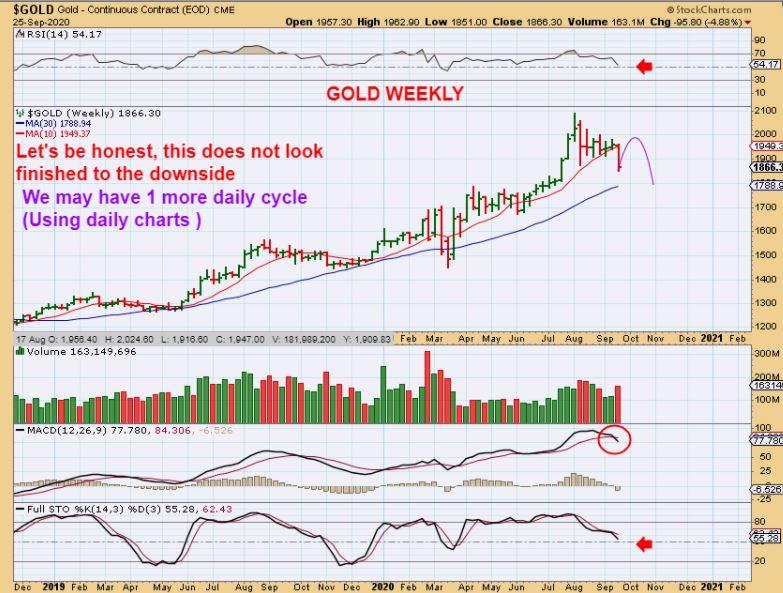
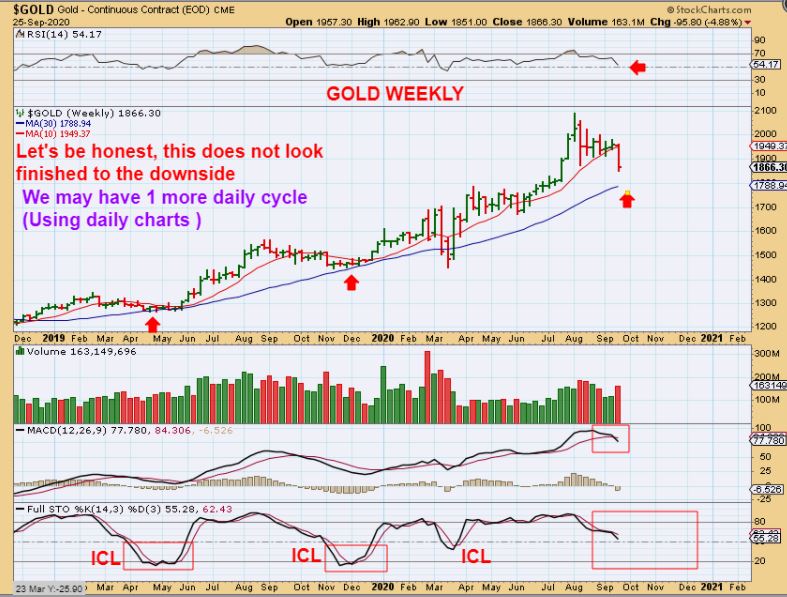
GOLD WEEKLY #2 – Just have a look at the stochastics for prior ICLs. The weekly MACD has crossed under. It does look like we could get some more weakness after a bounce.
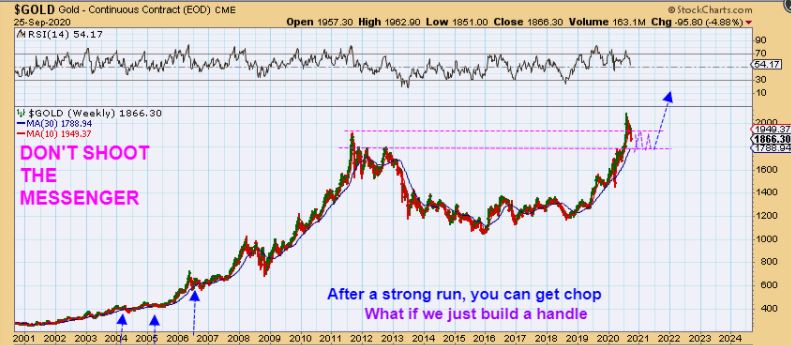
GOLD WEEKLY – The Big picture is where I have already pointed out that a Giant Cup would form, and then a handle may need to be formed too. How does a handle form? Basically you see Sideways chop for weeks and weeks.
SILVER WEEKLY – I pointed out this drop on a chart Midweek when Silver dropped to $24.50 too. We have been seeing Silver holding up around $26 week after week, but now this week it closed at $23. I said then that the $20 support level is possible if we just drop straight to an ICL now. Think about that- We lost $3 last week, so we could lose $3 next week and be easily there. By the way: The low this week was already $21.81.
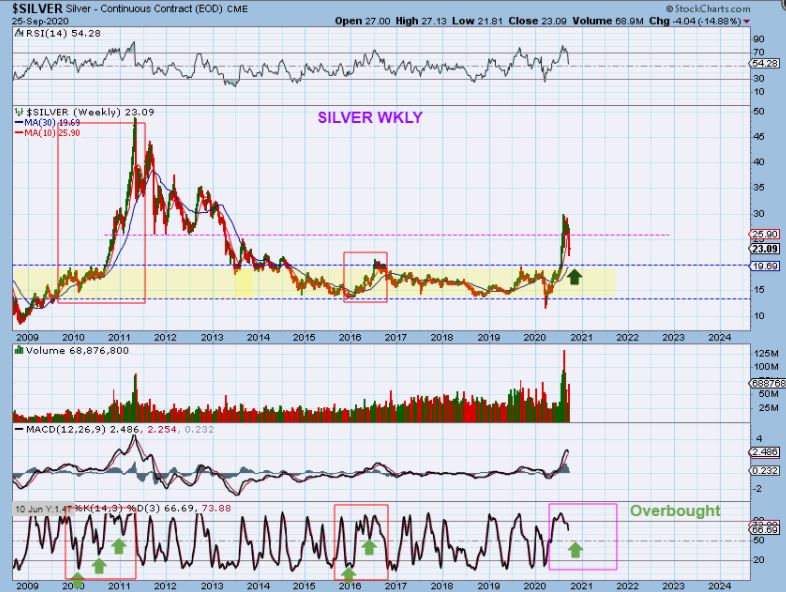
SAME CHART SILVER WEEKLY – So now realize that we dropped from a high of $27.13 last week to a low of $21.81, yet we aren’t at the next support. Can you picture the USD dipping to a dcl next week and silver bouncing out of a dcl here on day 31, yet still only putting in a weak bounce & then dropping lower to $20 or so? I can. Look at the stochastics
.
SAME CHART AGAIN: Look at the stochastics. Even in strong bull runs like 2010 & 2016, the ICL dip dropped that stochastics to the 50 area at least. Though we look ready for a possible dcl on the daily charts, these charts do seem to indicate that more selling is ahead after a bounce.
.
REMINDER: IT SHOULD NOT BE A SURPRISE TO YOU THAT I AM THINKING THAT SILVER COULD SELL OFF FURTHER: The next few charts were reports last weeks.
.
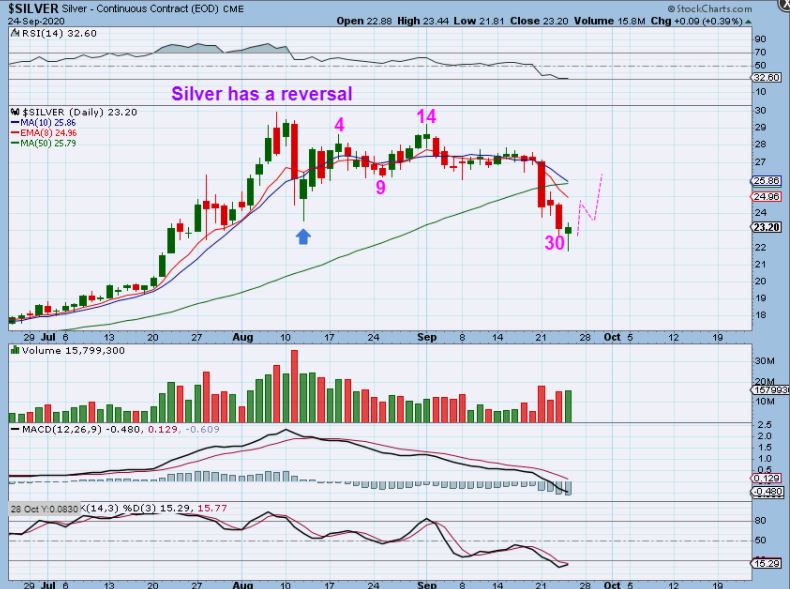
SILVER has a pretty good looking reversal candle on day 30 here. It could be the DCL too, but…
.
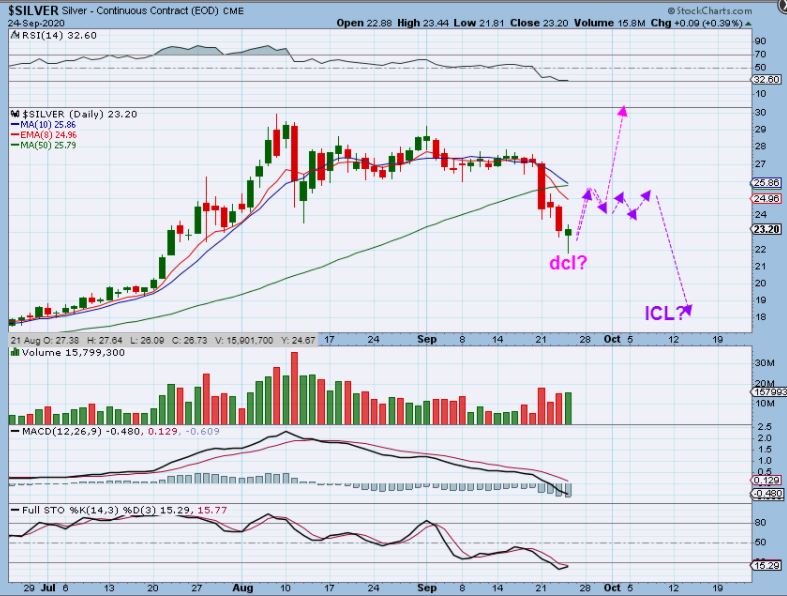
THIS IS THE REAL QUESTION, DCL or ICL? IT WILL ONLY BE ANSWERED BY TIME:
.
FROM LAST WEEK: SILVER SEPT 24 – If this is the DCL, is it also The ICL? If so, it can lead to the next run higher like the Magenta line, but if the ICL is still ahead? It could become a choppy daily cycle just like the last daily cycle & then drop into the real ICL as shown here with a purple line. A reversal candle like this can be a ‘buy’ in technical analysis, but use a stop under that reversal candle low. If you are using Cycles rules – you wait for confirmation with a close above the 10 sma.
.
Now to the Miners:
,
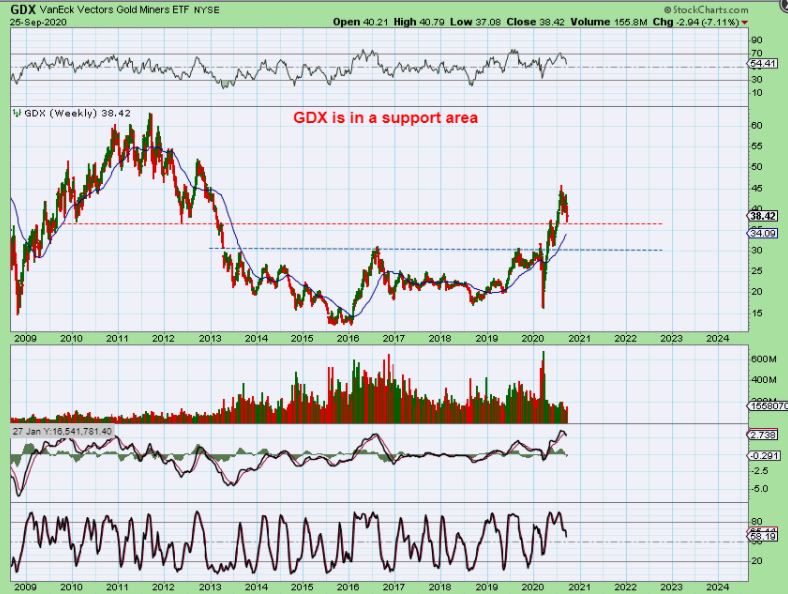
GDX is a little bit different. I could look at this chart and feel that possibly we have seen enough selling, but the USD looks like it is strong again. That said, I also can make the case for further selling now or after a dcl bounce peaks.
.
For the sake of this discussion: Just moving forward with the idea that
– GOLD & SILVER both look like they should sell off further and
– The USD put in an ICL and will continue higher for at least another month,
– How might GDX react to that Gold & Silver selling?
.
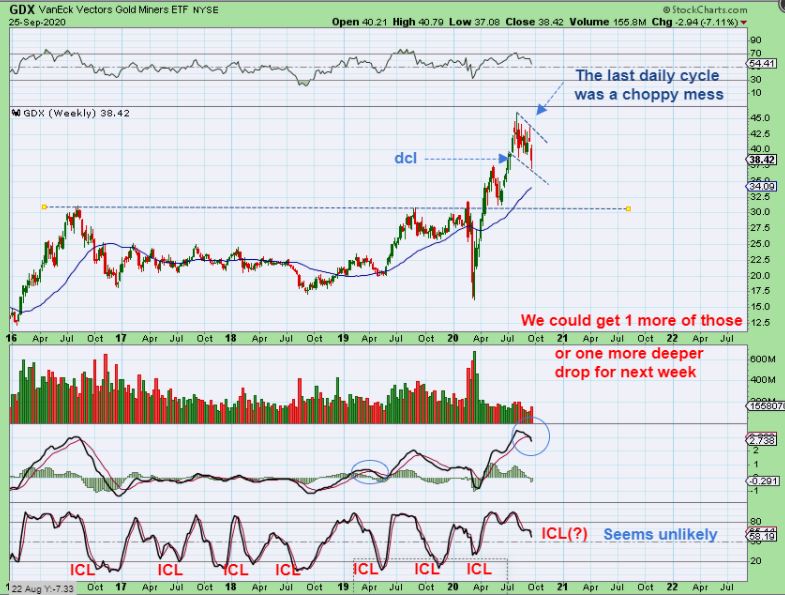
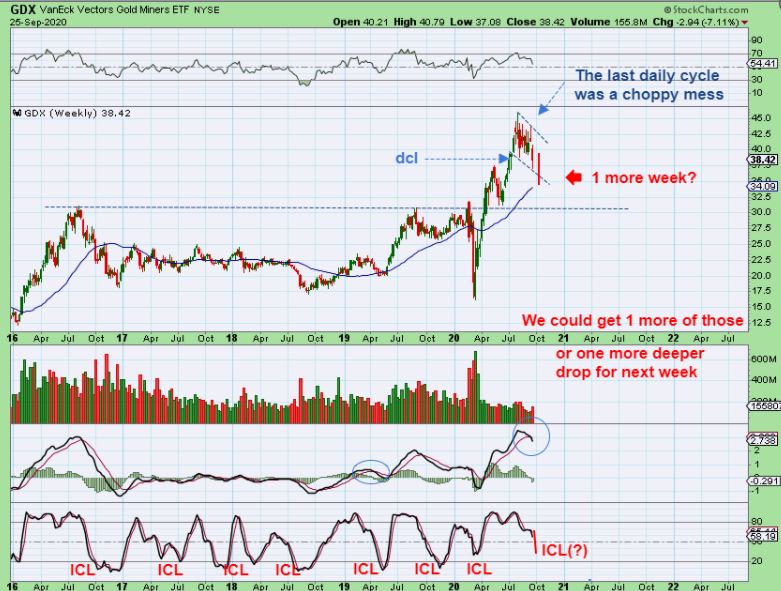
GDX #2 – Using a big picture view, you can see that the last daily cycle was sideways choppy and gave way at the end in a sharp drop this week. Also…
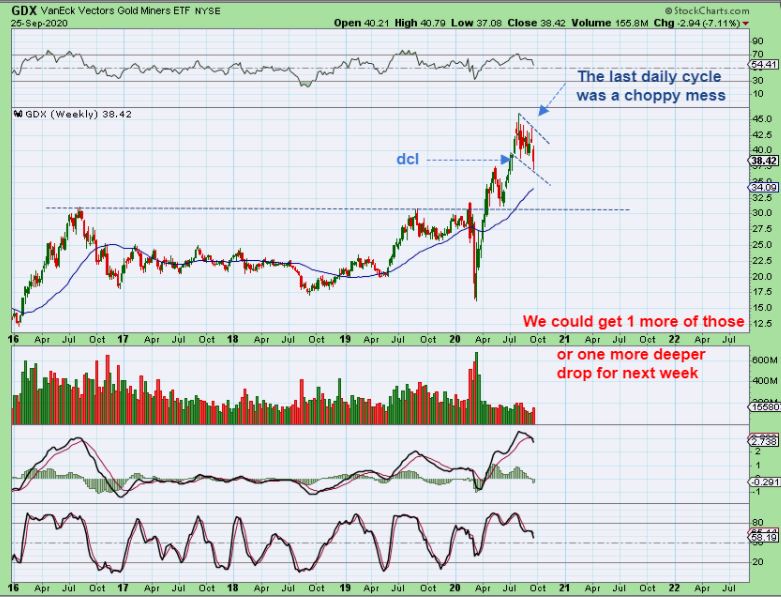
GDX – look at the MACD crossing down and look at the Stochastics at past ICLs vs now. It does indicate that more selling is very possible. What Might that look like after discussing all of this?
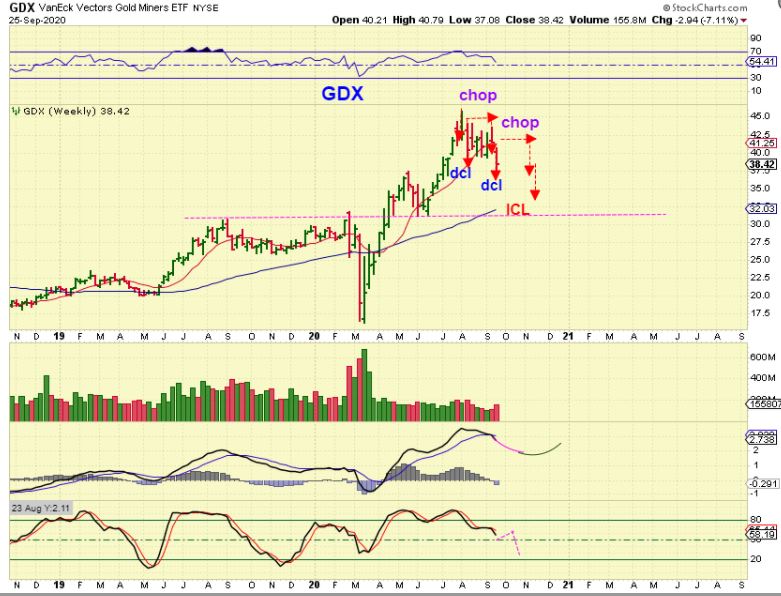
GDX – If we get a repeat of that Choppy daily cycle and a sharp drop, the Miners could chop sideways as the USD dips to a dcl & then GDX would drop as the USD finds its dcl. GDX would then be ready for a great buying opportunity by the end of October, early November (U.S. Elections?).
.
THIS IDEA OF ANOTHER DAILY CYCLE SHOULD NOT SURPRISE ANYONE HERE. I HAVE BEEN POINTING THAT OUT ALL ALONG.
.
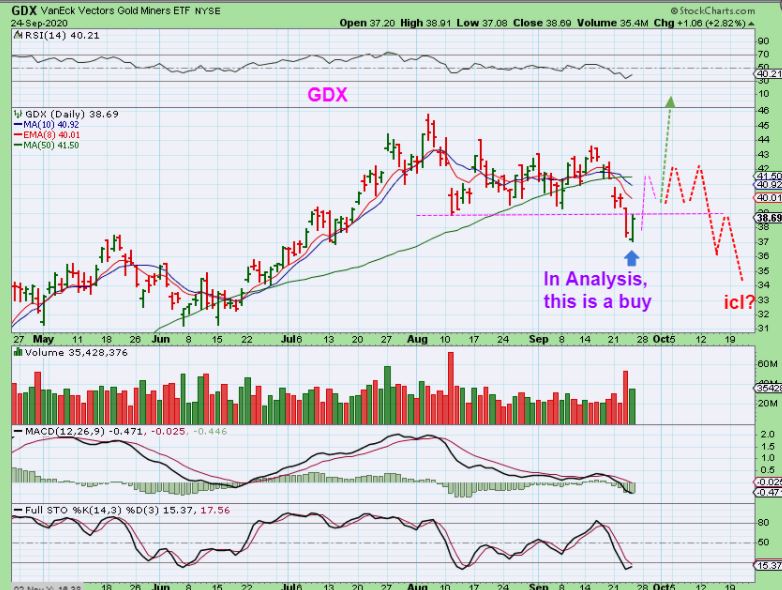
THIS WAS IN FRIDAYS REPORT: I just want you to know that we may have a dcl here, and I will do some buying, but it could become a short term trade, The chart below is an idea of choppiness that definitely would not surprise me. It would be another boring daily cycle that falls apart. Do not look at the ‘time’ of the ICL, it would likely be in October, I just drew this as a quick visual .
.
I ALSO DREW THIS GDX CHART FOR A REPORT LAST WEEK:
.
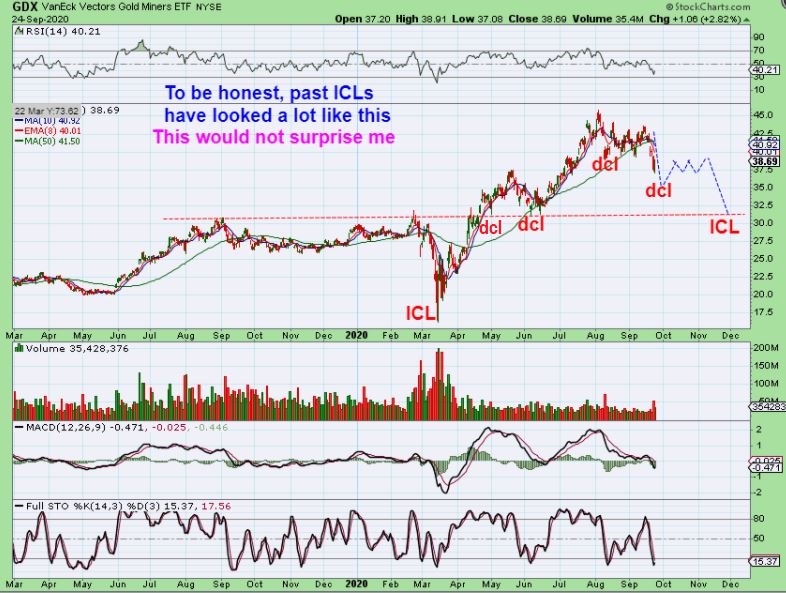
This could be the dcl, and the next daily cycle would be like the last one. A choppy sideways daily cycle, and then we drop into the ICL.
So that idea should not be coming as a surprise to anyone, and please understand that some Miners may pop out of the gate looking very strong too. They did at the last dcl, didn’t they? It may convince some that we just put in an ICL, but time will tell and you’ll need to use stops on new positions. I will monitor everything day to day for clues.
.
ALTERNATIVE THOUGHT (least likely at this point): If we were completely ignoring the USD, I would say that Gold, Silver,and the Miners could also just sell off sharply next week into the ICL. Why? That low was on day 31, so another week of selling to a new low would be very possible.
.
ACTUALLY : A final plunge next week as drawn here would absolutely make sense for Gold, Silver, and the Miners, and I even wish it were what we see next week. This would be a finish off drop into the ICL for day 36 or so, and we could go very heavily Long, but the USD is adding another piece to the puzzle. When that USD popped, Miners dropped. The USD formed an ICL, and it seems to indicate strength for at least another month, and therefore weakness in precious metals.
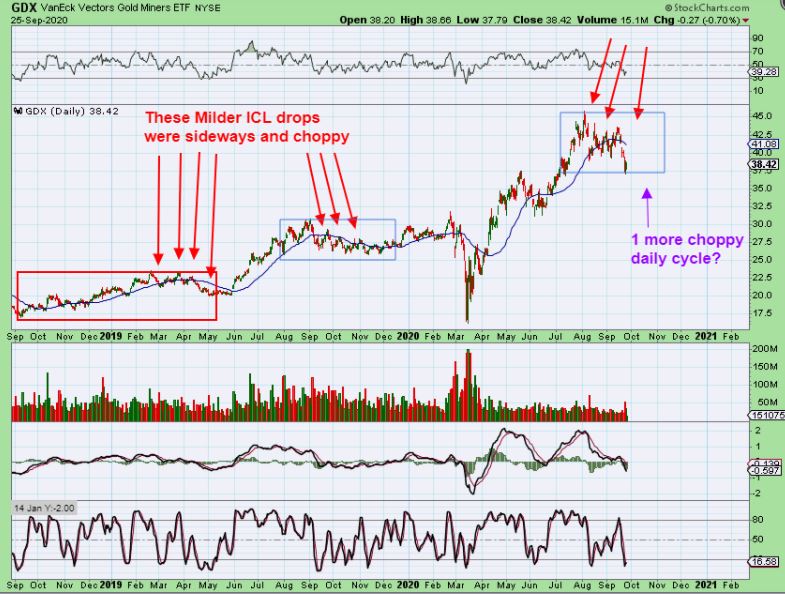
Take note of this for GDX – Even past drops into the ICL that were mild seemed to last for several weeks and stretch out to 2 or 3 daily cycles of chop, boring us traders to tears.
.
So after this weeks market action, things seem to be even clearer.
– The General Markets do look set up to move higher and there are still many tech Stocks that look bullish. We just need to remember that this move may roll over eventually as L.T. and a top will be in place for the General Markets. So the Markets may top around the time of the US Elections.
– Oil is not as clear, but the Oil sector with the XLE & XOP clearly are not buying the oil strength lately. Oil may follow and sell off soon.
– The USD put in an ICL. As soon as it popped form the base lows, Gold, Silver, and the Miners collapsed. Now their daily cycles seem to be in opposite phases and that helps to clarify the possibilities going forward. The USD may now peak & drop to a dcl, and Miners may have bottomed and should move up from a dcl.
– Gold, Silver, and the Miners dropped as the USD popped too. They are perfectly within their timing to form a dcl at day 31. Was that sharp drop an ICL? I have to say that with the USD putting in an ICL, it is not likely to be the final lows. I think that we will see at least 2 strong daily cycles for the USD, and 2 weak daily cycles lower after peaking in August. 1 down and 1 to go.
.
Remember, in a civilized society, we don’t shoot the messenger, 🙂 since he also may not like the message that he is bringing! I simply have to report exactly what I am seeing when I analyze the charts. At a DCL, we can ‘Buy’ with stops, proceed with caution, and Stay frosty again my friends! Thanks for being her and I hope that you are all enjoying your weekend!
.
~ALEX
.
I just want to post 2 Covid Vaccine Candidates with bullish set ups in the weekend report, so that any that may want to enter can think about taking position on Monday morning, rather than waiting until the release of the next report Tuesday morning.
.
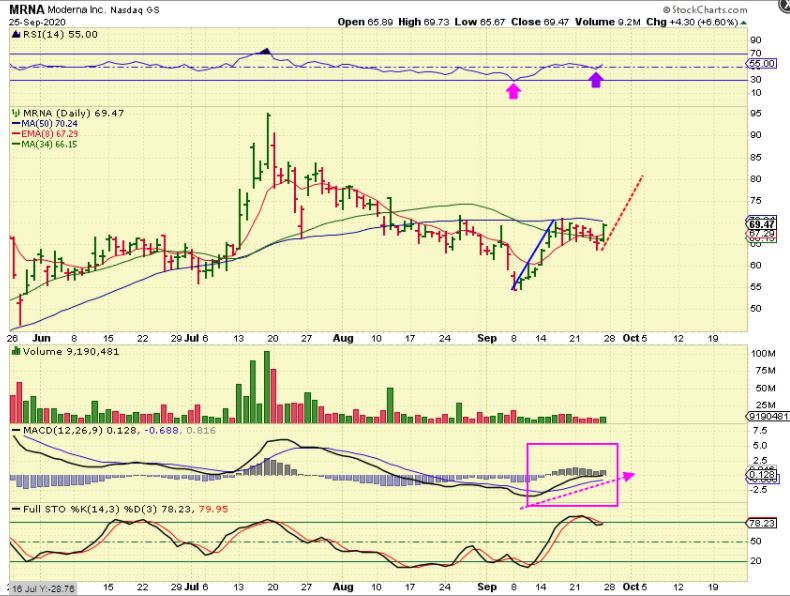
MRNA DAILY – I like that the RSI already curled back above 50 and the MACD is steeply slanted higher. It shows as overbought stochastics, but these can stay pinned there on a strong run. This is usually a buy on a close above the 50sma, but I already bought it as a higher low in anticipation of that move. Also …
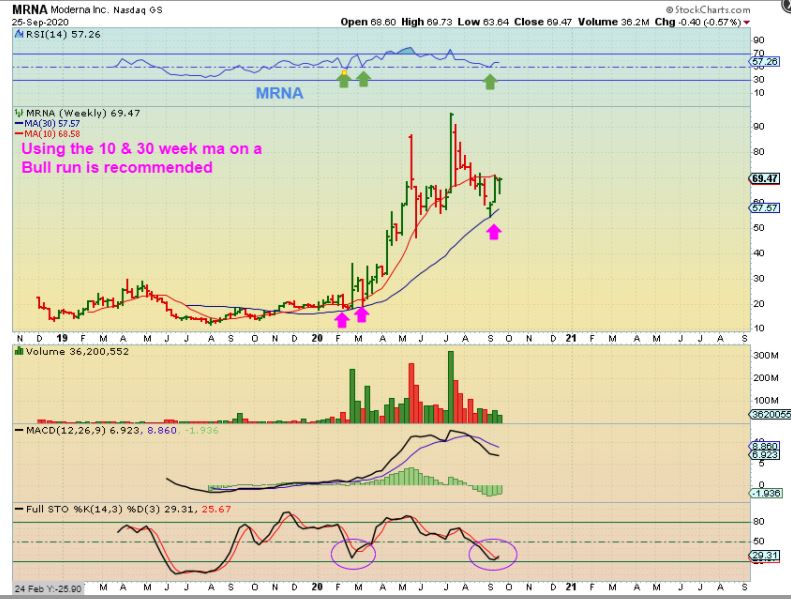
MRNA WEEKLY– The weekly chart showed a reversal at the support MA and it remains oversold on a weekly basis. It also curled up at the weekly RSI 50 line too. I am hoping for a break higher soon, but this can also chop for a bit.
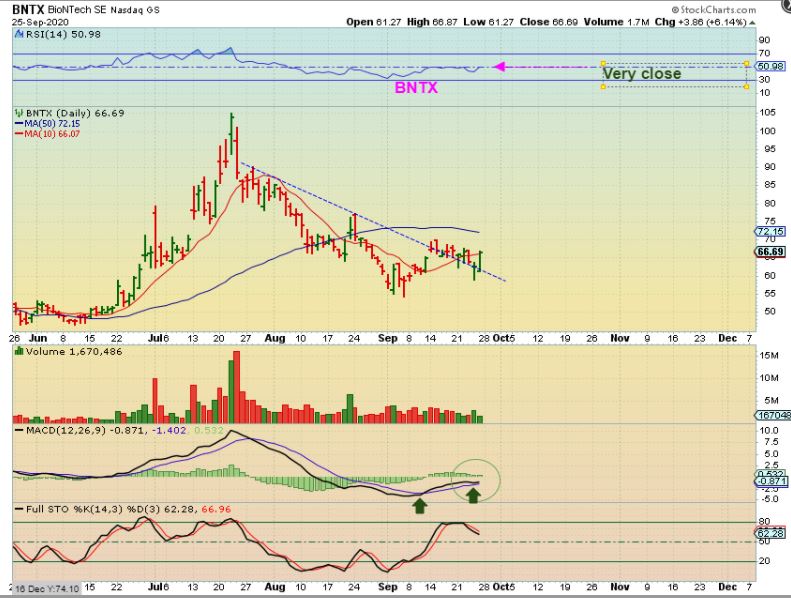
BNTX also found support along its long term trend line. It has been choppy, bouncing off of this line twice in September, but it has great upside potential if it gets going. The last run was $50 to $100 ( we caught that run here at Chartfreak the last time it was down here). Let’s zoom in…
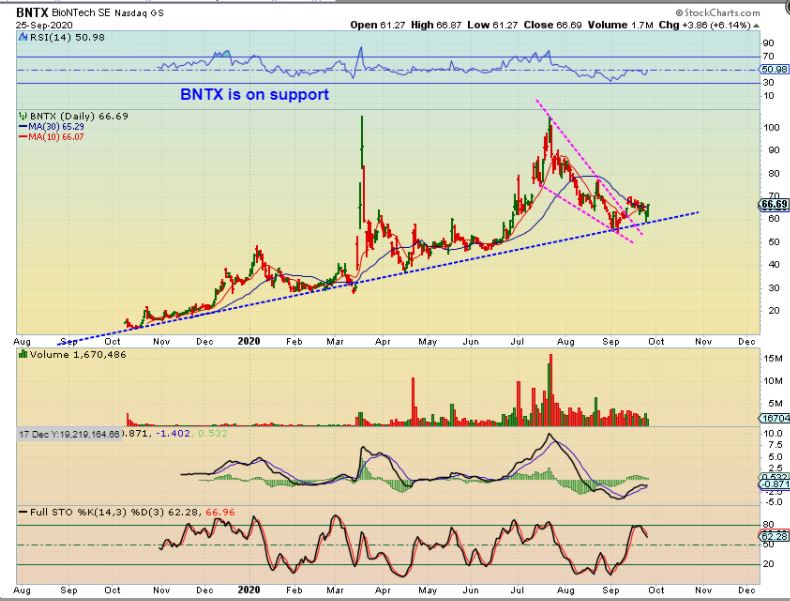
BNTX -The RSI here is also almost ready to cross back above 50% for the first time since the highs. This set up is a higher low after the move off of that long term trend line and the MACD curled up with this move Friday. It still has the 50sma to contend with, but I like the low risk / high reward set up with a stop under Thursdays lows.