September 2 – Along For The Ride
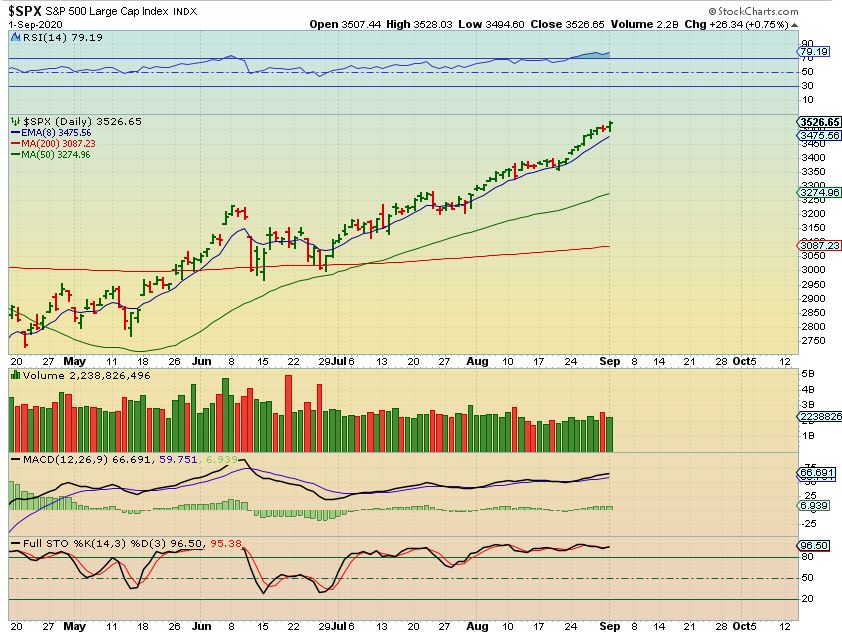
SPX – What else can I say? This is due for a dip but it is running away and we are just along for the ride.
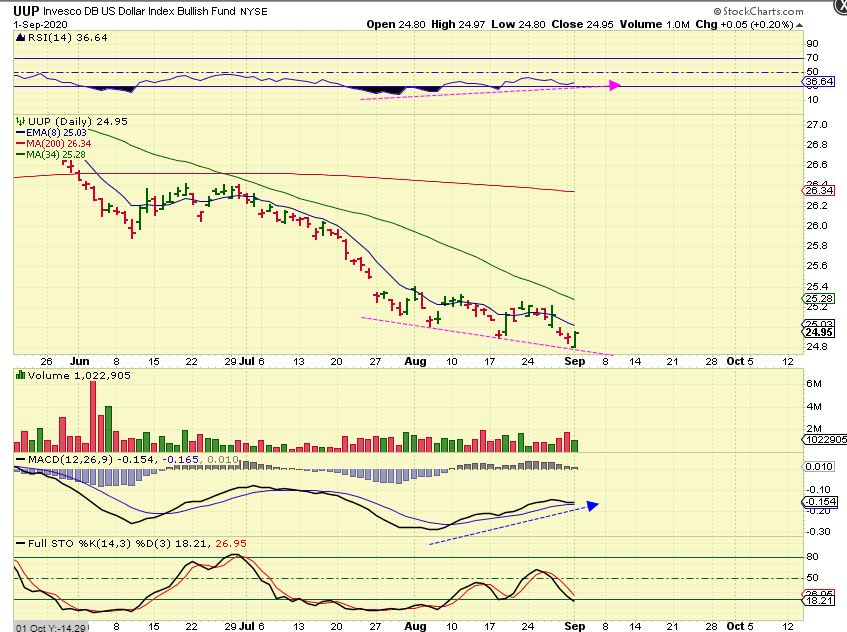
UUP – I want to point out that the USD ( or UUP) is dropping and the MACD & RSI are rising. This divergence tells me that this move down is not going to last. With that said, let’s take a look at the Precious Metals.
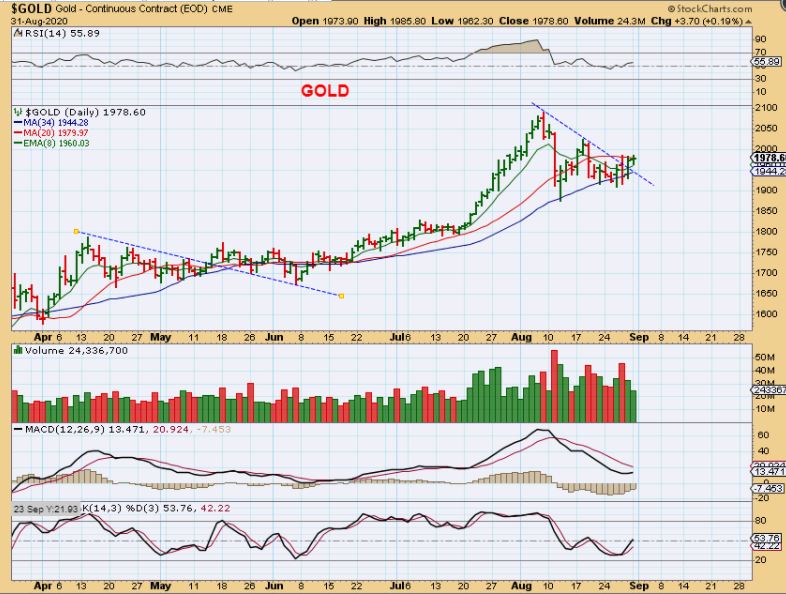
GOLD has been breaking from a downtrend, this actually has a Bullish look, however if that USD rises…
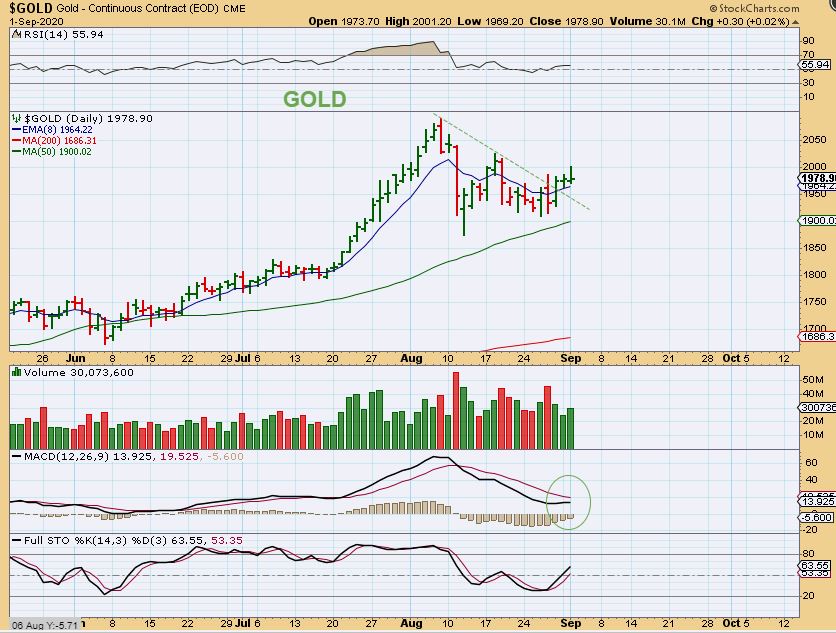
I drew this up for yesterdays report. Notice what happened in May as Gold broke a downtrend. Gold was due for a dcl, and simply broke out & then rode that trend line down. That is worth taking note of to keep us alert to possibilities.
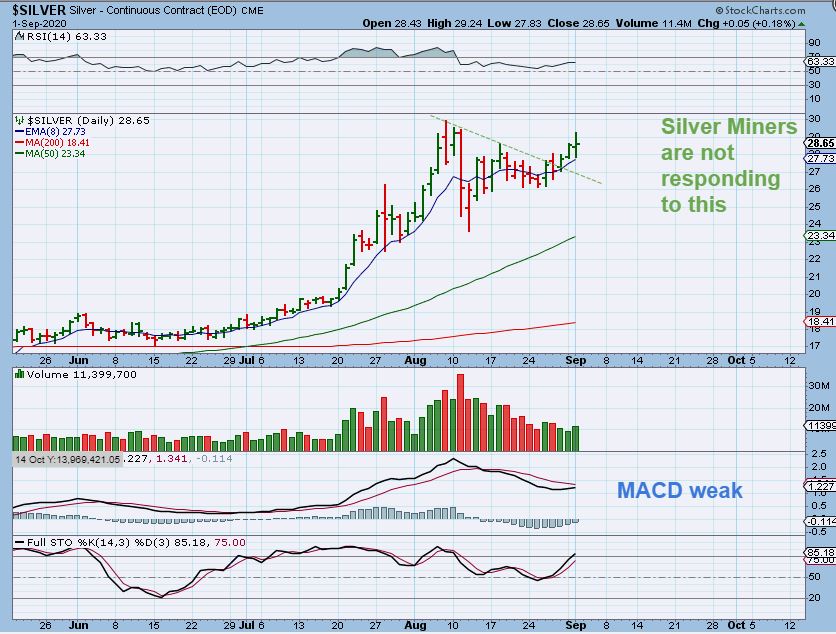
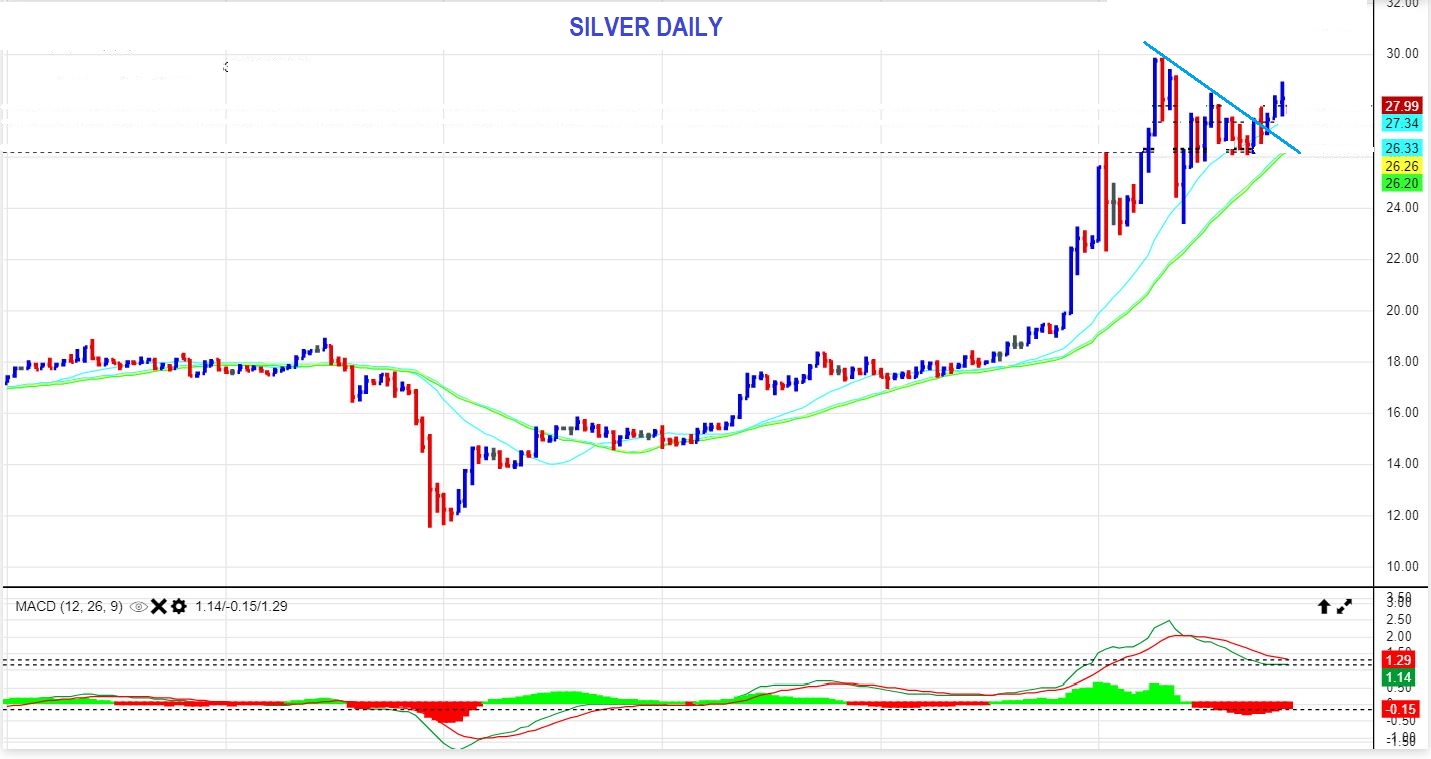
SILVER looks more bullish than Gold, but as it pushes back up to the recent highs, notice that the MACD has not crossed higher. Yesterdays report mentioned that with Silver looking good & breaking that downtrend, Silver Miners were questionable, so we needed to watch Silver stocks on Tuesday and maybe Wednesday. We’ll discuss that today.
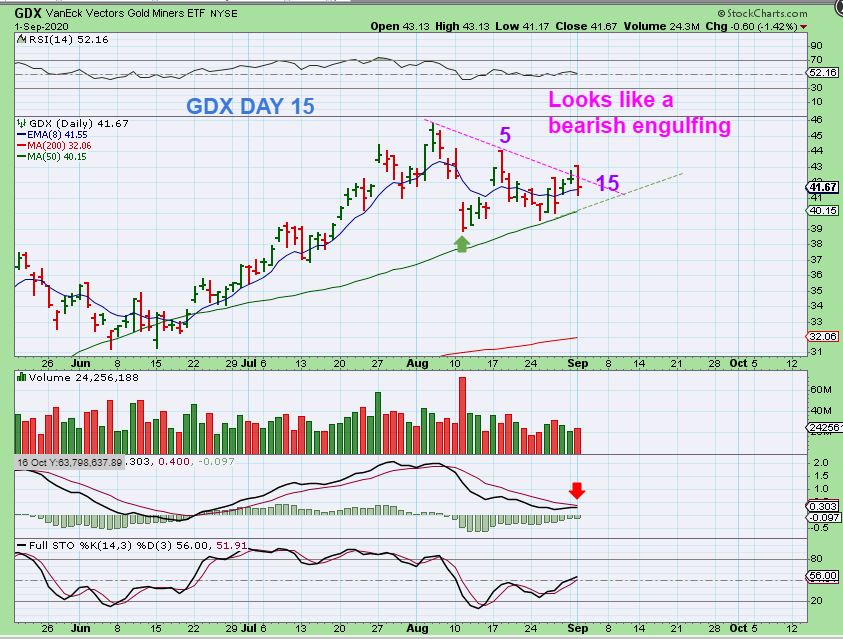
GDX – While Gold and Silver moved higher, GDX popped & dropped similar to day 5. This actually could be a bearish engulfing. So it is noteworthy that Price did not get above the day 5 peak. If we have a peak on day 5, that means that this is a L.T. Daily Cycle (so far).
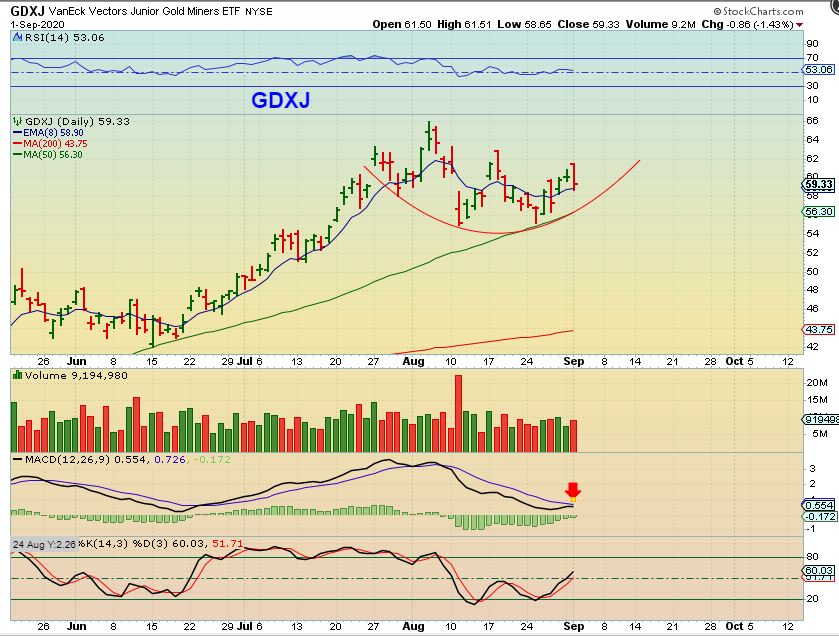
GDXJ – Watch that 50 sma. It can act as support as we dip here and then you’d have a rounding type of base here. Now let’s discuss a few of those Silver Stocks.
.
SILVER – So again, Silver ran higher and then pulled back, but still closed Green for the day and has broken out from a downtrend. How did Silver miners do?
.
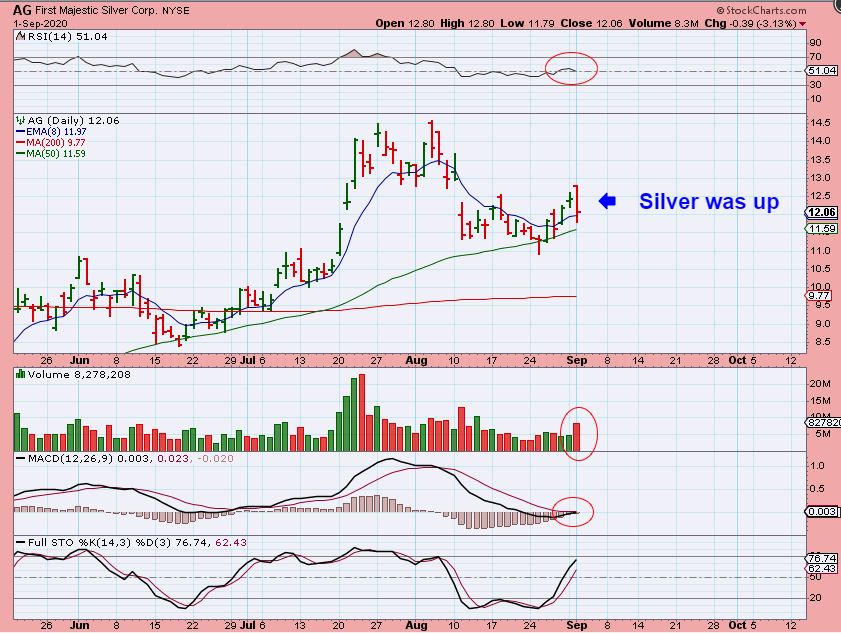
AG – First Majestic Silver was down 3% and it seems that volume increased.
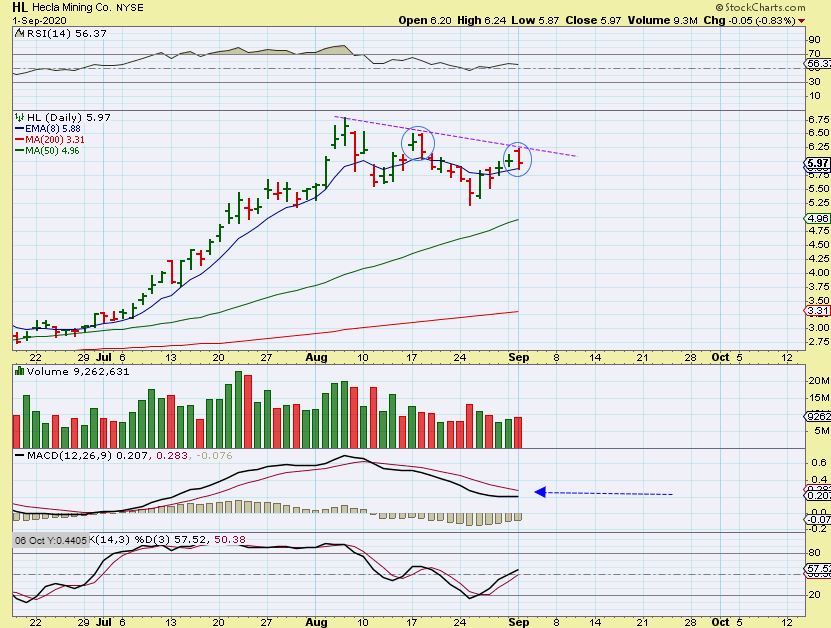
HL – Hecla Mining could not break the downtrend . These appear to be bearish engulfing candles, but I find a bearish engulfing in a set up like this (consolidation) to be more of a short term signal.
PAAS – Pan American engulfed Mondays candle too. It did bounce off of the 8 ema, but that doesn’t mean that it can withstand the pressure of a drop if buyers are not there to support price.
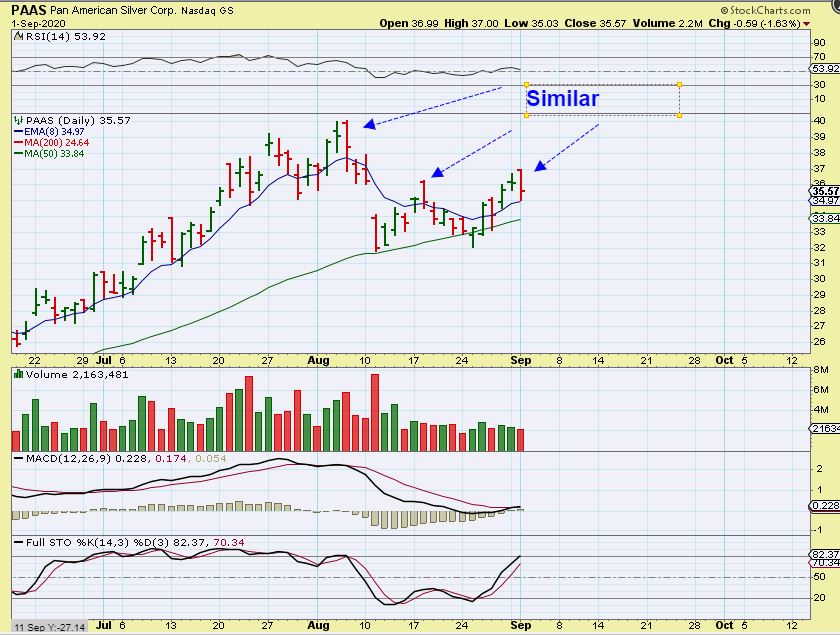
Gold Stocks are also not responding with a flood of buying after Gold broke the downtrend either.
.
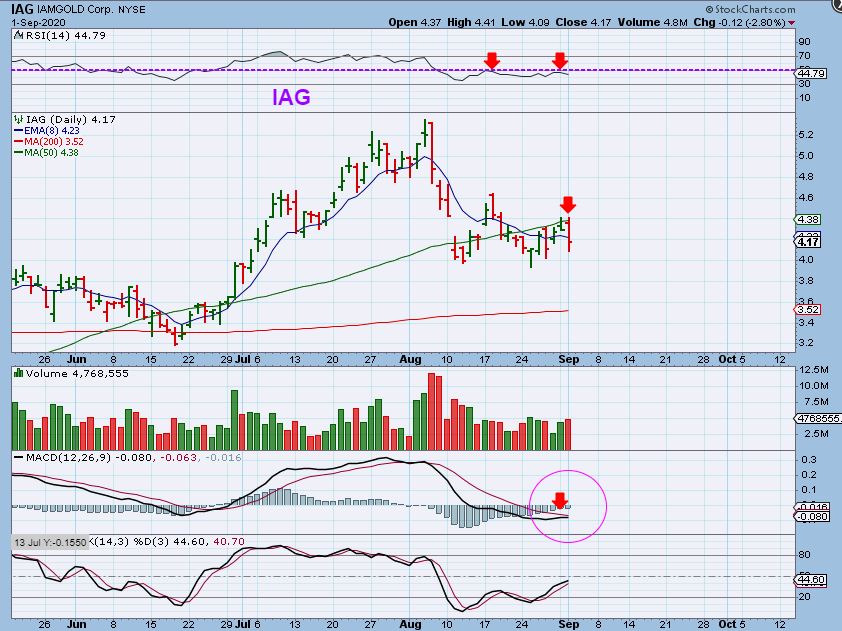
IAG could not get above the 50 sma and the MACD could not cross higher.
.
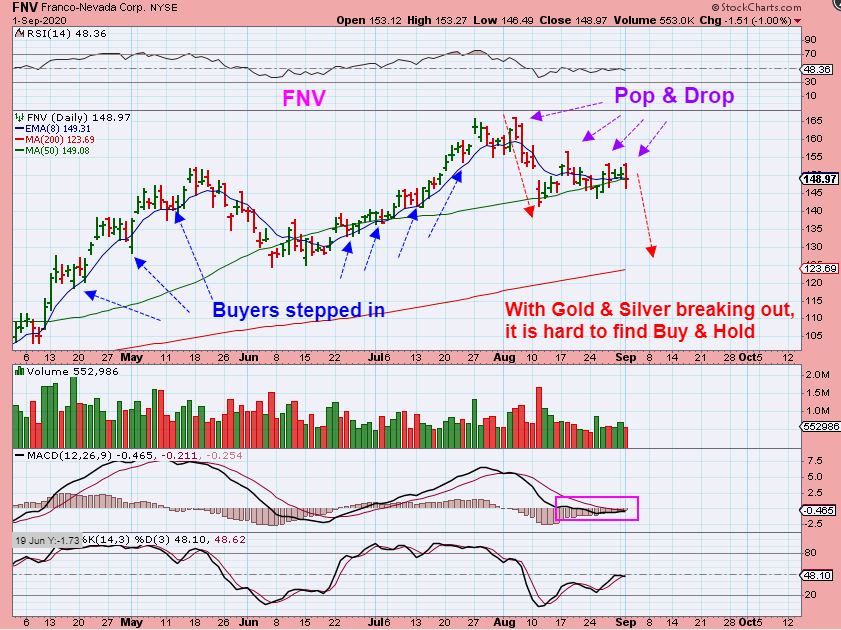
FNV is struggling at the 50sma. So far it seems that Buyers are not sticking around as each bullish open (Gap open) sells off.
.
And here is an important point.
– Our DCL is at $38.88 and we have a day 5 peak.
– Day 15 was unable to break above that day 5 high, and this has become a tight choppy range to trade within and remains left translated.
– Now a drop would have Price threatening to break below the dcl, which would give us a failed daily cycle.
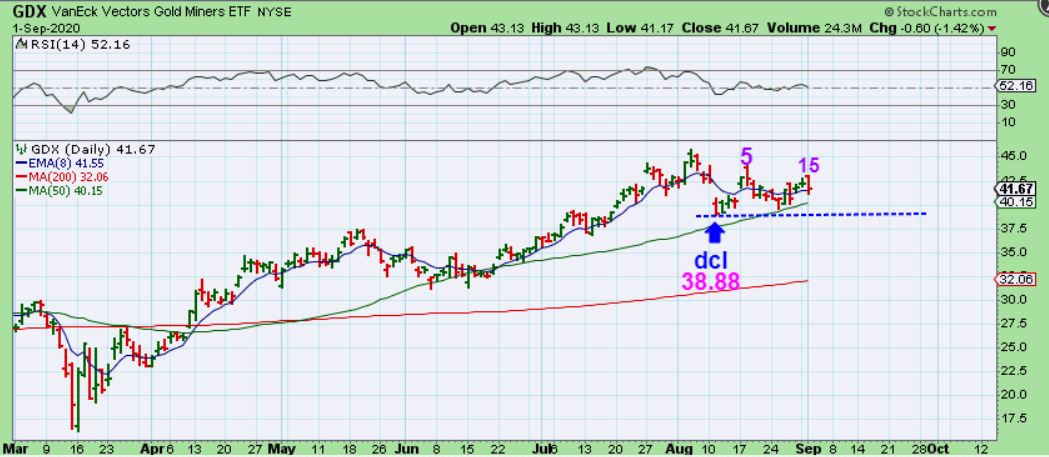
Same chart: Now a drop would have Price threatening to break below the dcl, giving us a failed daily cycle.
We actually Need a break of the dcl to drop into an ICL, so that may be a good thing. After a run from $17 to $45, a drop to the 200sma at $32 would erase a LOT of gains, but that is what ICLs usually do. That would be a 410 drop from here, but we may still just chop around for a while too.
.
If that old saying that ‘Miners lead the Metals’ is true, they certainly are not leading the way higher. Are they leading the way lower? Today I’ll be watching to see if the Miners break down further and do any damage, or is this sideways chop just going to continue for a while? I have a few trade ideas below, enjoy your Wednesday trading.
.
~ALEX
.
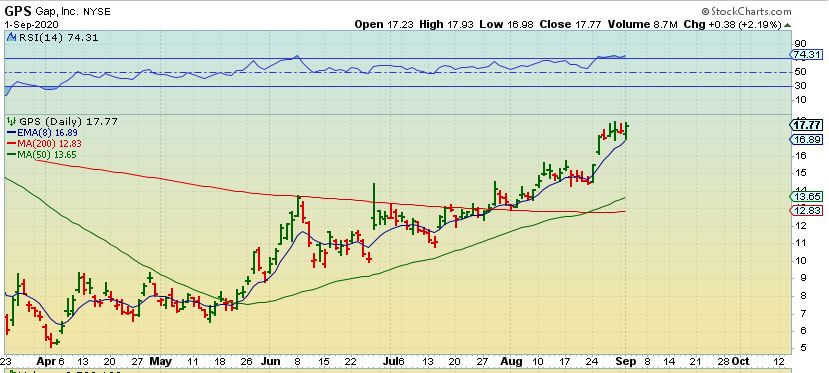
Many retailers have done well, especially if they have online shopping available. Last week I mentioned The GAP (GPS) as a buy.
.
GPS has had the follow through that was expected as it rides up the 8 ema.
.
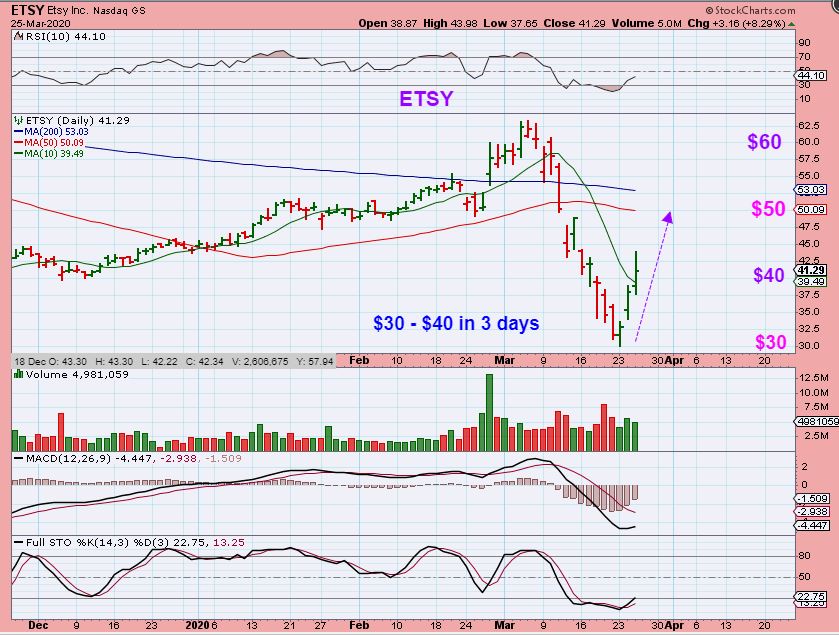
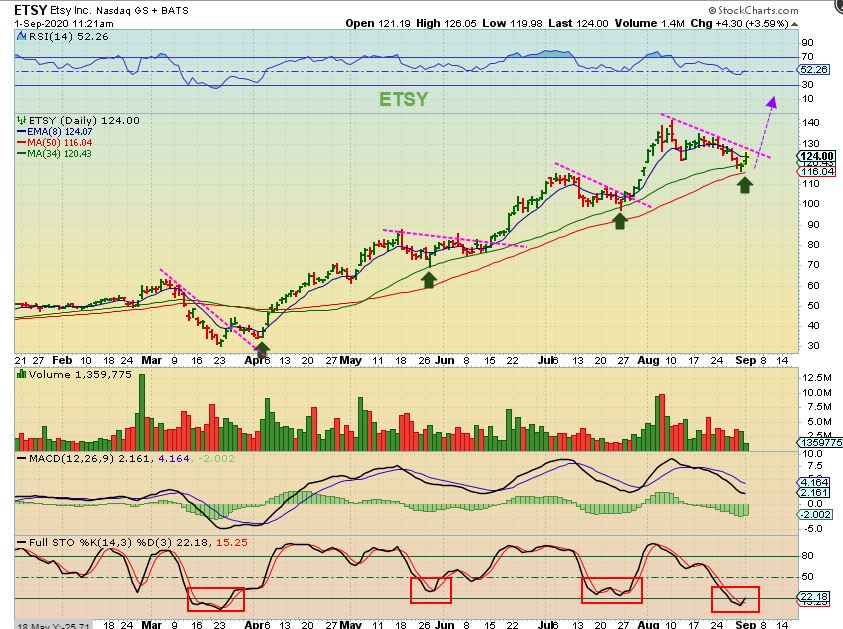
I still like the set up on ETSY, and I think these next charts might surprise many. After the sell off in March, I mentioned several Retail stocks that were strongly rebounding, especially if they offered online shopping. This chart was my March chart of ETSY.
.
ETSY V-bottomed & went from $30 to $40 quickly. I pointed to it running right to $60. What did it do?
ETSY ran to almost $80, and I thought that it might fill that gap at the $65 area. Well…
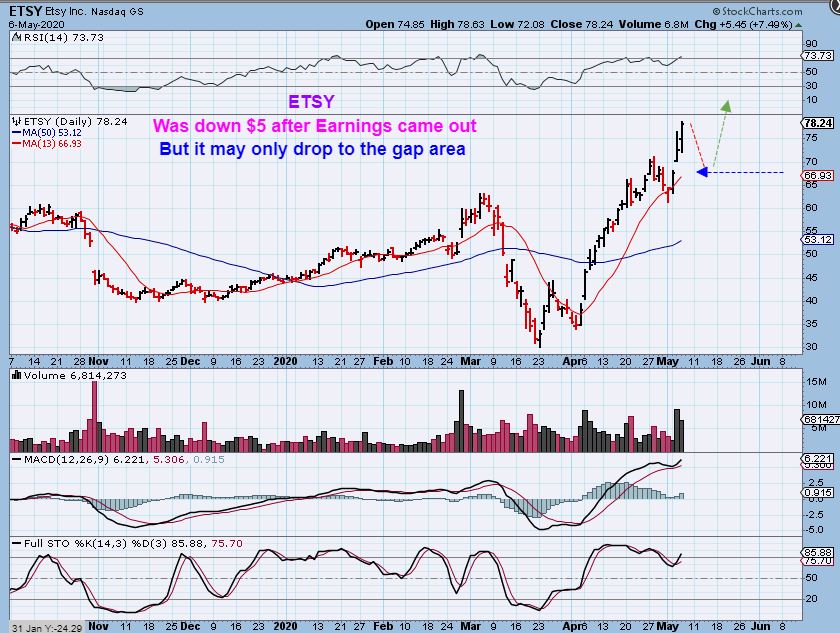
ETSY actually filled that gap 3 weeks later on the 34 sma & continued its run. This has now moved from that $30 low in March to $140. I have pointed this company out several times along the way as it dropped to support and currently ETSY sits on support again. This should be another opportunity to buy it, since it looks like it is preparing to break the recent downtrend again.
.
THIS IS THE SAME CHART OF ETSY AGAIN: I just want to point out the areas of sideways consolidation.
Almost all bull runs have a sideways choppy consolidation that is difficult for some to ride. It is boring and mentally it can be frustrating at times day after day. We have that now with RIOT, MARA, BLDP, WKHS, SPAQ and other stocks that I have been highlighting, so by showing you this chart of ETSY, it may help people when they see the $30 to $140 results. 🙂
.
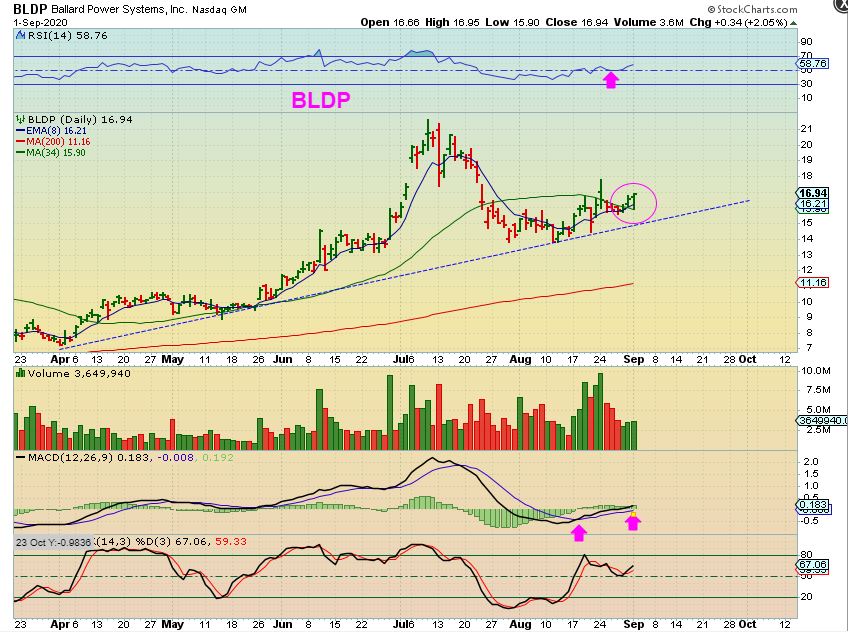
BLDP– Speaking of sideways choppy trading, notice the April to May consolidation, but BLDP ran from $7 to $21 and now after a pull back we are waiting for a push back to $21 or more.
More Sideways choppy consolidations:
.
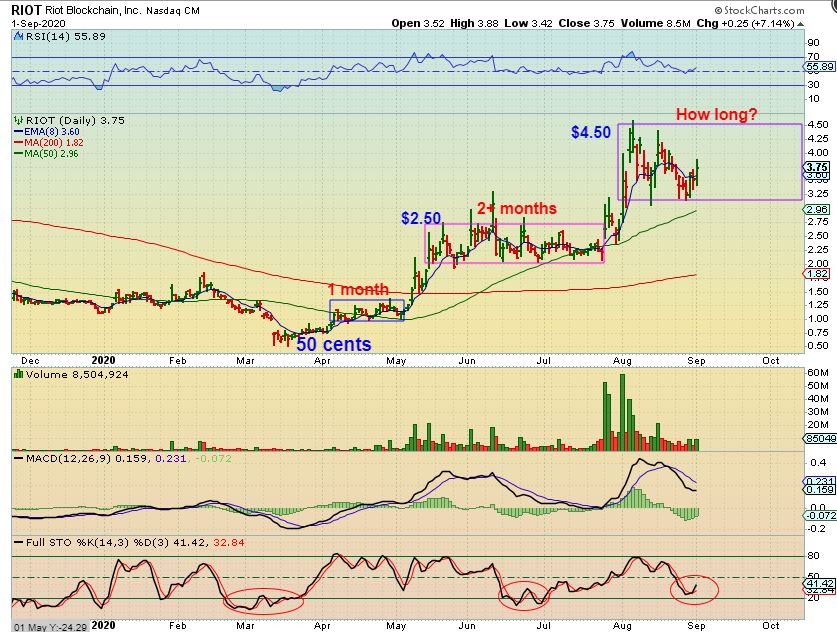
RIOT – This may look like bad news, since I am pointing out consolidations that can last many weeks and we are in one now, but it is a bullish big picture chart, and the gains have been big.
– We bought riot in the last consolidation,
– We sold some on the run to $4.50 and
– recently added again at the lower edge of this box ( 20sma & 34 sma ) recently. Now we wait, so lets zoom in…
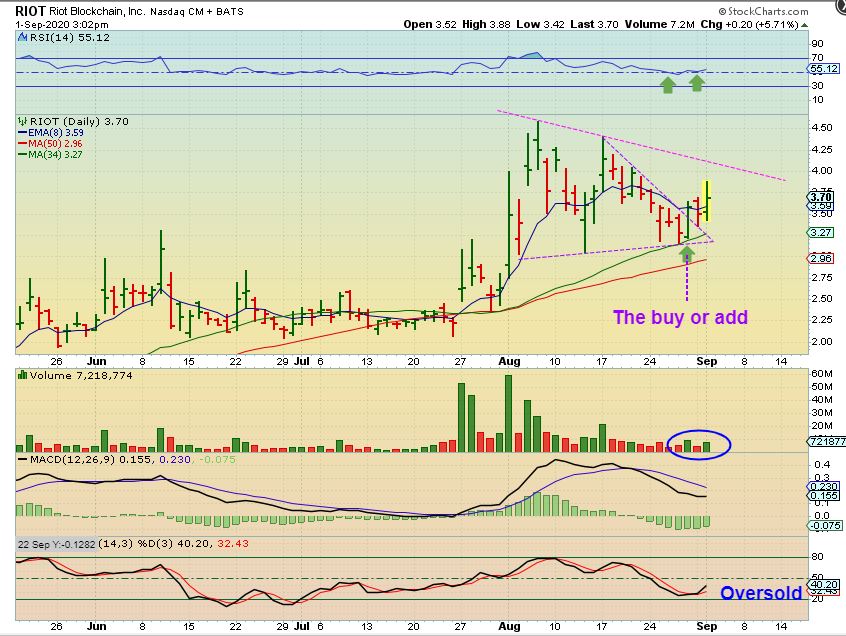
RIOT broke higher yesterday and may be ready to run to the top of that box in the chart ABOVE or the magenta line in this chart. If Bitcoin breaks out, RIOT may break out too.
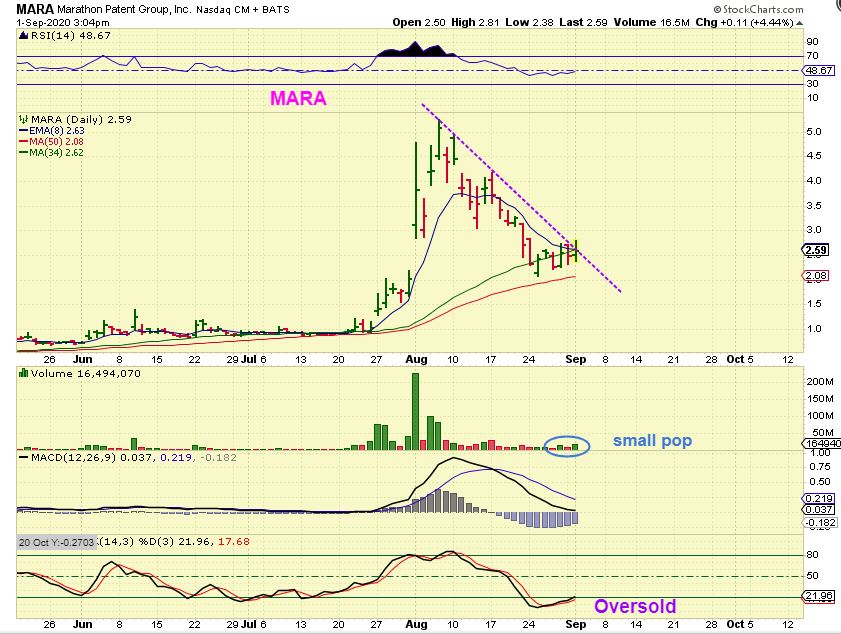
MARA tried to push higher yesterday too. I ( many of us) bought MARA in that $1 consolidation, I sold up near the highs and would not buy it back without a sign of strength. I said that MARA seemed stretched and overbought.
I finally bought my MARA back yesterday and hope that it will not lose the 50sma from here. I still might be a little early, but it has stabilized in this area and finally reached oversold.
The Electric Vehicle Trades (Sector) that I have been pointing out in August have included TSLA, NIO,WKHS, SPAQ, GRAF, SHLL, etc …
.
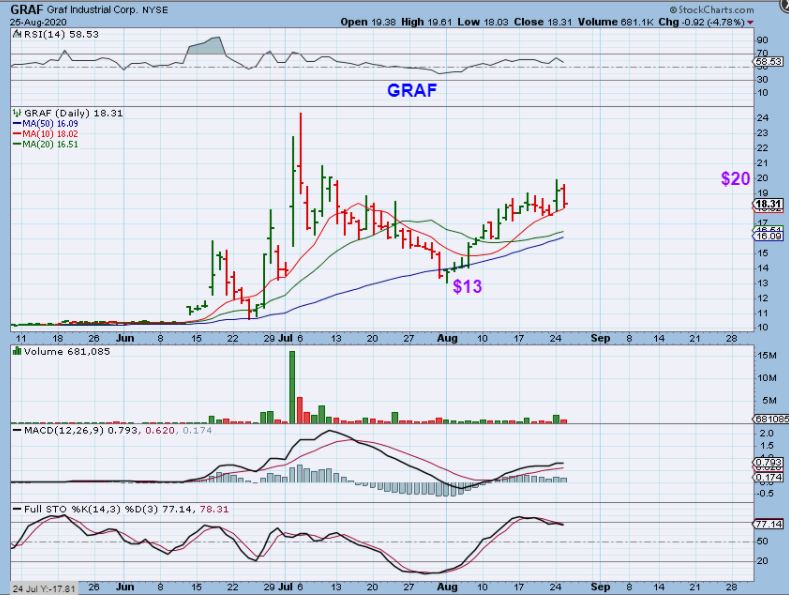
GRAF was posted on Aug 25th and I said that I bought it, SPAQ, NIO, and WKHS.
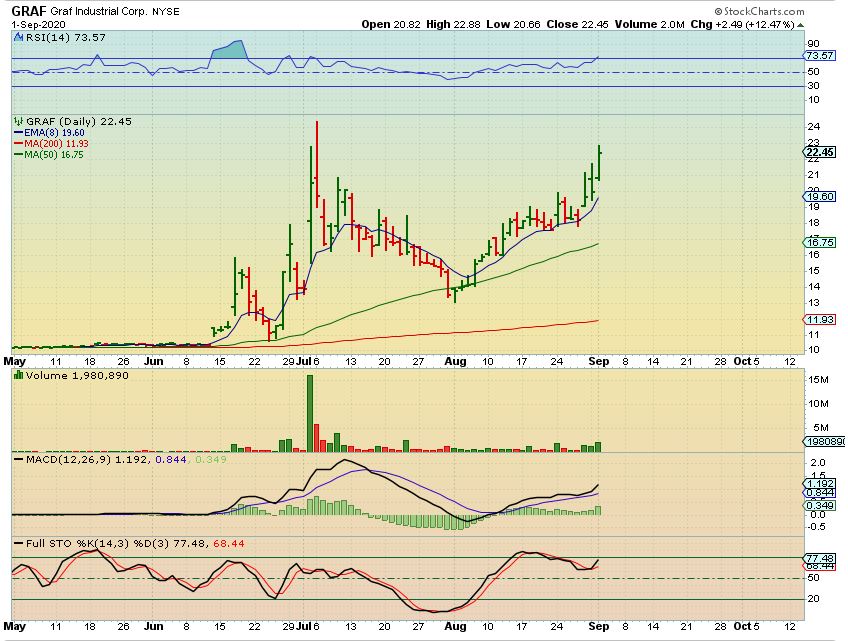
GRAF is running now and could break to new highs. What happens when these break to new highs? They can move exceptionally fast, let me show you…
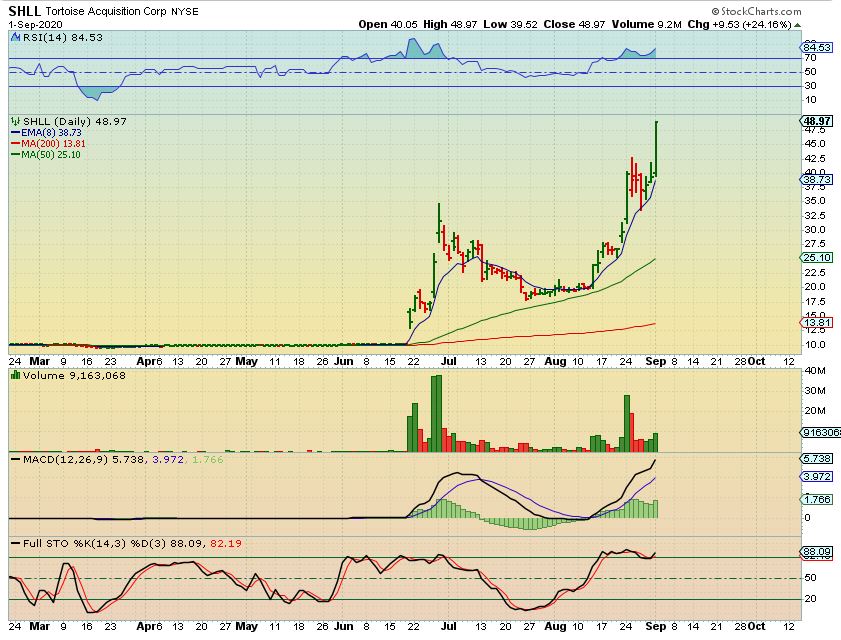
SHLL was pointed out by me on AUG 25th as one that ran well. I did NOT buy this in case it was extended. Well, it put in a small bull flag and…
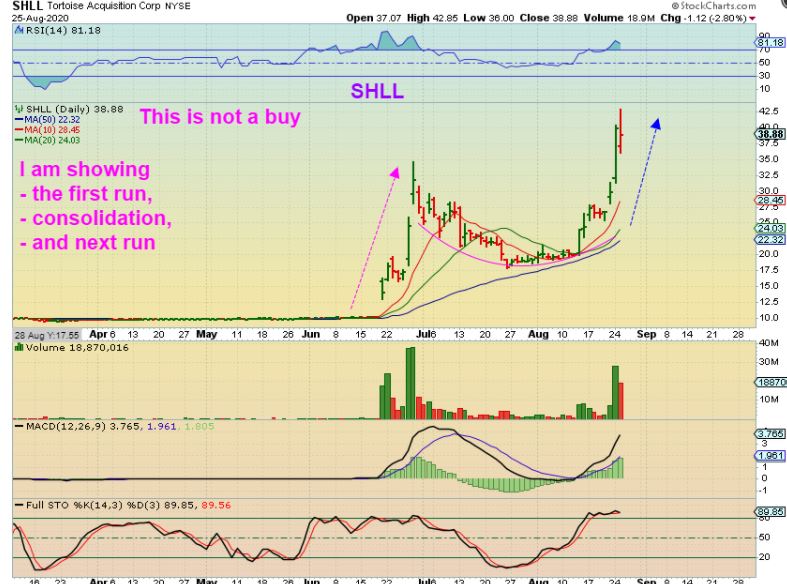
SHLL bull flagged and exploded higher again, up 24% yesterday alone. I am hoping for these kind of moves in the ones that I am holding, but some been consolidation. Lets take a look…
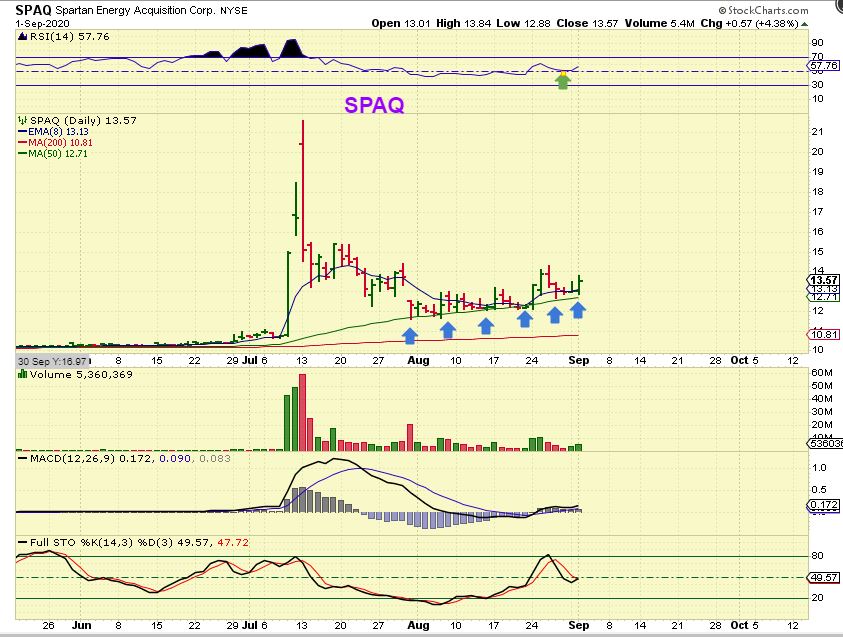
SPAQ actually has moved from $12 to $14 and is currently at $13,57. I do still own it and added.
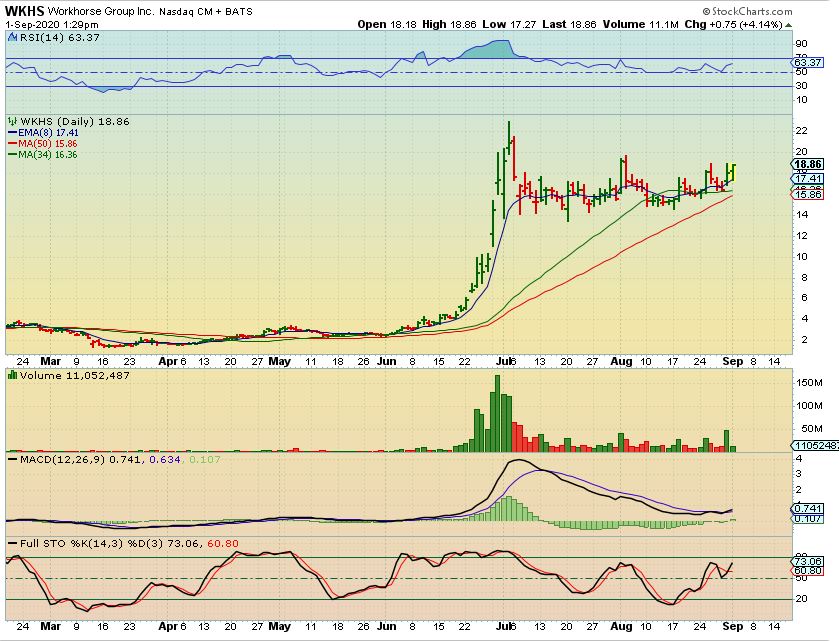
WKHS has also moved higher from the $14.50 area to $18.86. The move looks small,
but $14.50 +30% = $18.85. I think it has more upside, especially if it acts like some of the others in this sector.
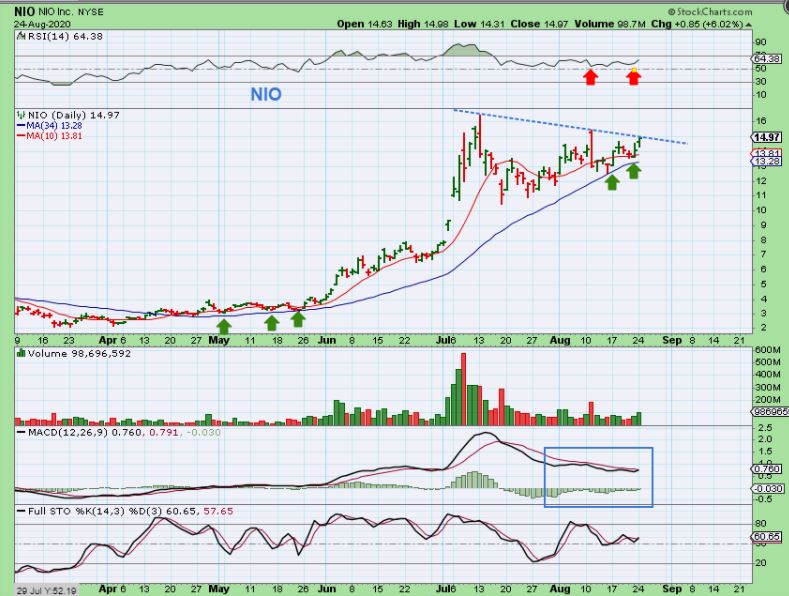
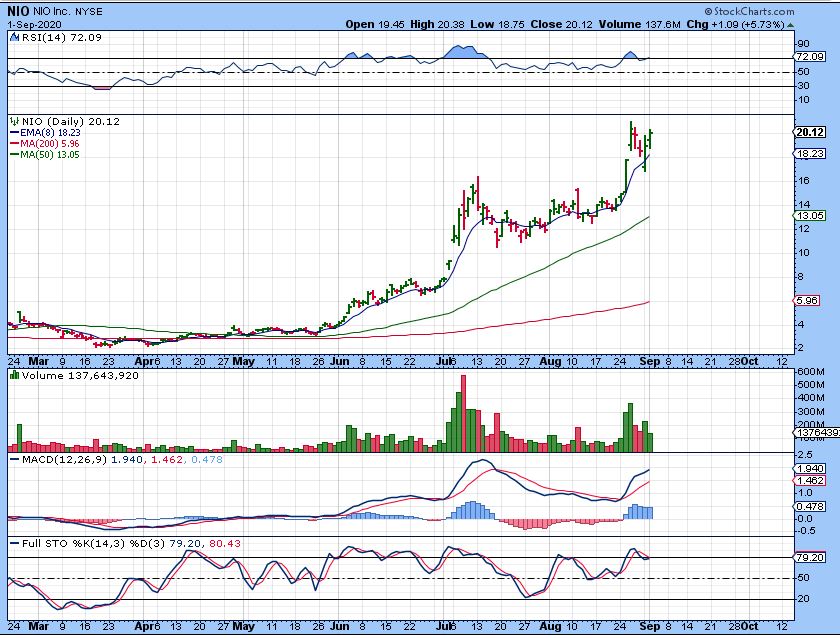
NIO – These arrows were the BUYS in the consolidation for NIO. $12.50 & $13, or even here at the $14 area downtrend. I mentioned that I owned it.
.
NIO has run to $20 and looks like it still wants higher price. So these consolidations have been constructive, and I hope WKHS and SPAQ have similar results before these general markets put a top in.
.
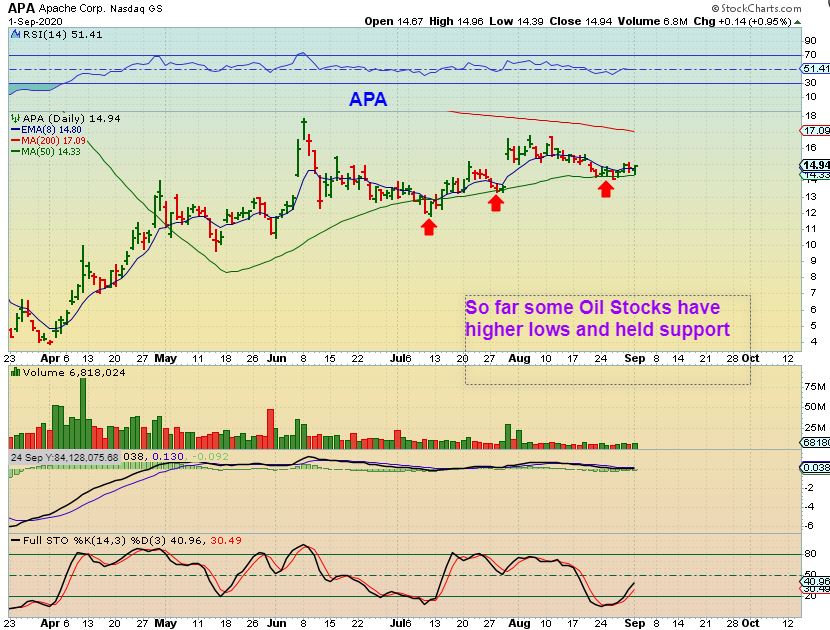
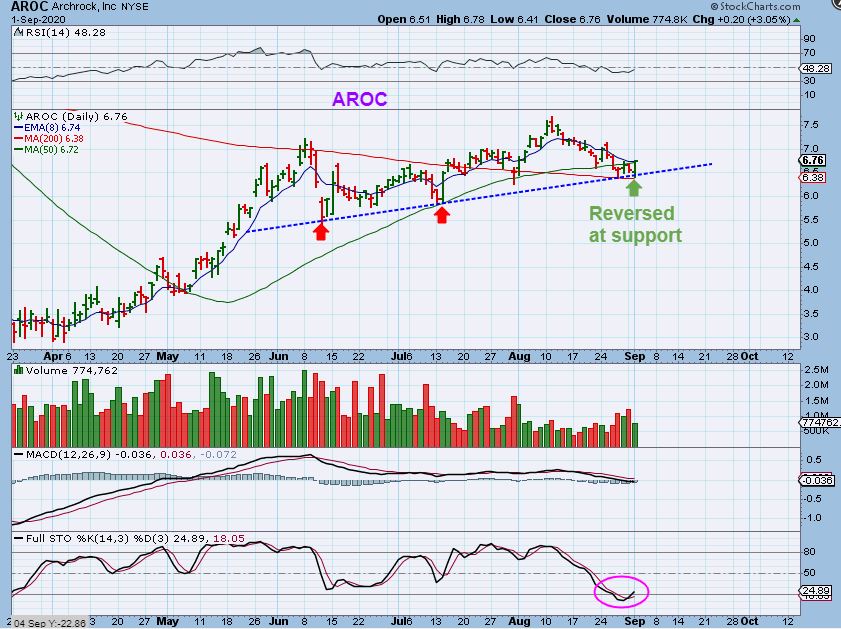
SIDENOTE: AROC, APA, and a few other Oil / Energy Stocks put in reversals at support on Tuesday. I am not buying these at this point, because the last 2 times I bought them they were simply chopping sideways and lacked that upside push. I think they chopped sideways because the XOP needed to put in a dcl (find its latest lows). Wednesday is the Oil Inventory Report, however, so I may watch this sector to see if the XOP possibly puts in a dcl.
.
Notice on these 2 charts that APA & AROC actually do have higher lows over the past few months, but they have been more choppy and less rewarding thus far.