August 29th Weekend Review
NASDAQ DAILY- As a review, I have pointed out that the dips ( DCLs & 1/2 Cycle Lows, etc) have been rather mild. I feel that we are seeing a Bullish runaway type move. We are due for a dip into a dcl soon. Please read this chart.
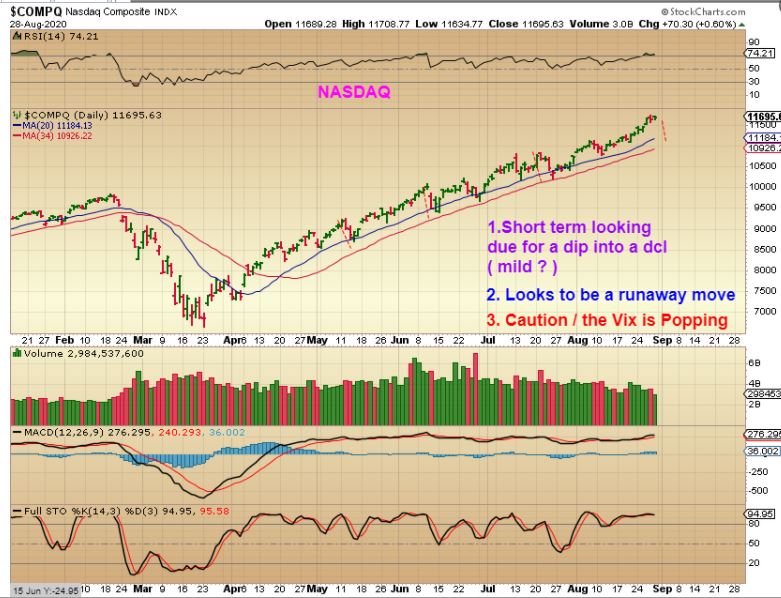
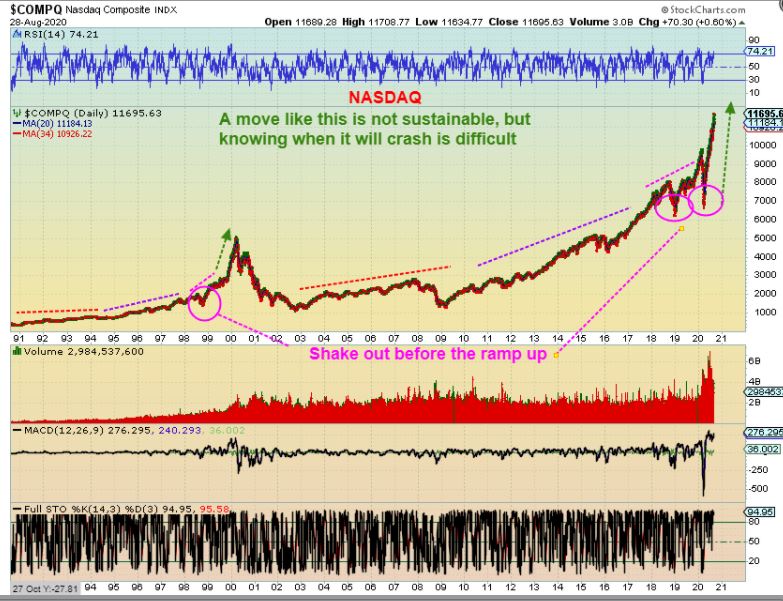
NASDAQ WEEKLY – The bad news is that those runaway moves cannot be sustained indefinitely. This looks steeper than the 2000 Tech Bubble, so even though I am long certain positions, I am cautious.
Similar to what we saw last March, one day out of nowhere, we’ll probably see the DOW down 800 – 1000 points and panic on the popular business channels.
I want to show you the real Bullishness of the SPX over time.
.
SPX -I posted this 1 year ago last August. This looked like a megaphone or Bull Horn pattern, and I thought that the break of that green line could lead to a serious sell off. Well that green line didn’t break, instead …
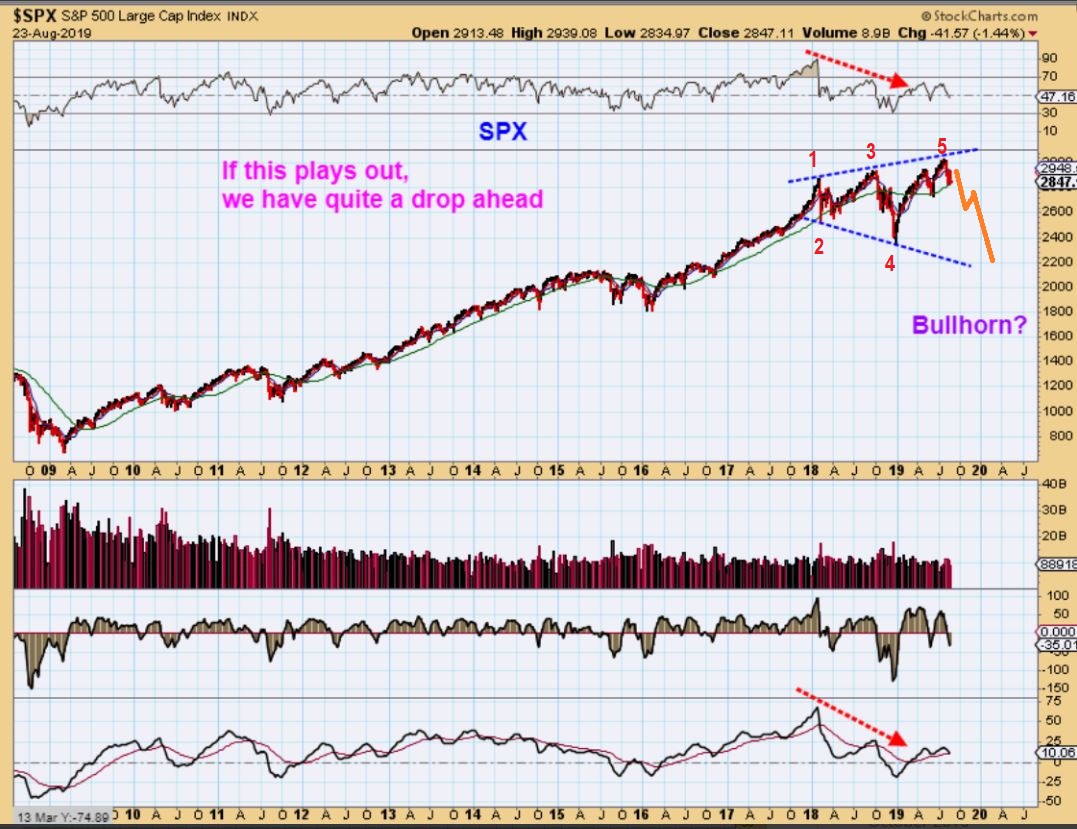
The SPX Broke upside and rallied strongly. After that overshoot, we saw the crash in March which was blamed mainly on Covid? With a v-Bottom recovery, this rally is even stronger & more straight up. It will become unsustainable, but for right now I think we can be long as long as we are cautious.
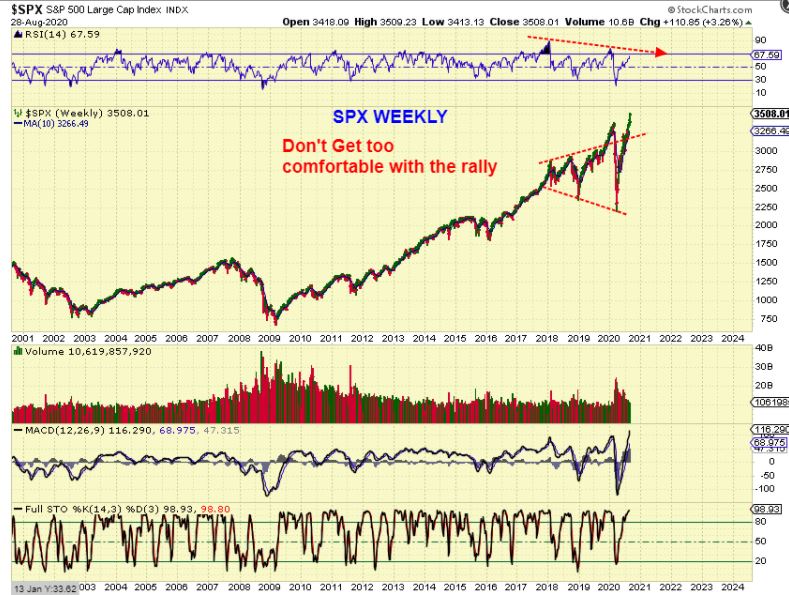
Again, I think we can be ‘long’ as long as we are cautious. This could sell off heading into the elections, it could sell off after the elections, or if another surge in Covid takes place after schools & restaurants relax restrictions, it could sell off then. While online shopping and businesses are doing exceptional, I’m also hearing about lay offs and small businesses struggling & going under. This rally just needs some trigger or excuse to sell off in my opinion.
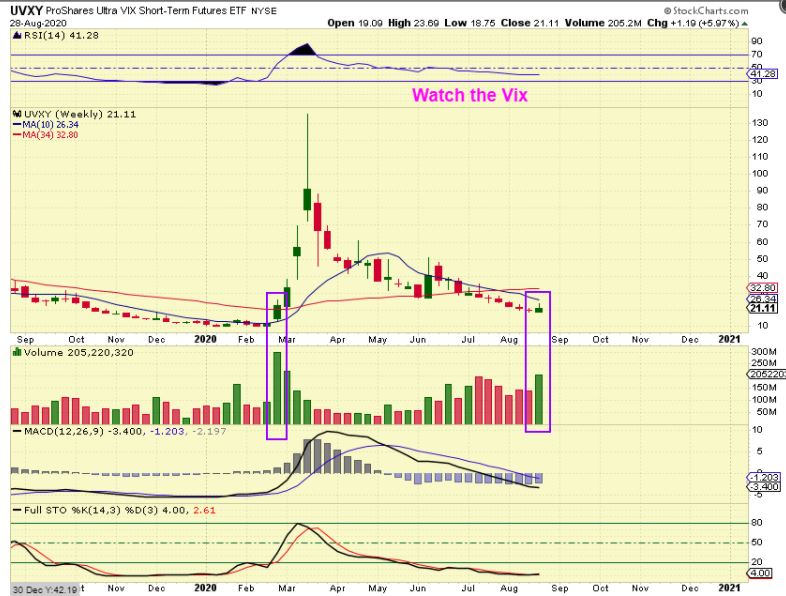
I mentioned the Pop in the VIX recently. Here I am using the UVXY WEEKLY for volume. This adds to the thought that the Markets could be nearing a top.
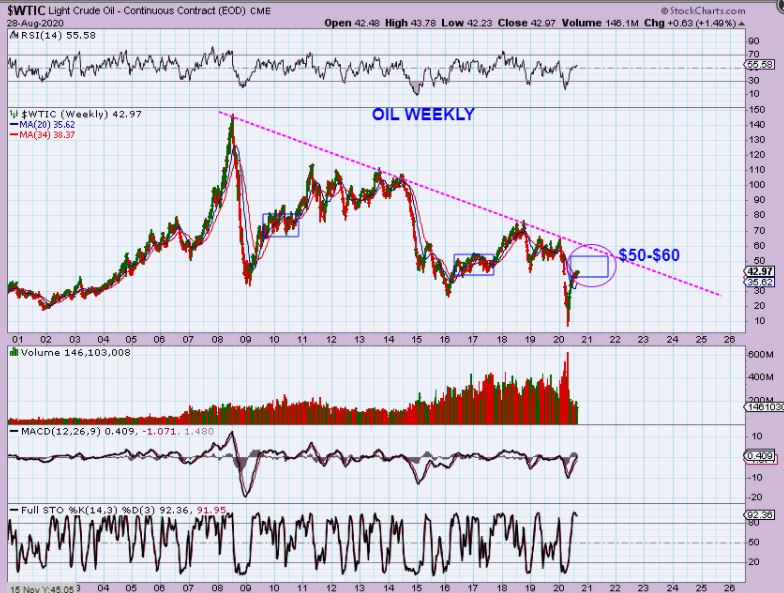
WTIC WEEKLY – Oil gets choppy and sideways often, after a v-bottom low, and Oil is choppy lately. That can continue.
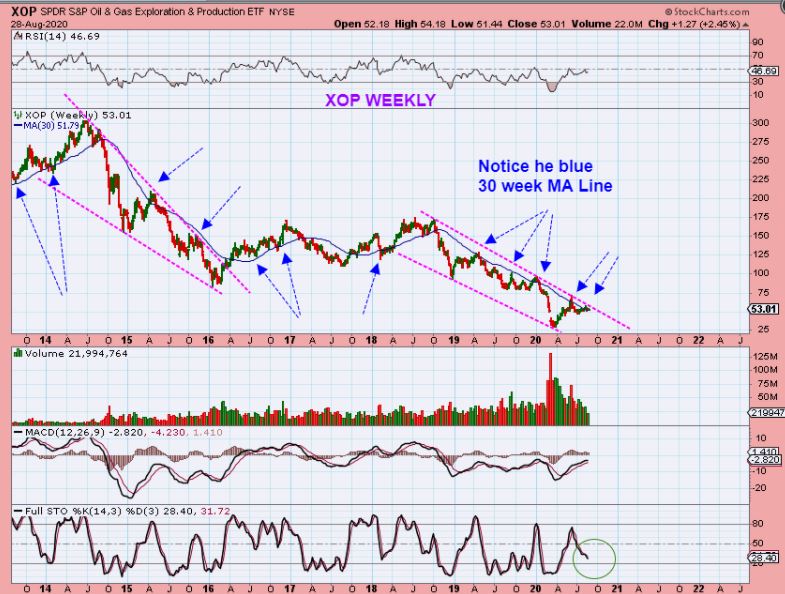
The XOP is at resistance and has not given us a good trade set up with all of this sideways chop.
.
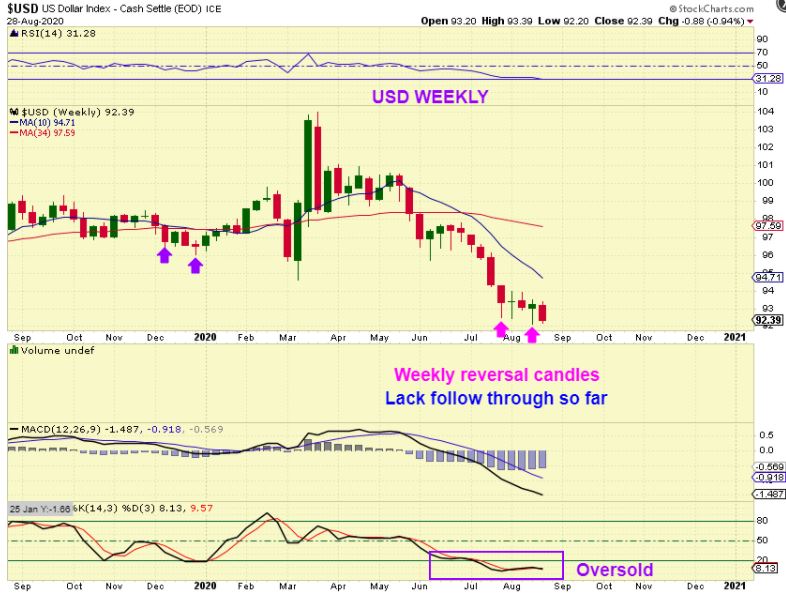
USD WEEKLY – Last week I mentioned that the USD looked to put in a low. So far the low held up, but we need to look at the Daily chart for better analysis. The Weekly is very oversold.
.
USD DAILY – Last week it looked like the USD Bottomed, and that still may be the case, but the USD is testing that bottom area again. I do see divergence with the MACD & RSI rising on the retest of the lows, so this may bounce or run higher next week…
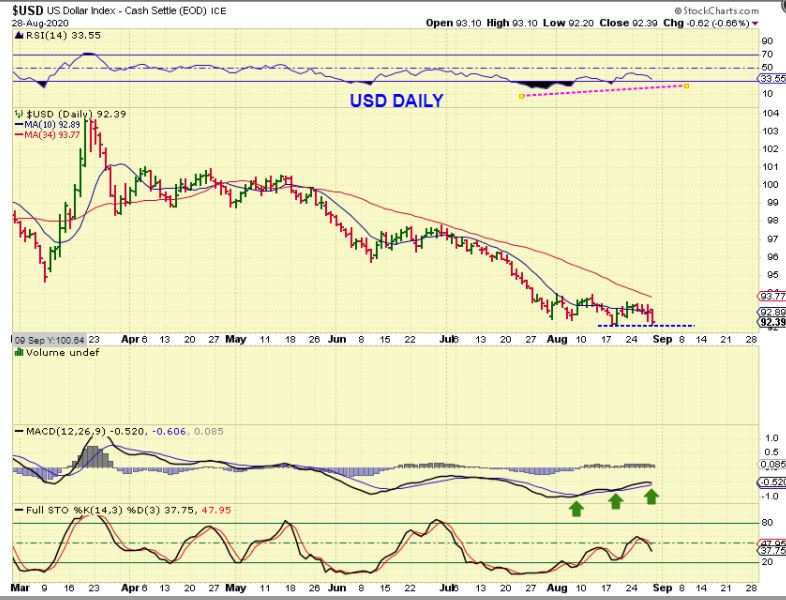
THAT DOUBLE BOTTOM SEEN ABOVE MAY BE WHY GOLD & SILVER DID NOT SELL OFF DEEPER LAST WEEK. So we want to be aware that if the USD now pushes out of these lows, Gold & Silver may drop further. Let’s keep that in mind, because Gold & Silver looked like bullish triangles last week. They could break down is the USD runs.
..
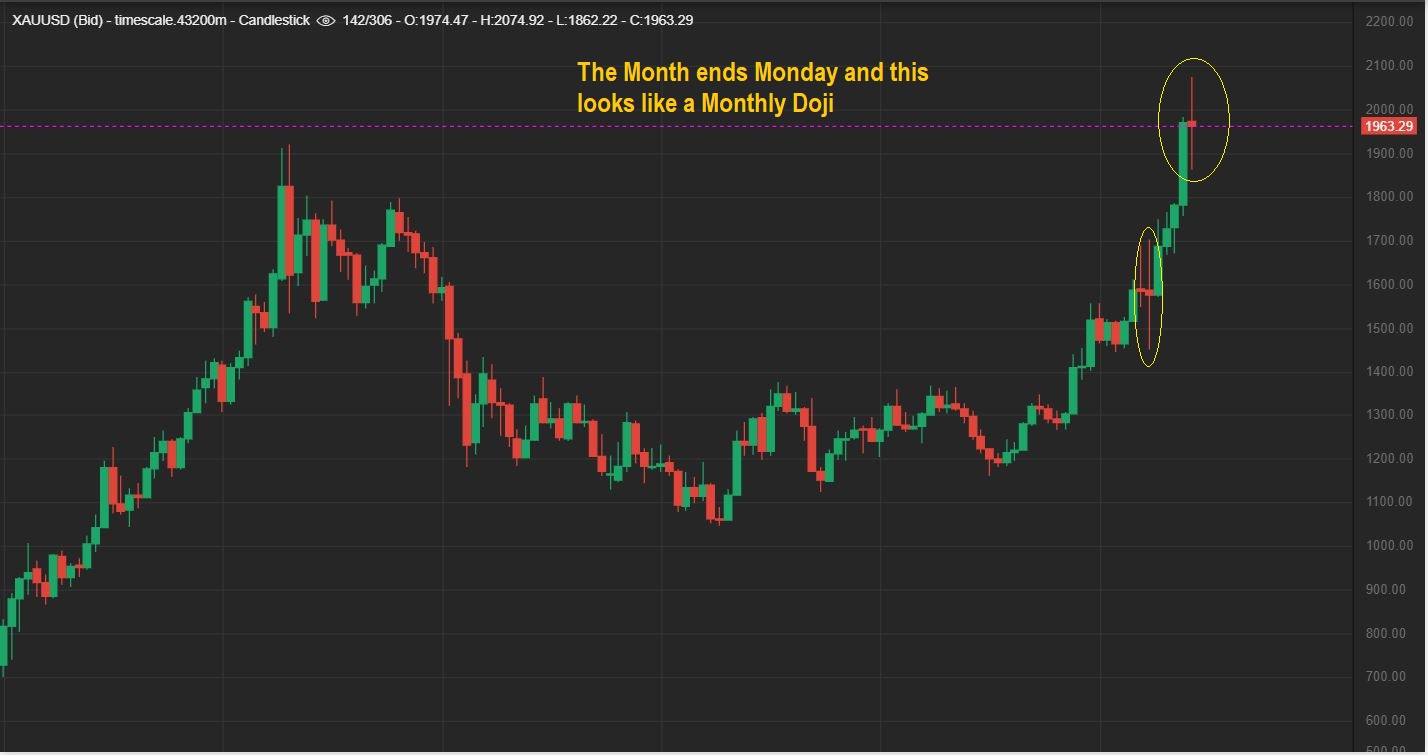
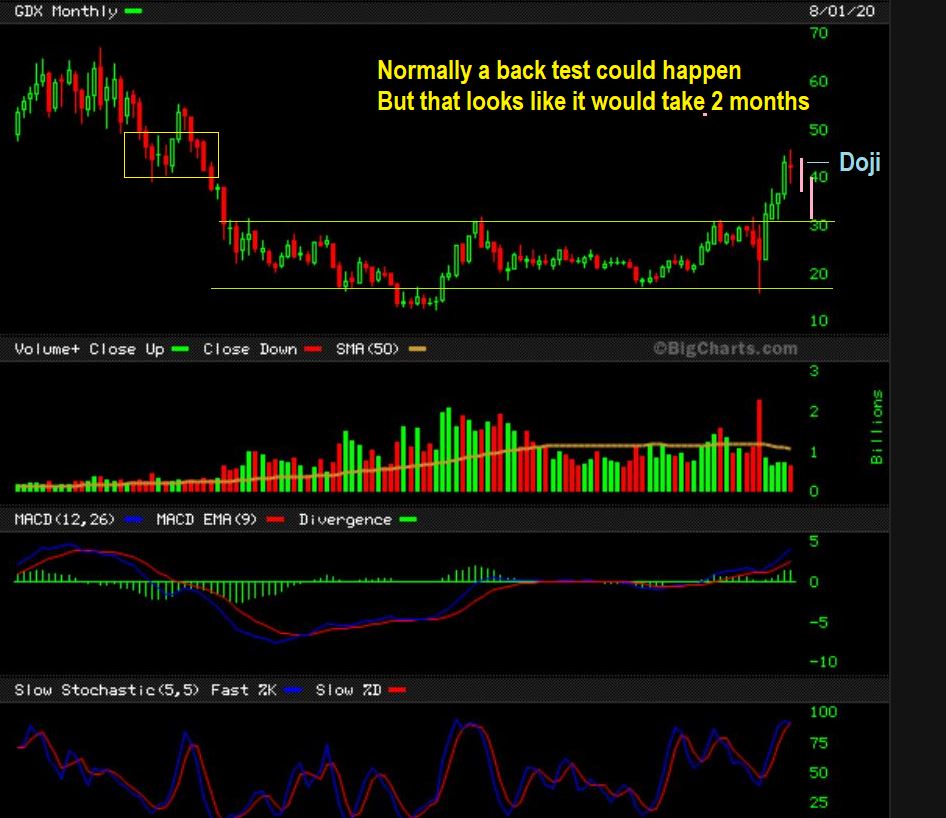
GOLD MONTHLY – The Month ends Monday, so currently we have a giant doji candle. These can form bottoms, midway indecision points, or tops. At this point, it could be a top.
.
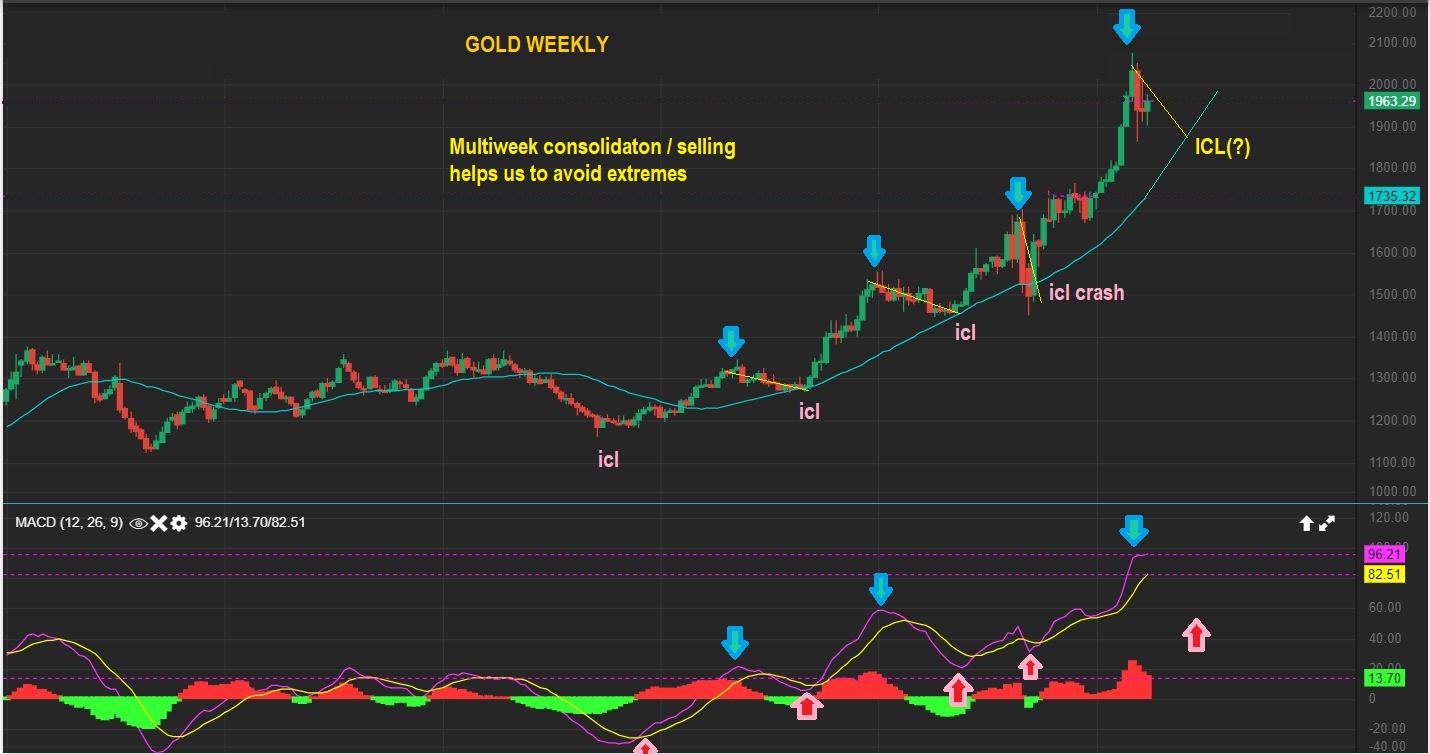
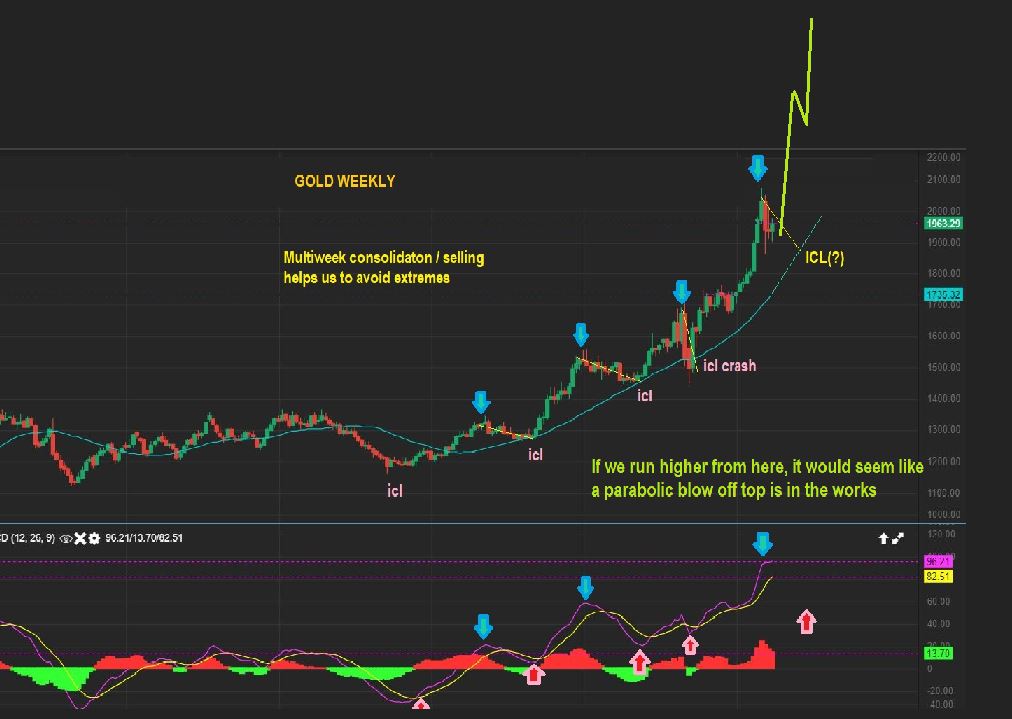
GOLD WEEKLY – We are anxious (and yes, I am anxious too), for an ICL & another rally, but what do I see? Just to be honest in the analysis, we would need more time based on this chart alone, wouldn’t we? Look what happens at every blue top leading into an ICL even during Bull Runs. Unless Gold is just going to go into a parabolic blow off top of its own, that steep climb from March to August should chop down for weeks into the next ICL.
.
Unless Gold is just going to go into a parabolic blow off top of its own, ignoring the need for an ICL, that steep climb from March to August should chop down for weeks into the next ICL. Parabolic would look like this.
.
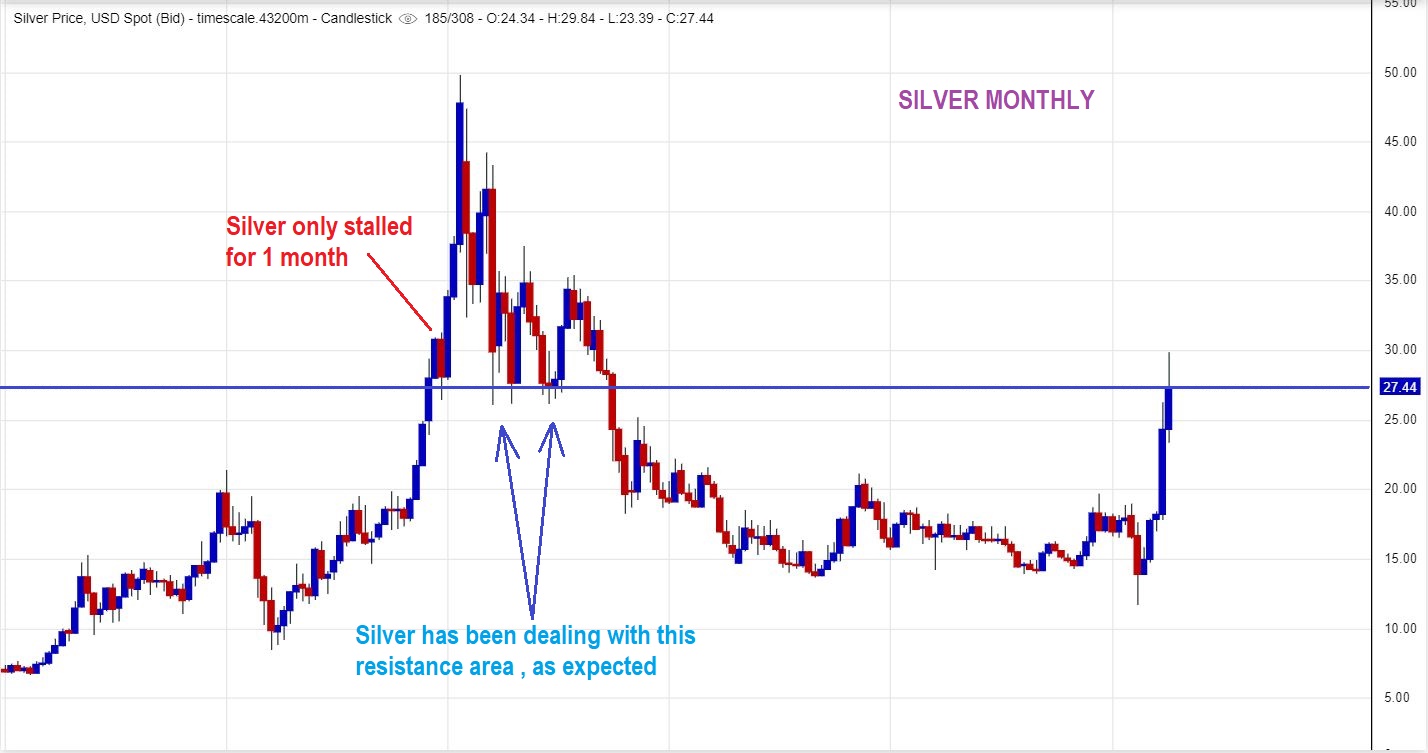
SILVER has paused at resistance, and this was expected. It only stalled for 1 month in this area on the last strong rally to highs. That can seem quick on this chart, but just remember that 1 month can be 3 or 4 weeks if it happens again.
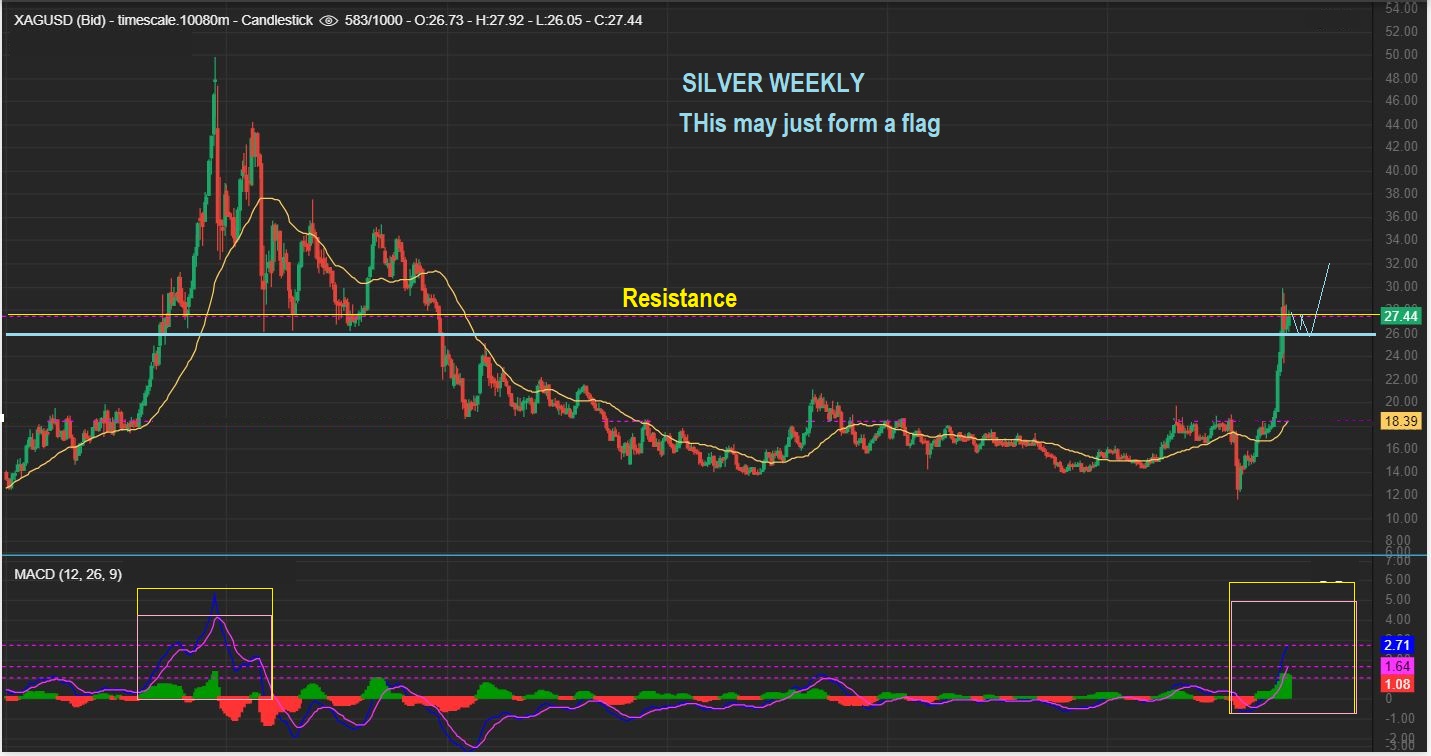
SILVER WEEKLY – So on the weekly, I’ll draw it as a choppy month here and simply a Bull Flag.
.
Before I get into the Miners, I just want to mention that choppy markets CAN make a chart look great for 2 days, and then weak for 2 days, and then suddenly a reversal has it looking strong, followed by a drop that looks weak. I say this because ABOVE I just showed Monthly & Weekly charts that look like our pull back is coming if we aren’t going parabolic. A drop to a dcl, eventual ICL. That said, several MINERS looked really good Friday. It may just be choppiness, but lets look at our Miners.
.
I want to start with the GDX MONTHLY, since it also looks like a DOJI, and that can be a top. If this was a temporary top…
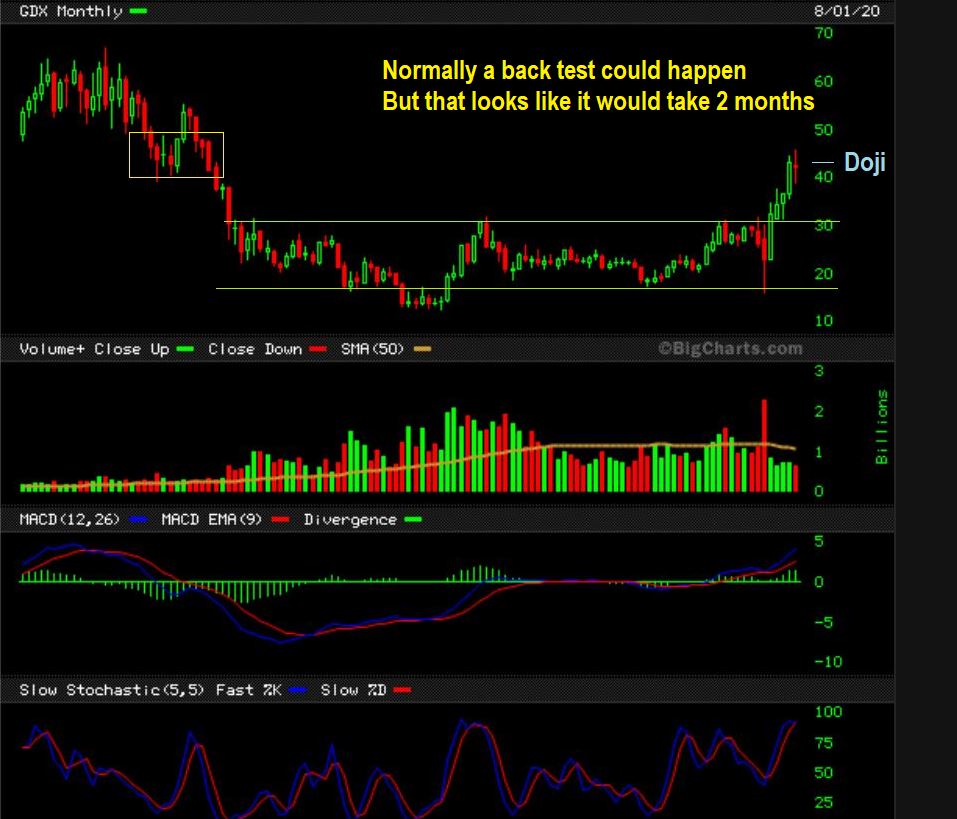
GDX MONTHLY could put in a back test of the break out. That would likely take 2 months.
.
I ought to say that a DOJI like this can also be a 1/2 way pause, and then it can run to the former highs. It is at resistance though.
This next chart poses a problem for me. It looks quite Bullish in a Bull Market:
.
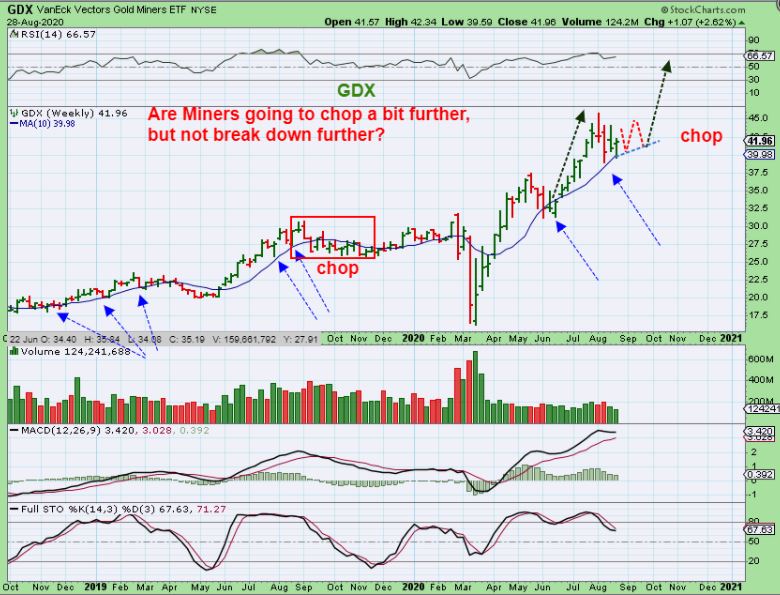
GDX WEEKLY – A reversal off of the 10 week MA is often a bullish sign. Look at that 2016 run and you’ll see a similar reaction around that 10 week ma. What I do notice is that sometimes it breaks that 10ma once or twice ( due to choppiness) and that happened in June 2020 too. Let’s zoom in…
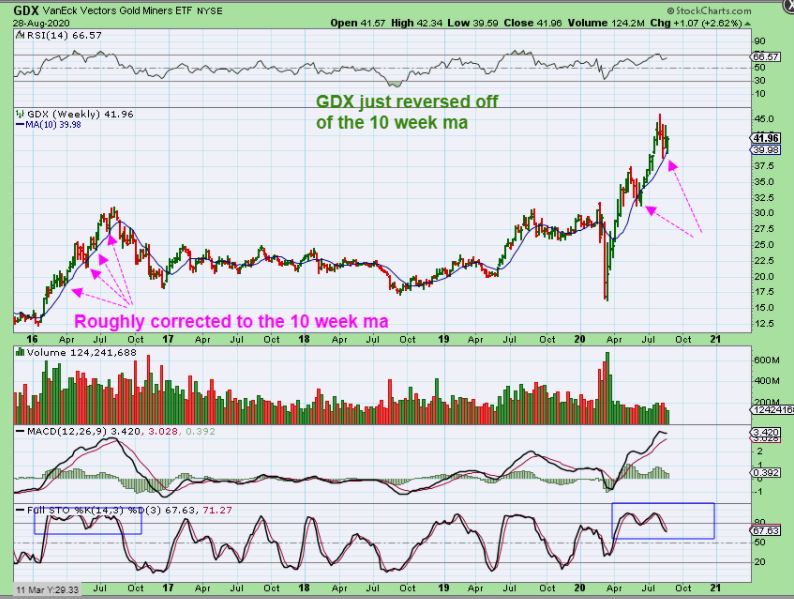
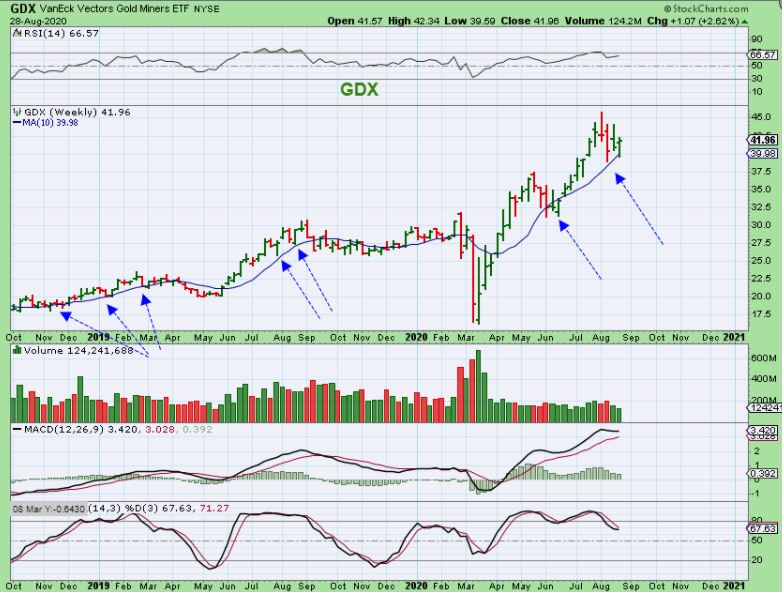
GDX WEEKLY – You can clearly see that the 10 week ma if often supportive, but as mentioned : In June 2020 GDX price broke that 10 ma twice ( choppiness daily).
So is the GDX ready to run and Miners lead the Metals higher as shown? If Gold goes off on a parabolic run that could happen. (That seems less likely at this point) .
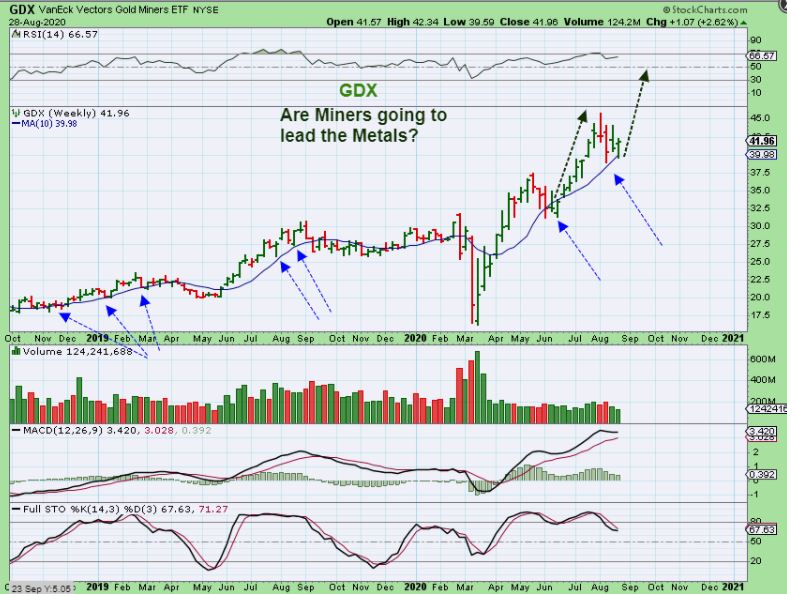
Or should we expect choppiness? If you own Miners, Use stops, expect choppiness, but hope for a rally. It just isn’t all that clear, but Timing-Wise we are due for more of a dip. Maybe we just continue to chop as shown here.
.
I am going to discuss a bit more about the Miners at the end of the report, because if I was ONLY using technical Analysis I would say that quite a few are actually set up as a buy. For now let’s review:
.
– The General Markets remain bullish, and they can stay that way for a while, but the climb is getting steep and that is usually unsustainable. We need to be bullishly cautious. How is that possible? Good Money Management includes proper position size near the end of a daily cycle, use stops (mental or hard stops), etc.
.
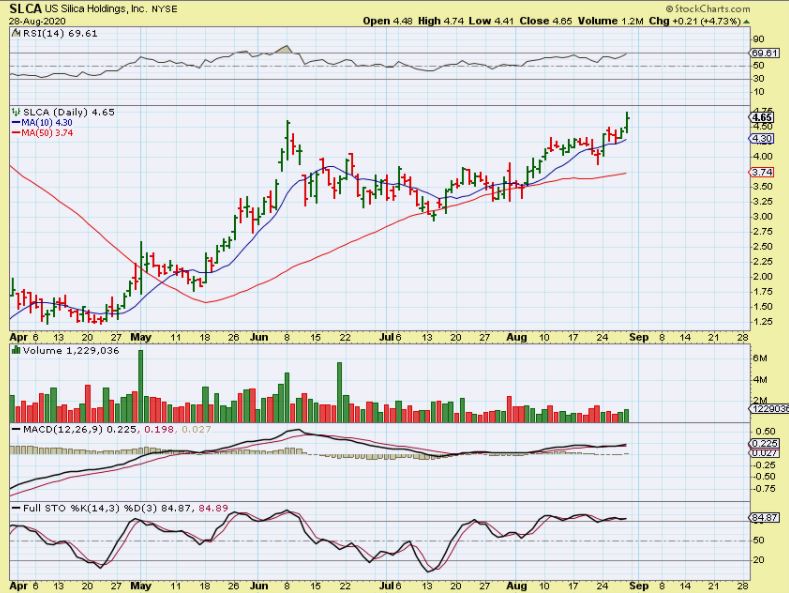
– Oil & Oil stocks are choppy at this point, they haven’t offered the trade set ups that I was hoping for, but some Oil stocks are gradually climbing. SLCA is breaking to new highs and others like LPI & APA looked to me improving Friday. August vacations are ending, maybe Oil Stocks will attract buyers? The XOP is also due for a dcl as mentioned in the mid-week reports, so we’ll see how these play out next week.
.
– GOLD & SILVER do look to be topping on a Weekly and Monthly Chart, yet the Miners have a bullish look to them. I will discuss this a bit further below. I look forward to next weeks trading, since we may see some follow through on some recent set ups, now that August vacation and doldrums should be ending.
Rest up, we may be back to work next week! 🙂
.
~ALEX
.
So let me be clear about what I saw at the end of the week with Miners. They are Mixed at the moment, but as of Friday I actually saw what look to be pretty Bullish set ups in some Miners. This report shows that Gold looks toppy, Silver has dropped & paused, but Miners improved. GDX weekly reversed at the 10 week ma, which is often Bullish. The best way to make something clear is to take a little time to point it out on a few charts. I will show you the Bullish side, but I will temper it with a little caution.
.
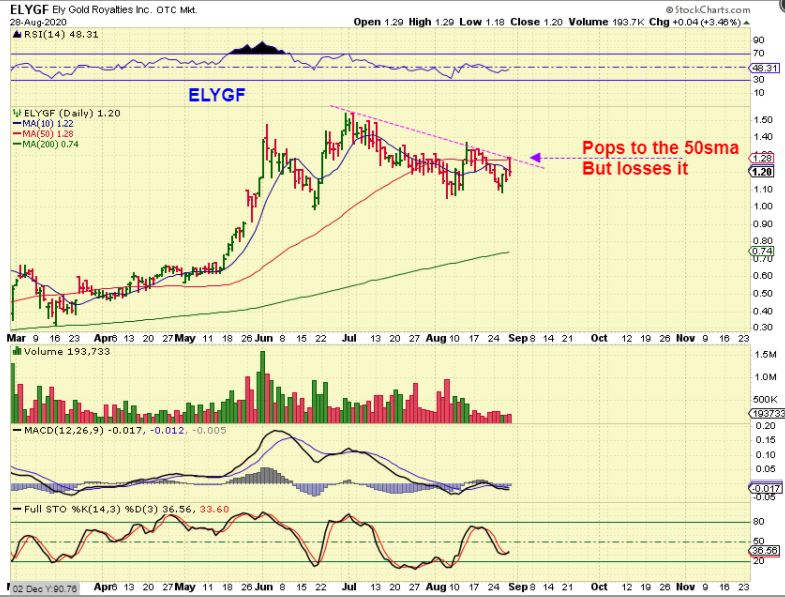
ELYGF was looking good Friday morning as it popped above that 50sma, but it dropped and closed back under it. So this is a Pop & Drop in 3 months of choppy trading, not exactly bullish, but o.k. looking.
.
So IAG had a big drop and is still below the 50sma. This looks like it could go either way. At this point I’m just showing you that some Miners that still look like they could just sell off or remain choppy.
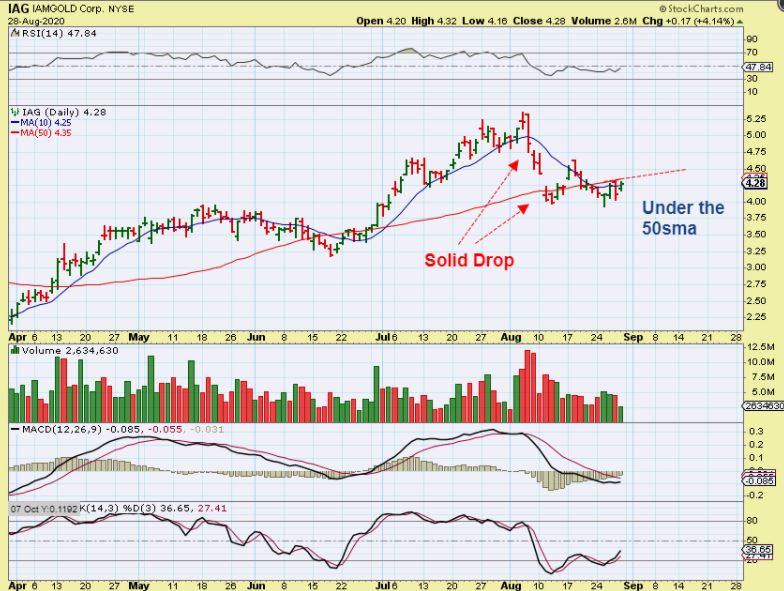
At this point I’m just showing you that some Miners that still look like they could just sell off, but now let me show you some Bullish looking set ups, and they are in Miners. Using Technical Analysis, these actually became buys.
.
EXK and several other Silver Miners actually look really good to me. I would have expected a gap fill & drop to the 50sma, but the gap acted as support ( so far any way), and now volume popped. I would have bought this for a trade if I was home Friday. 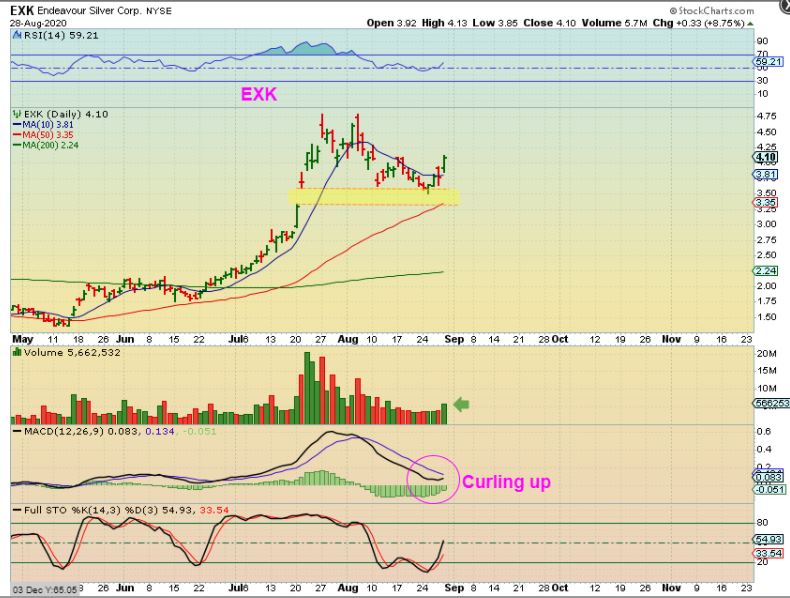
.
August vacation is done this week, are we going to see buying?
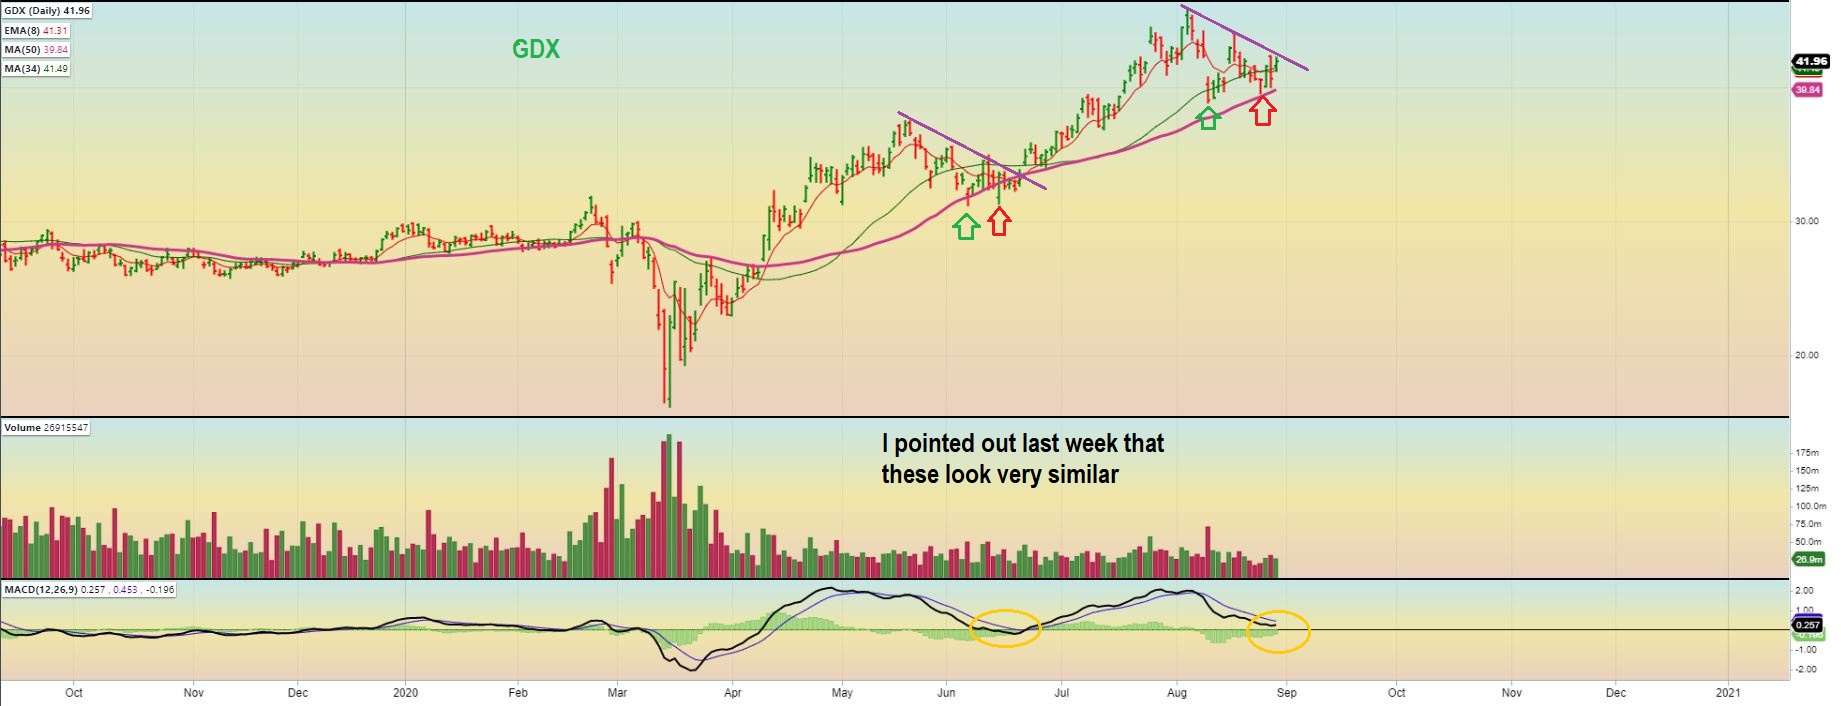
Now that thought started going through my head. August vacation is done this week, are we going to see buying in Miners next week? I pointed out last week how similar these set ups are in GDX, and the last one started a nice rally. Is Gold just going to go parabolic and do a stretched intermediate cycle? We are almost 6 months from the last ICL in March, but anything is possible, including an 8 or 9 month Intermediate cycle, so lets stay alert.
.
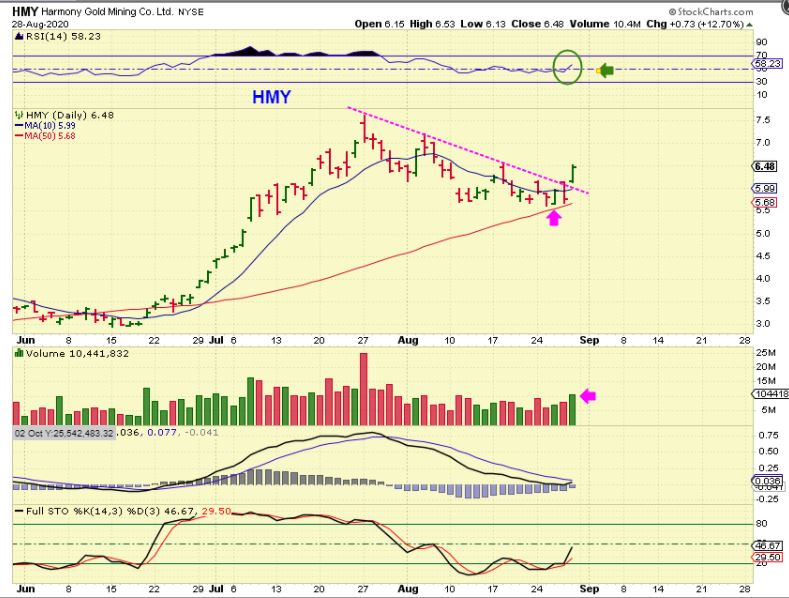
HMY Looks bullish as it popped 12.7% Friday! It landed on the 50sma last week and reversed. Friday it broke the down trend on increasing volume. The RSI is curled up. Like I said in a report last week, even a run from here to double top is a good %-Trade.
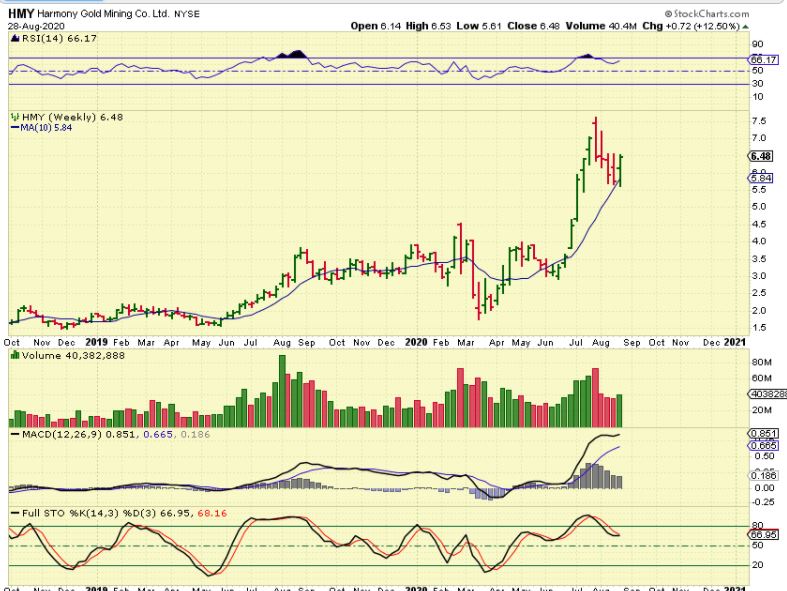
HMY WEEKLY – Then I looked at the Weekly chart and Friday alone pushed it up 12% for the week, off of the 10 week ma.
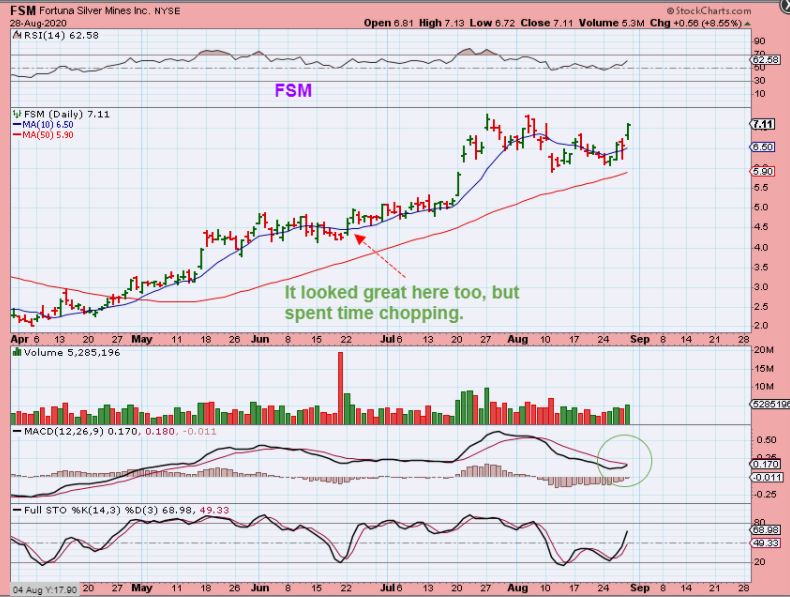
FSM popped 9% and is almost back at the highs. So this is still oversold and quite bullish looking.
So on the 1 hand, this can break & run to new highs and act on its own, or…
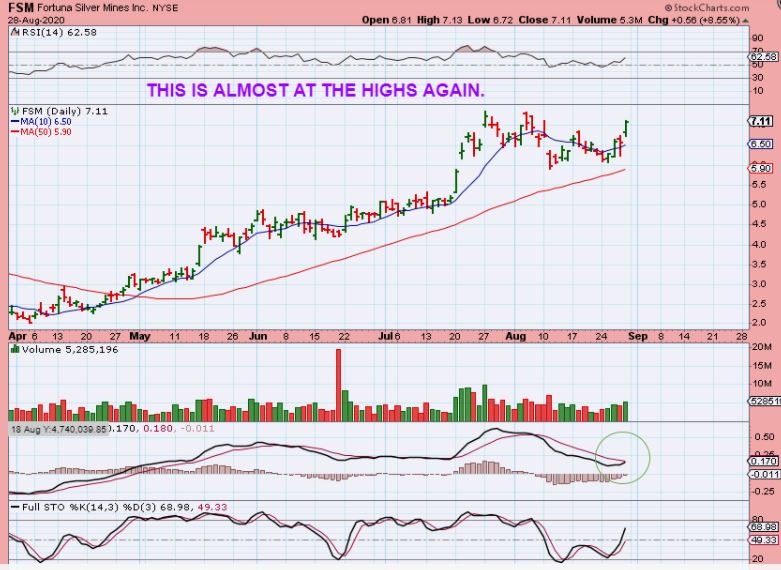
FSM has Popped in the past toward new highs ( see the red arrow) and then just continued to be choppy. I point this out just to show that maybe we aren’t ready to break out and run, but there is no denying that some of these Miners are not looking weak.
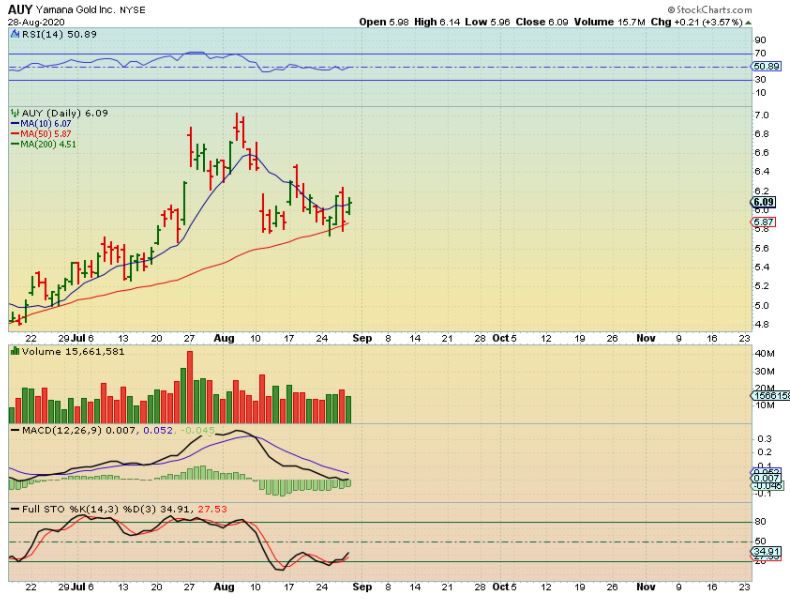
I will also show you AUY . This was last week as it reversed off of the 50sma. You would now expect this to just take off and run, right? …
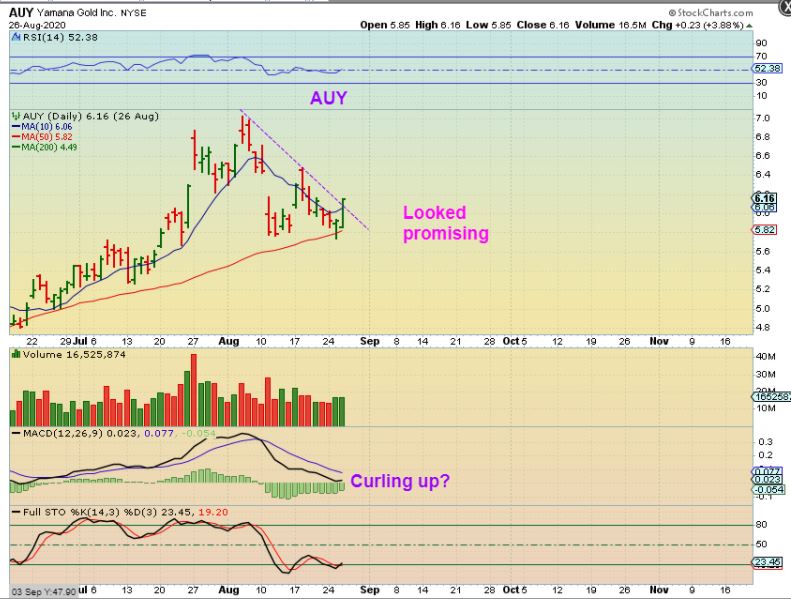
AUY -It gapped open and sold off all the next day and then Friday it was green again. Choppy. Again, my point with this is to show how difficult the current set up is. We are in choppy trading, and the Good Days look really promising while the Bad Days look ready for a sell off. I have to conclude this section by saying what I have been saying all along…
I have to conclude this section by saying that The Monthly & Weekly charts for Gold & Silver do look toppy. We had a good size drop in both. The USD looks to be bottoming. So far we have a big drop off of the Top for Gold & Silver and then some sideways chop. Gold becomes due for an ICL 6-7 months after the last ICL normally, so I played it that way before the drop, but Intermediate Cycles can stretch under Bullish conditions. The March ICL was 6 months ago as of Mid September, so we need to have that in mind. Trading can remain sideways and choppy, and if it does, some individual Miners may act on their own merit. Many Miners do look trade-able.
.
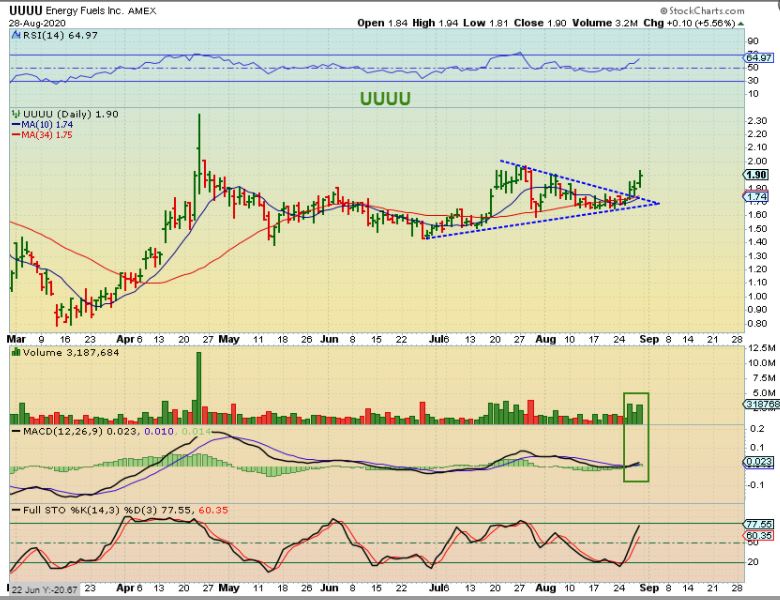
We do not have another report before Mondays trading, so let me also update a few trades from last weeks reports that I feel are acting correctly. For example, all of the Uranium Stocks acted correctly.
UUUU – This was a buy and still can be bought. I bought UEC, but they all look good (UEC, UUUU, NXE, CCJ, URG, etc) .
.
This chart of NKLA was in Friday mornings report. It is in that Electric Car group and had a very strong run a few months ago. I bought it, and said that it is a buy if it breaks above this 50sma ( low risk, with a stop somewhere under Thursdays candle).
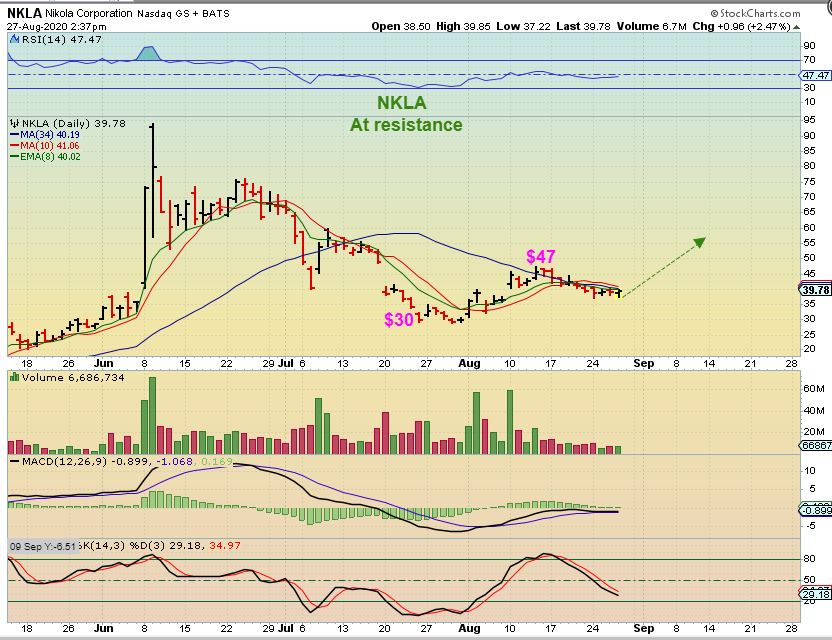
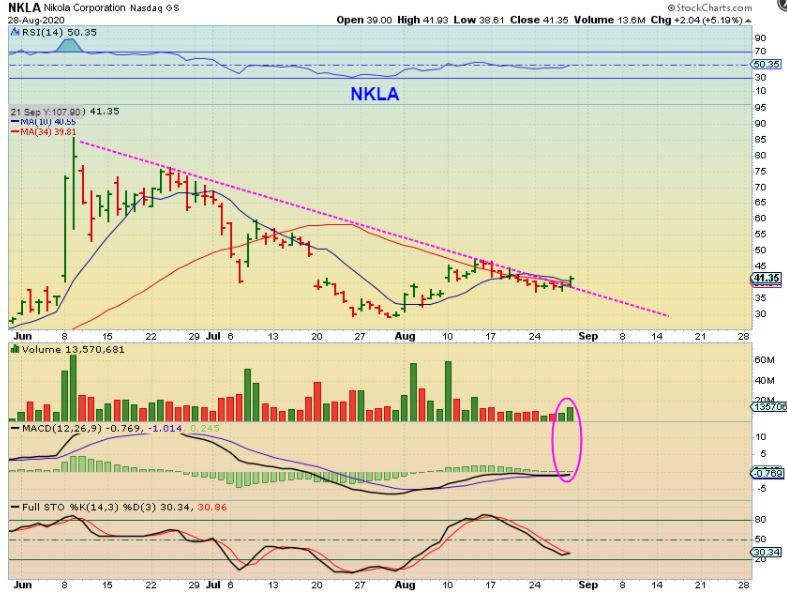
NKLA broke out Friday. I pointed it out in the live area Friday while I was away on the road. I had alerts set and a few of those alerts went off. A stock like this could run from $40 to $80 under bullish conditions.
SLCA has reached June Highs. It may be ready for a good break out, but I’d like to see more volume. I still own this, BLDP, and FCEL. They have been a little slow & choppy, but I’m hoping that That ends with the September trading.
.
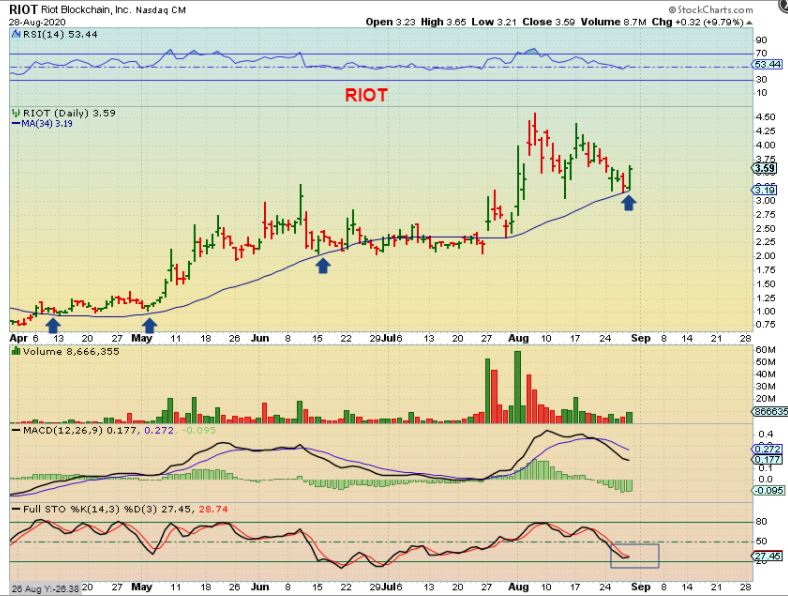
RIOT – This consolidation may finally be finishing up. It had a nice reversal off of the 34 sma and it reached the oversold area. RIOT hit the $3.20 area 3times last week & reversed higher. It could be bought with a stop at that 34 sma. It was also a buy at the 20sma about a month ago, and that low was never broken either.