Wednesday August 12th
We had quite the crash yesterday in The Precious Metals sector. We also started to dip down in the General Markets at the end of the day. We knew we were due for a DCL in both sectors, so it wasn’t unexpected, but the Degree of the Precious Metals drop was a bit large. Gold was down over $100 and Silver was down around $4, so we will discuss that sector a bit more than the others.
.
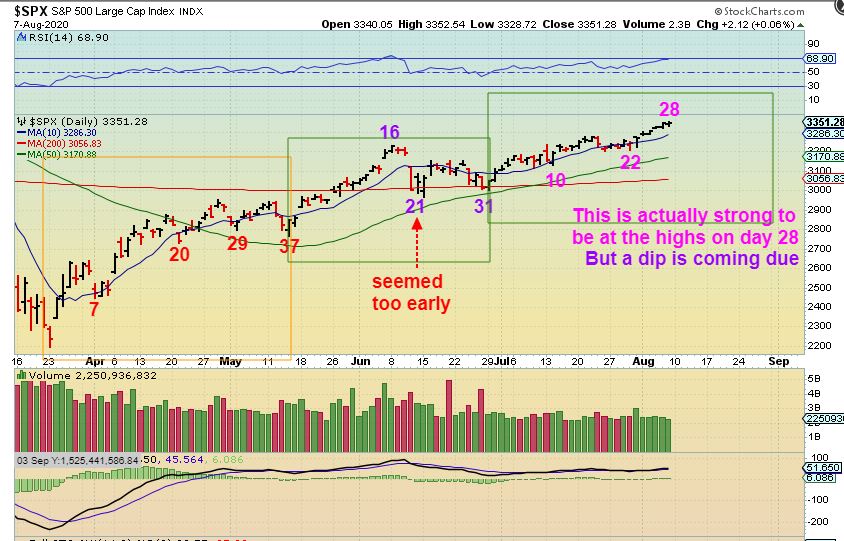
REVIEW OF SPX DAILY COUNT FROM FRIDAY – The first daily cycle lasted 37 days, and the 2nd daily cycle was 31 days. This count put us on day 28 FRIDAY and thus it would be day 30 as of Tuesday. I mentioned that We may be coming due for a dip soon. Please read the chart.
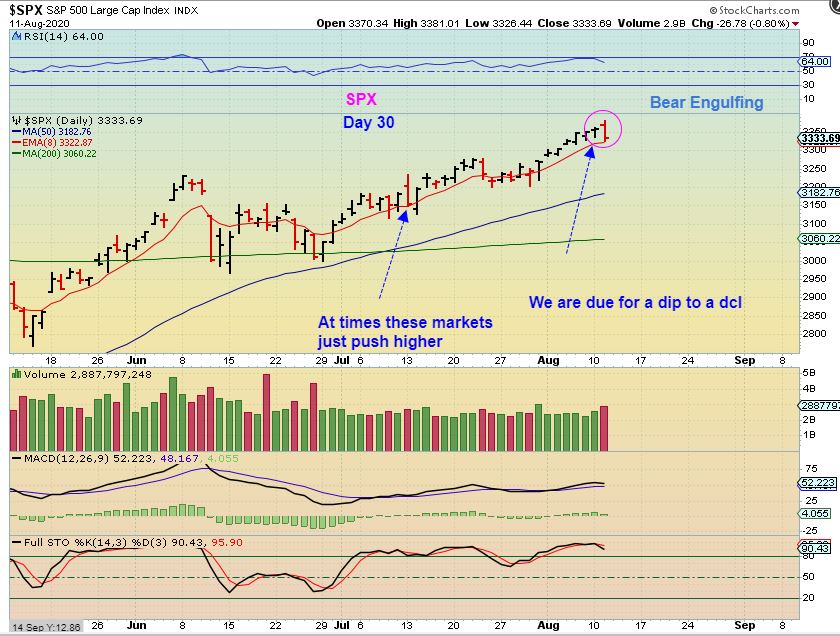
SPX day 30 – The markets started off higher , but sold off into the close. That gives us a bear engulfing and those usually indicate that sellers overwhelmed Buyers and are in control. I am writing at 4:30 a.m. eastern and the futures are up quite a bit, but we might stlil get a gap higher & continued sell off – OR – that was a quick 3/4 low and we run & drop later. Either way, We are due for a dcl.
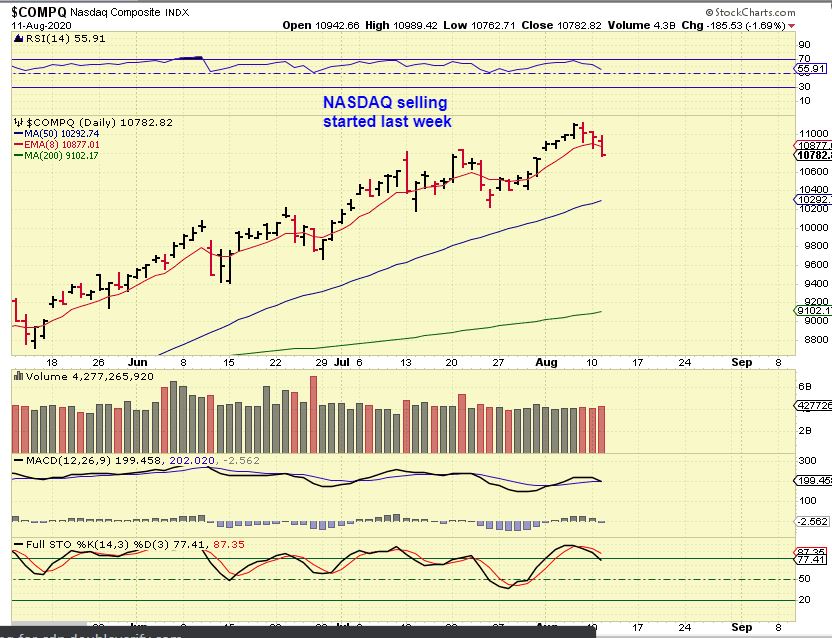
THE NASDAQs selling really started last week. Just a quick dip or has the drop to a dcl started? These markets have been strong, so time will tell.
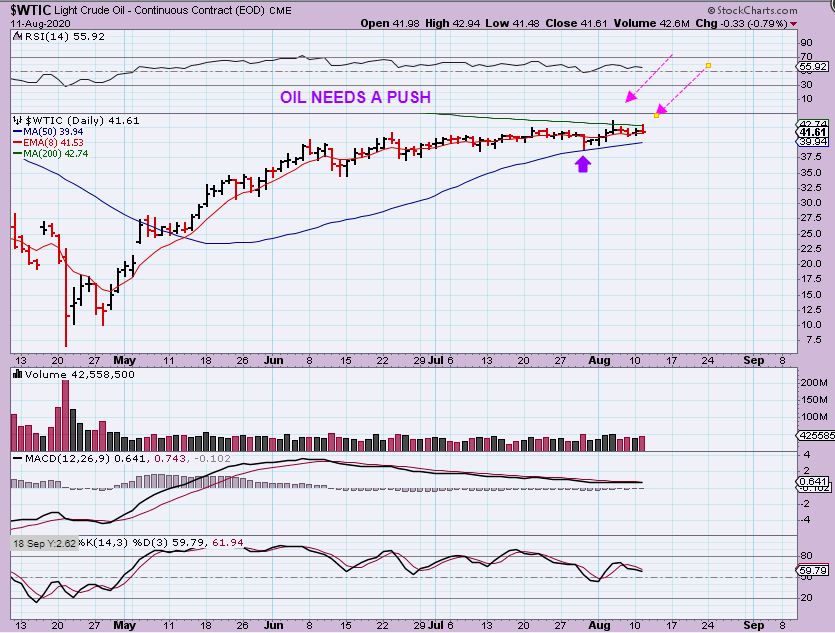
WTIC still was unable to get over that 200sma. I have been expecting Oil to push higher and the XOP did break higher. That said, TODAY IS THE OIL INVENTORY REPORT AT 10:30 Eastern and we are in a tight squeeze. I want to watch this sector closely, because…
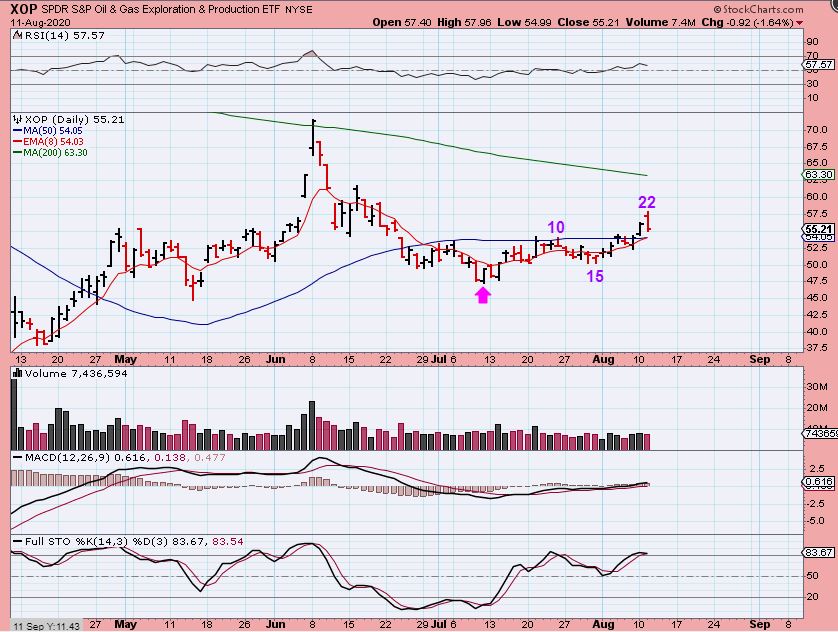
THE XOP actually bottomed well before oil, just like it did in March when oil bottomed in April ( 1 month apart). So it seems that the XOP is on day 22. That alone is fine and this could chop around waiting for Oil and it also can still go higher, but I just want to keep a close eye on things…
1. If Oil sells down and
2. If the General Markets start selling too, it may affect oil Stocks.
3. As you can see, at this point the XOP was acting bullishly breaking above the 50 sma.
.
PRECIOUS METALS
.
When you see a drop as steep as we saw yesterday, you really don’t know for a certainty what will follow. Was it exhaustion selling, a sell down day that happens all at once? Is there follow through ahead, as more profit takers cash in in fear of losing their gains? We have a few ideas that can be helpful, but no one really knows for sure what will follow. We are late for a dcl, so some will think that we got a 1 day drop dcl, and off we go to new highs ( and that could be the case). Afraid of missing the move, they will buy the 1 day drop. Others would think that we could get more selling and they’ll stay ‘better safe than sorry’ for now, and watch how things unfold.
.
I just want to say that there is more than 1 possibility, and it will take time to know for sure what that 1 day drop meant. That means that you just need to know what kind of a trader/ investor you are risk-wise & FOMO wise (fear of missing out), and take it from there. I CANNOT tell you what exactly will follow, but I will discuss the plausible possibilities, so let’s get started.
.
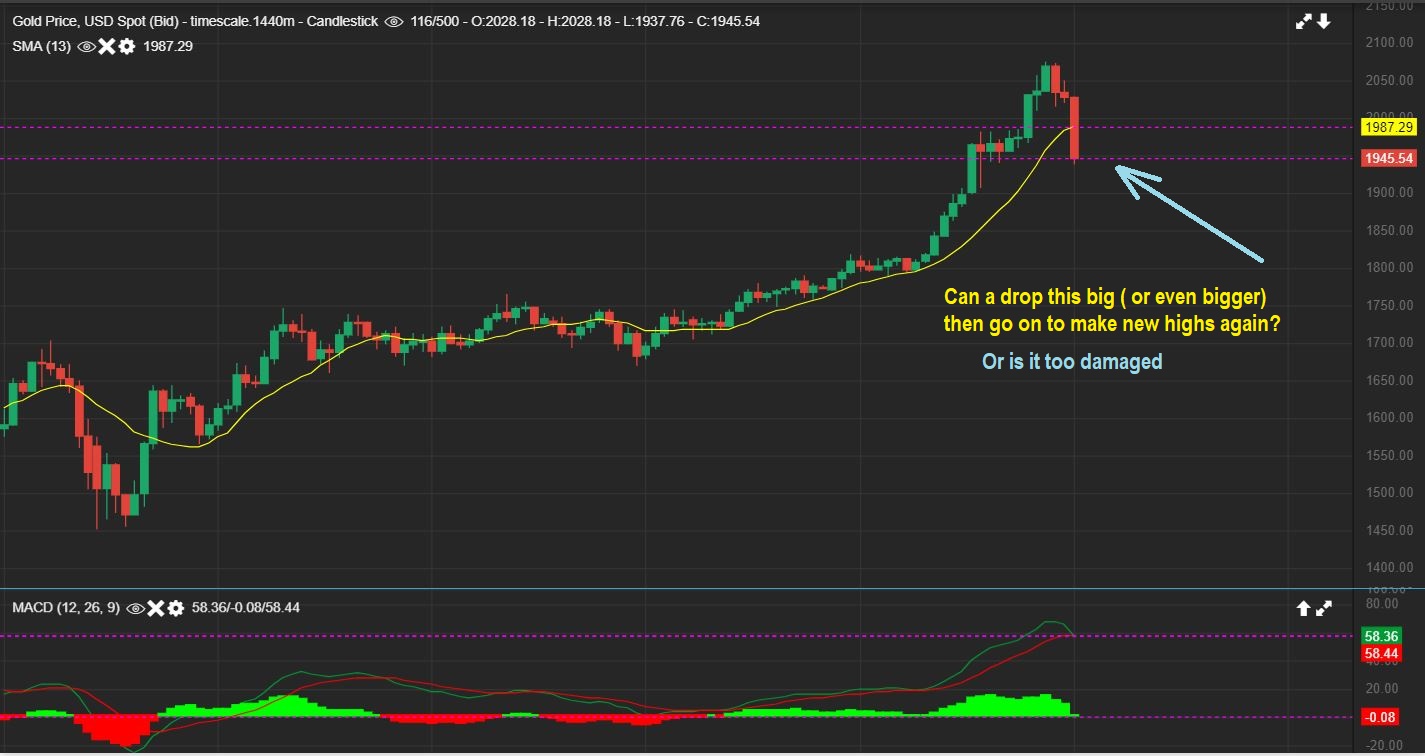
GOLD DAILY – Midday yesterday Gold was down quite a bit. I was asked a question about Cycles, ” The last daily cycle was right translated, but with a drop like this, I don’t see how we could recover and make new highs . Is it still possible to get back to making new highs with a drop like this.?” (See the chart)
.
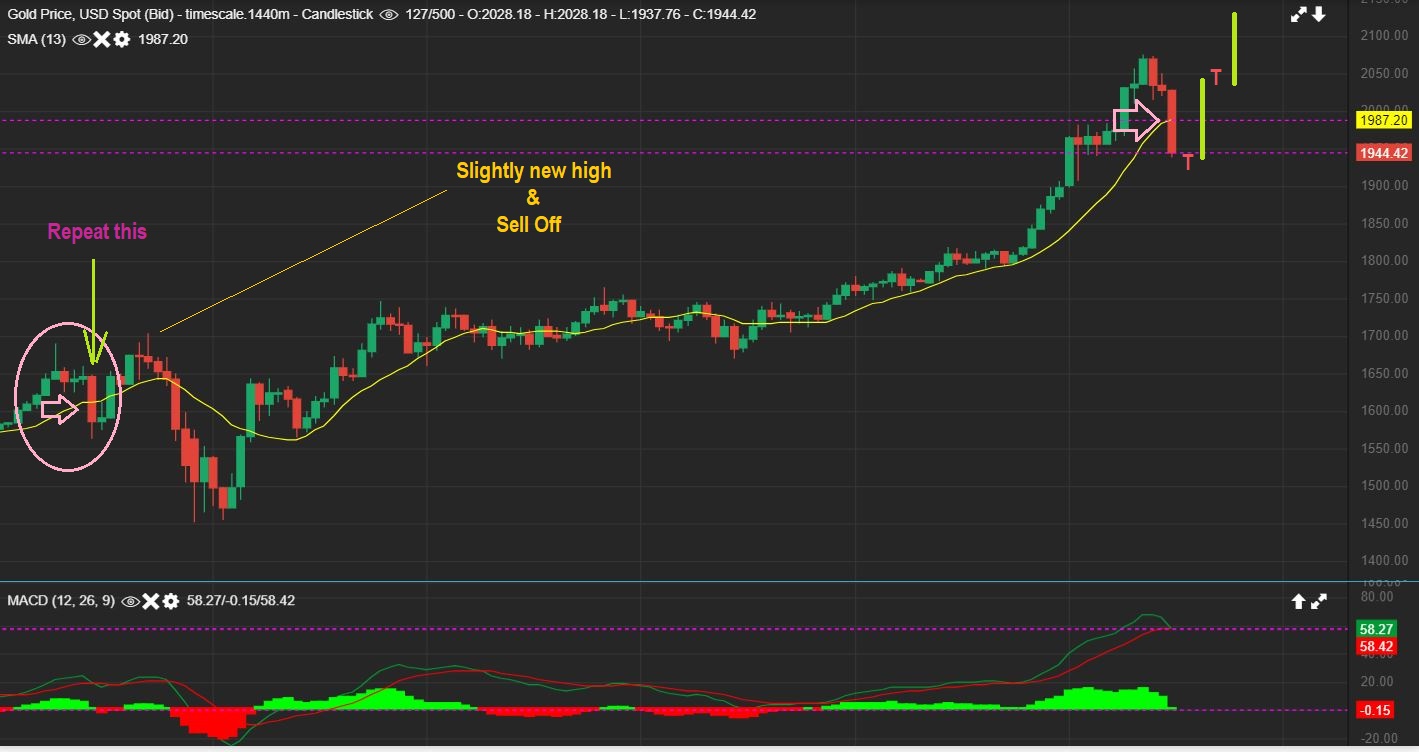
GOLD DAILY- The answer is “Yes, it can”. That doesn’t mean that it will, but look at what happened back in February. We had …
1. A peak in the pink circle and then a 1 day flash drop.
2. We then saw Golds recovery to slightly new highs, and then it rolled over into the ICL.
3. That could happen here, I drew it in, but we should still have an ICL ahead.
.
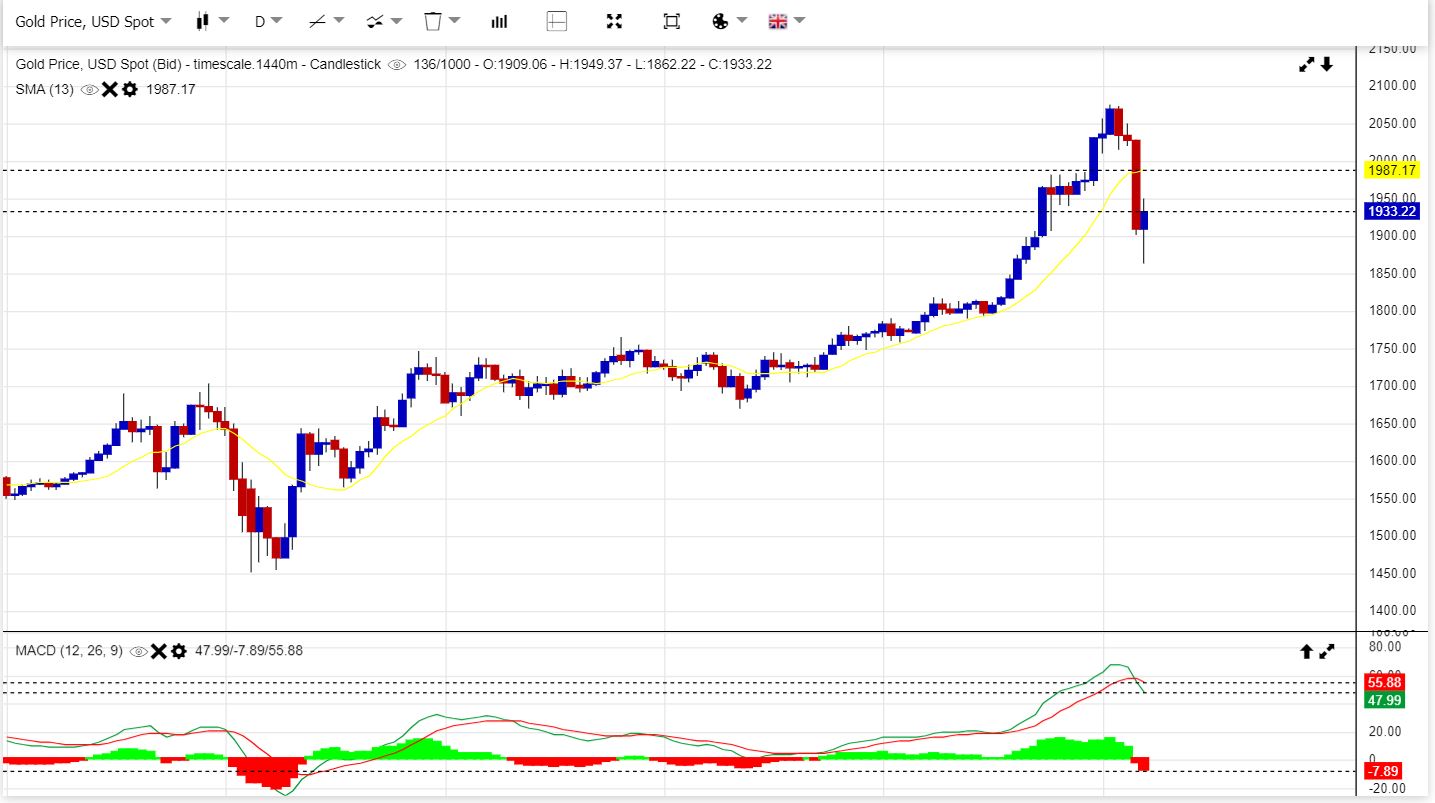
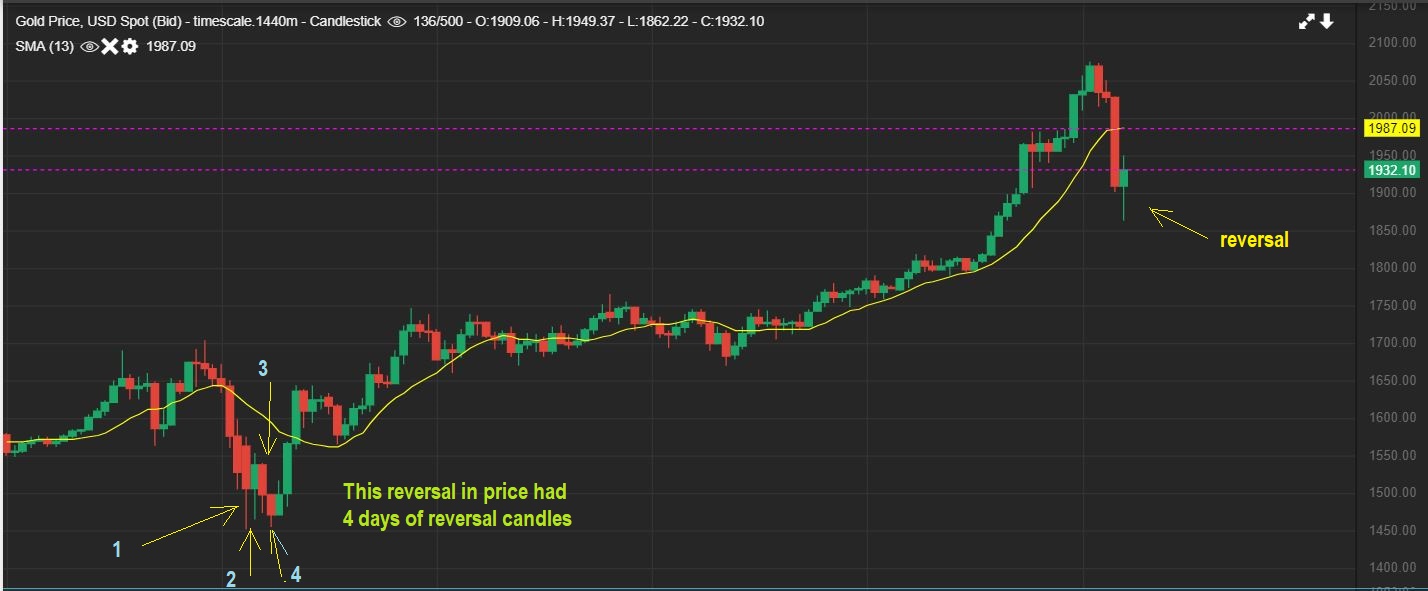
This is GOLD on Wednesday at 4:30 a.m. eastern time as I write the report. Gold dropped further overnight and has now put in a reversal.
Some will ask, ” Was THAT an ICL? Gold dropped from $2072 to $1862! That is over $200.” Answer: There is no way to know when moves like this take place in a strong Bull, but it seems unlikely. Let me show you something else too…
.
When we see a reversal candle like this and I say, “We don’t really know what’ll happen next.” Some would think, well it is a reversal, so obviously we are going to take off higher and we’ll just see what happens next…
.
The GOLD REVERSAL at the prior lows did not just take off higher. It put in a 4 reversal days in a row. We saw a reversal, it dropped again & reversed, dropped and reversed etc. It is things like this that cause me to say that ‘at this point we just don’t know exactly what will happen next‘. We could take off higher, we could chop around, we could drop. 4 reversal days would mean Gold pops and drops & pops for the next 4 days into next week at the lows, and that frustrates some people. Others would jump in and just try to ride it. Still others will watch and wait.
.
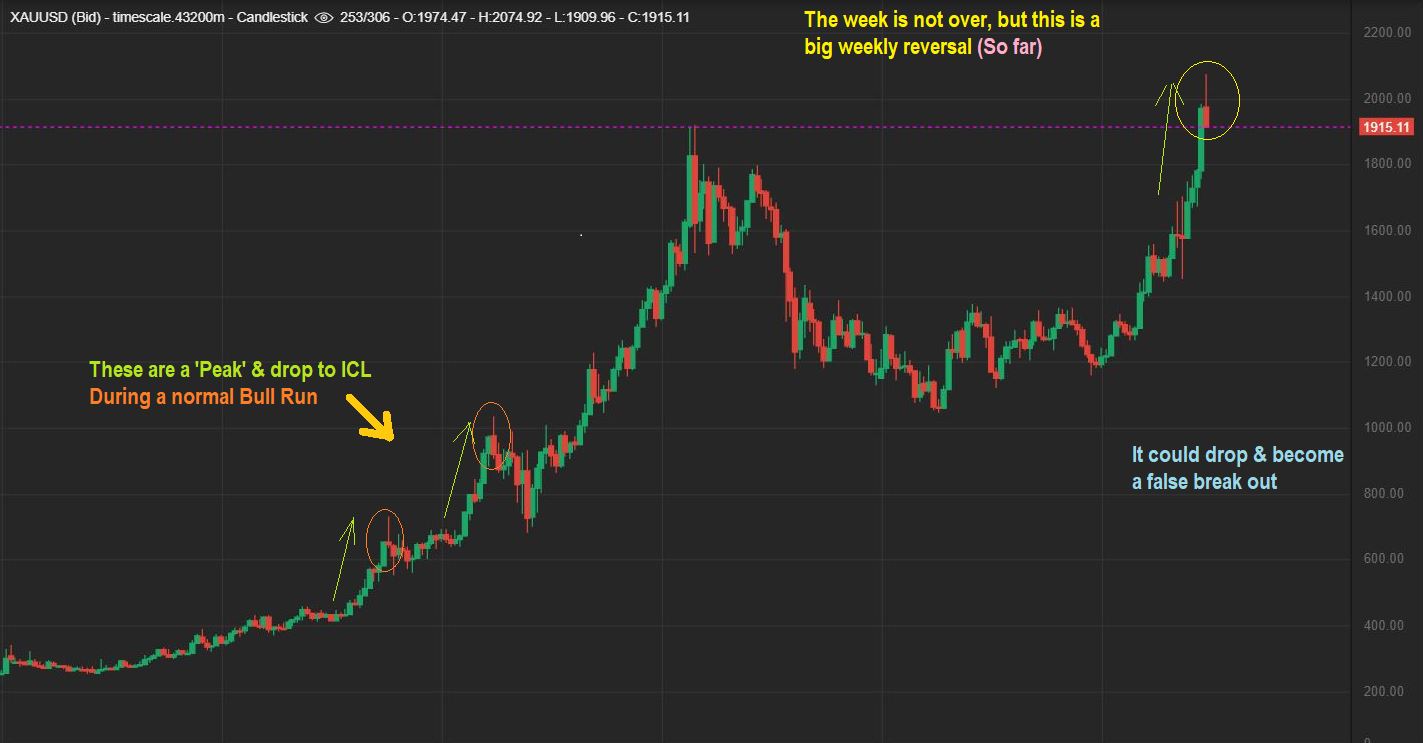
GOLD MONTHLY– YES, I AGREE—-It is Way Too Early to look at a Monthly chart 🙂 Why? We are only on Tuesday of week 2 of August, and that is very early in the month. I just think that the big picture is a good reminder to view at this time anyway and you’ll see why…
.
If we do not blast off to new highs after this drop, and we close here or lower, then the Monthly candle will look like a false break out. That is still normal action in a Bull Market. We often run to a new peak and then drift back into an ICL. See the chart and the circles on the left hand side.
.
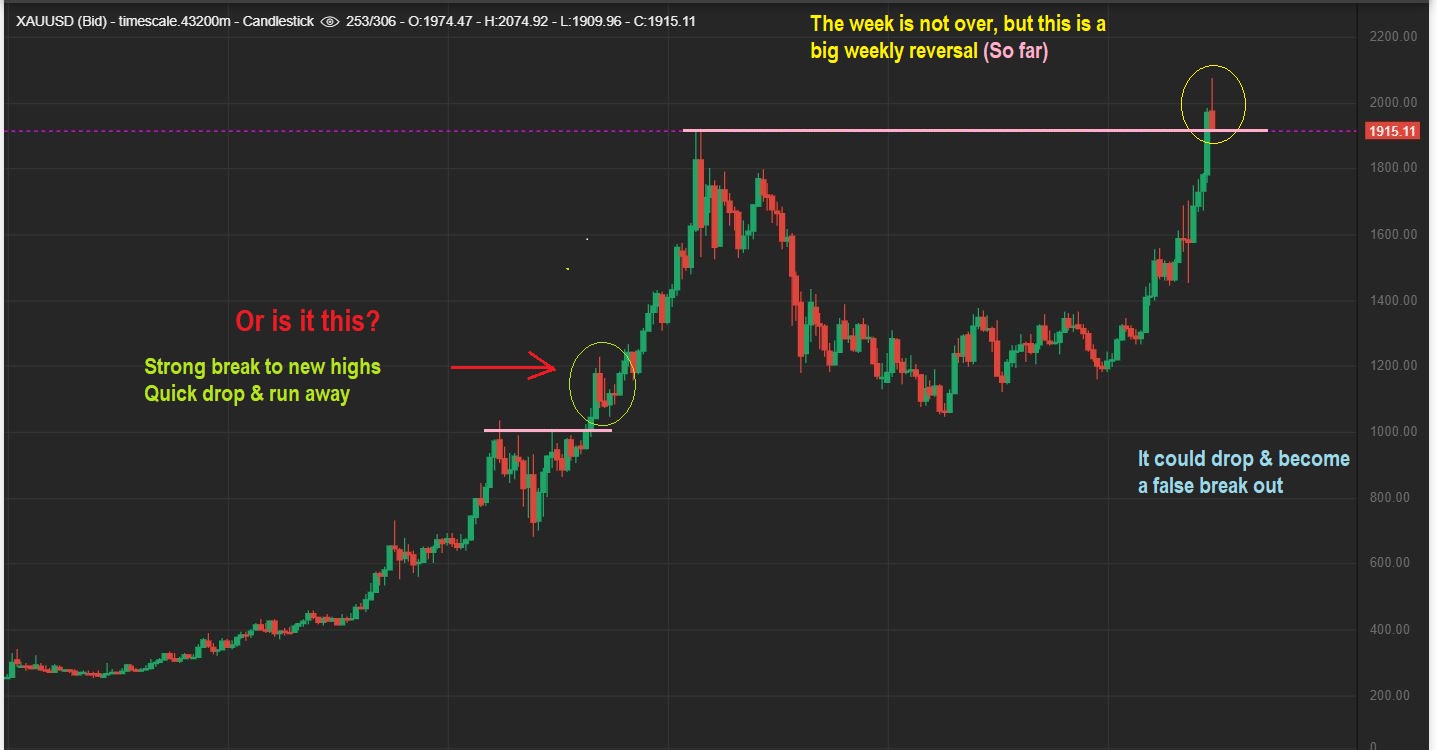
GOLD MONTHLY– I should also highlight the ‘break out and run to new highs’ after the 2008 crash. It had a 1 month crash after the break out and then continued higher. I do want to remind everyone of one other thing about that Monthly crash to an ICL…
.
I do want to remind everyone of one other thing about that Monthly crash to an ICL…
.
GOLD WEEKLY – 1 month is 4 weeks. That 1 month crash was actually 1 month of a drop and the next month dropped to a new low and reversed, so it was really 7-8 WEEKS of chop & drop. See the arrow on the chart. THAT is what a 1 month drop looked like after the peak was in place. If we have a peak in place now, we could drop & chop for weeks down into an ICL.
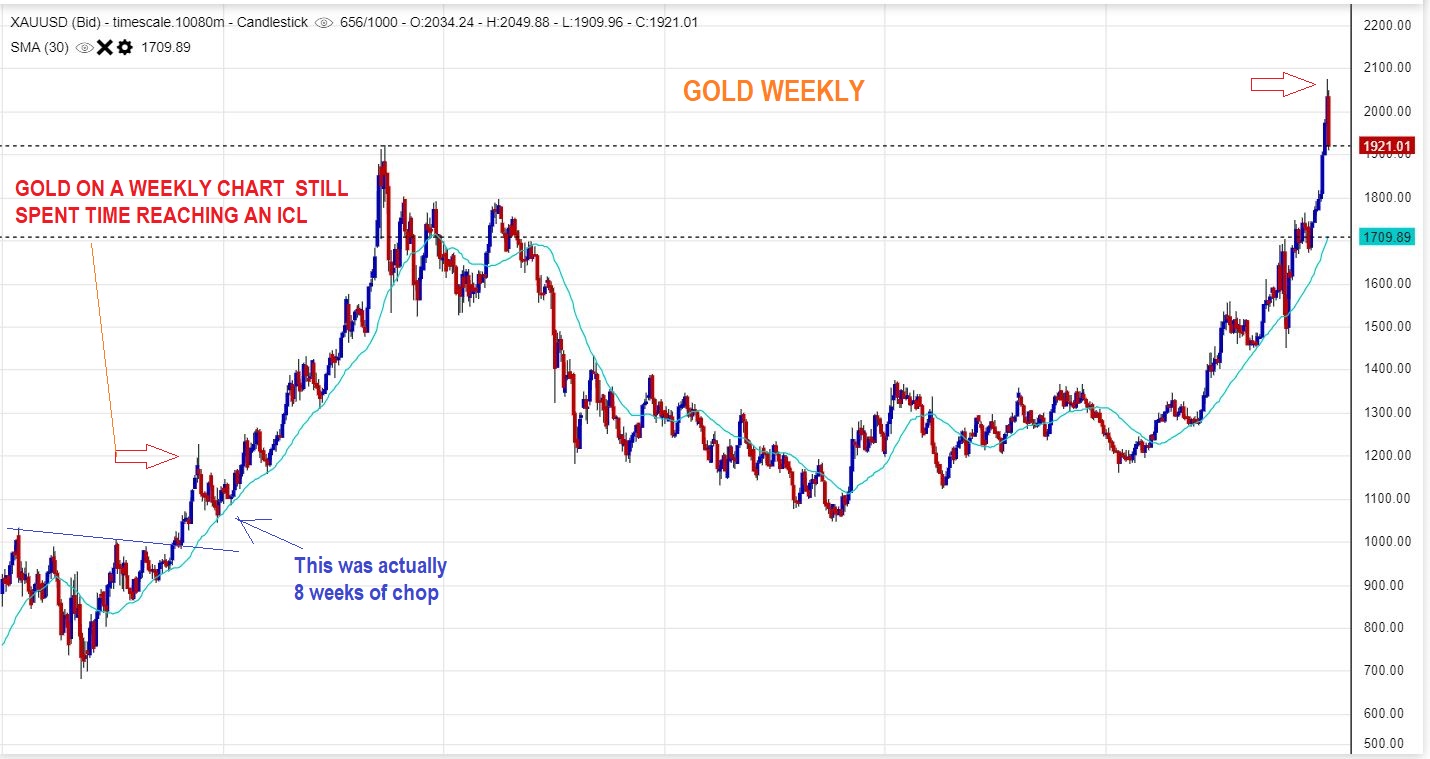
To be honest, I can picture a dip into an ICL like the above drop , and I can also picture another daily cycle just ripping higher after that slam down move. How do I play that? For me personally, I’ve made great gains already and I don’t want to chop those gains up, so I would be cautious until this area clears up. I’m not going ‘all in’ on what could be a 4th daily cycle. I’ll explain that just a bit more at the end of the report.
.
.
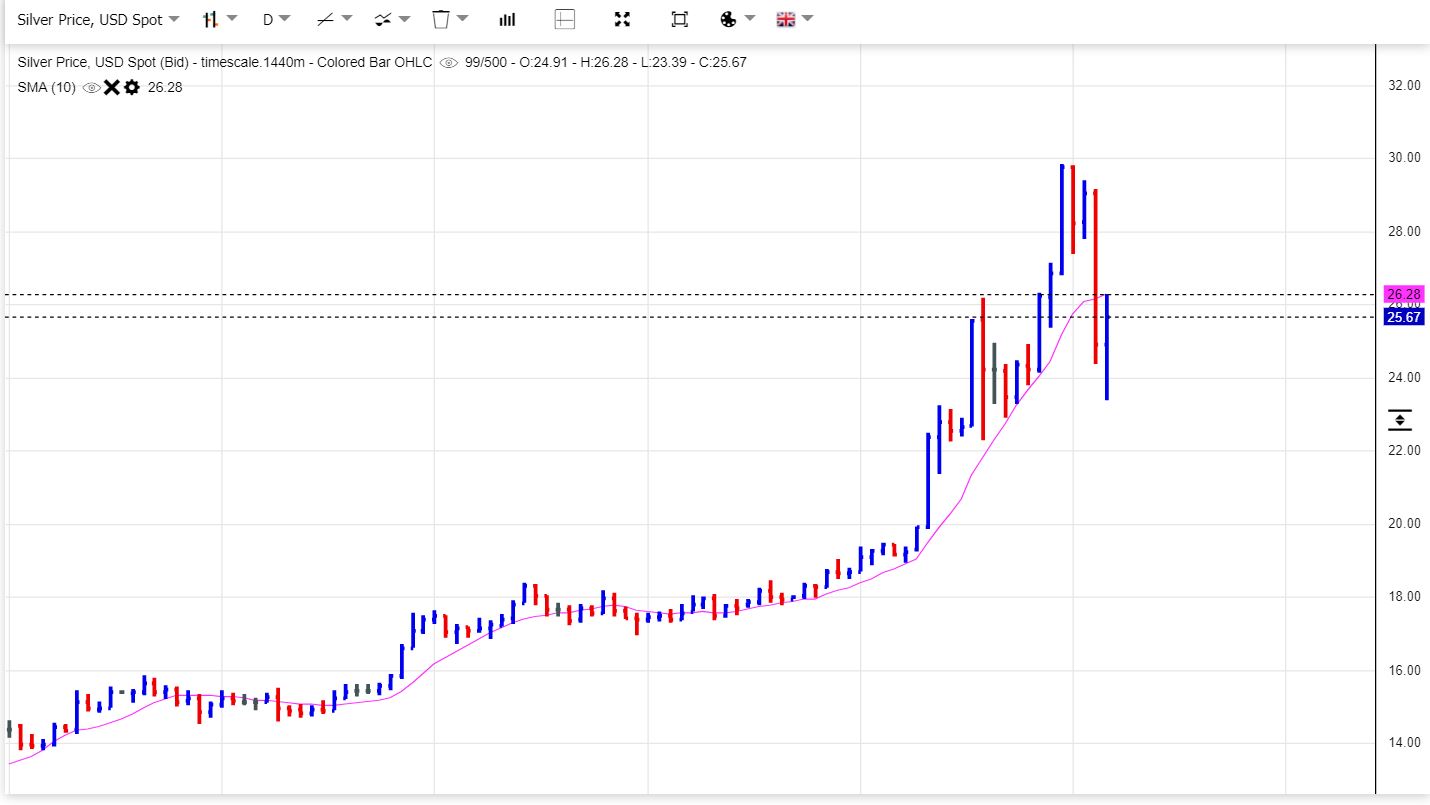
SILVER DAILY 5 a.m. Eastern Wednesday – Silver dropped further overnight and also has put in a large reversal. It did stop right at the 10sma, so we’ll see if it can push higher as the day goes on.
.
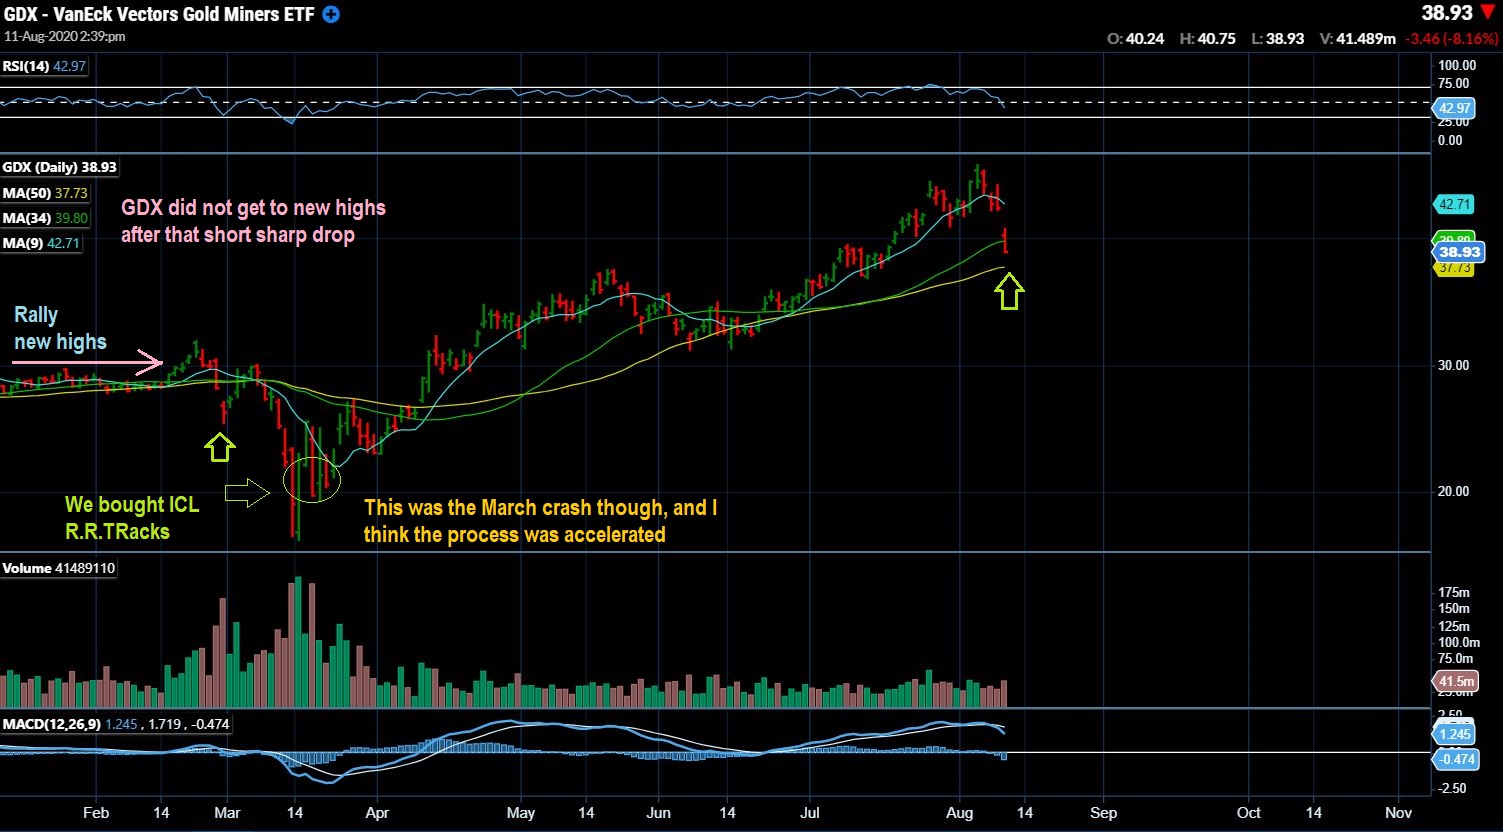
So as a reminder, on the left hand side of this chart I pointed out that after a strong 1 day flash crash in February, Gold DID make it to new highs ( and then rolled over). What did GDX do at that time?
.
GDX did not make new highs after that drop at a time when Gold did. Miners put in a weaker bounce so we can watch for that too. It may help us to gauge the strength of the move out of the lows, if we move out of these lows.
.
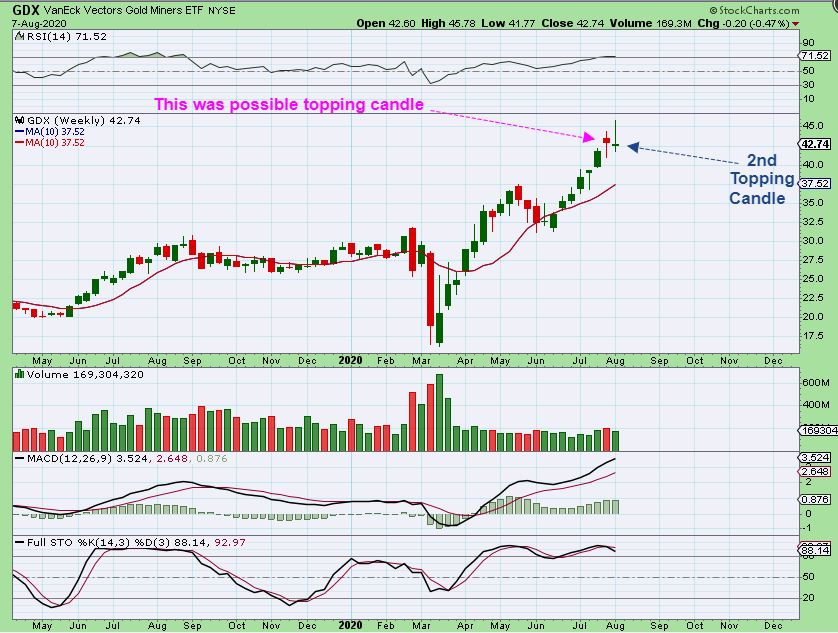
REMINDER #1 FROM RECENT REPORT: We have had 2 weekly reversal candles and I said that I expected a drop. I said that I sold my Miners. I did also have $45 as a target a few weeks ago…
.
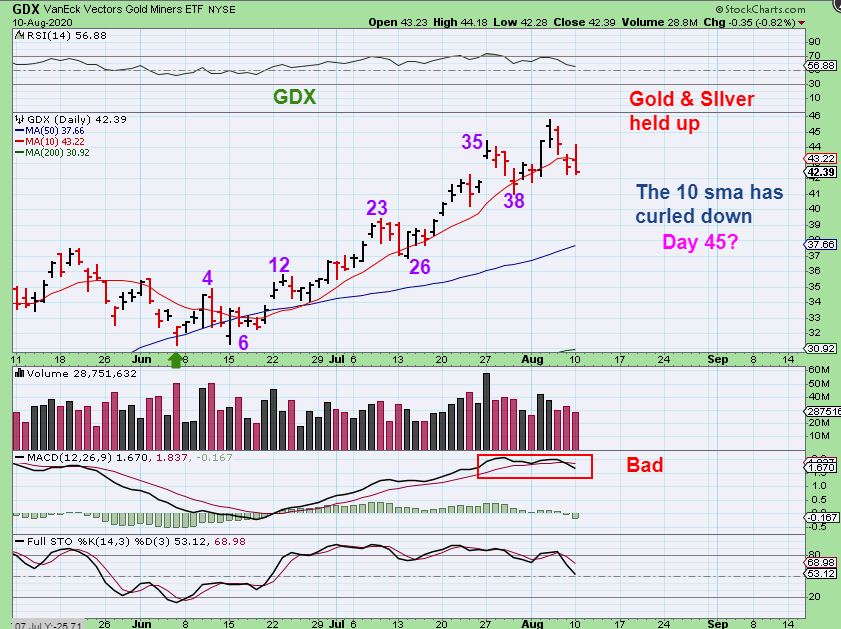
REMINDER #2 FROM YESTERDAYS REPORT:
GDX dropped again on Monday. Day 38 may have looked like a dcl drop, but I didn’t label it that way. This is looking more like a dcl drop with that trend line break & 10sma curl downward. So this is day 45? See the chart.
.
GDX is now priced where it was in early July , and actually only $1 higher than where it was in May! That drop erased the past 4 weeks of trading. These Miners can drop FAST, and this is why I do not want to ride a drop into an ICL down.
.
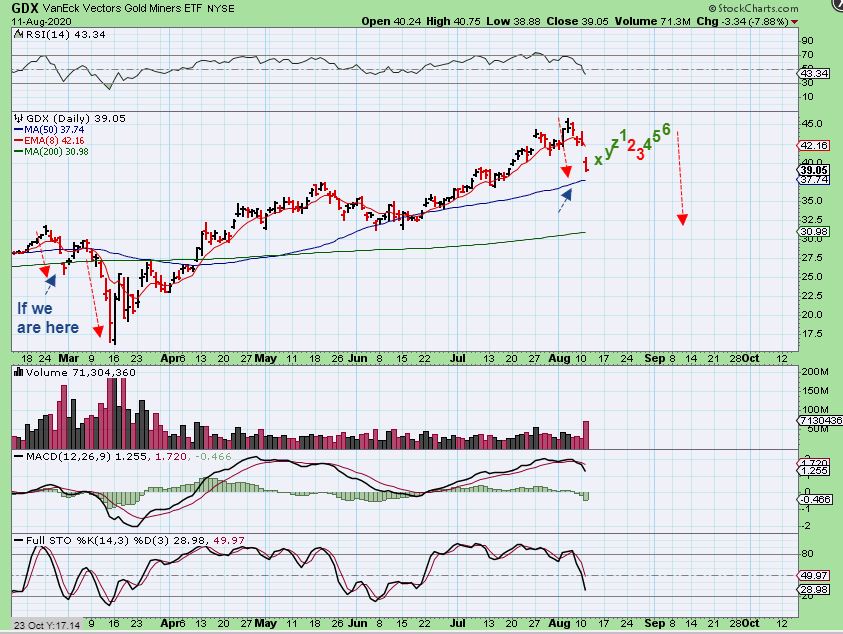
IF THAT WAS DAY 45 for GDX, then the slam down drop Tuesday was day 46 and that may end the sell off as an exhaustion move ( short term). It could be a dcl, So
1. We were late in the cycle count and we had a 3 day sell off in the GDX as of Monday
2. On Tuesday we saw a sudden crash down gap down day, but it is still too early to know ‘exactly’ what comes next. The count is late, so I would expect a dcl, but it may play out like the Feb bounce and lead to a final drop into an ICL as shown.
.
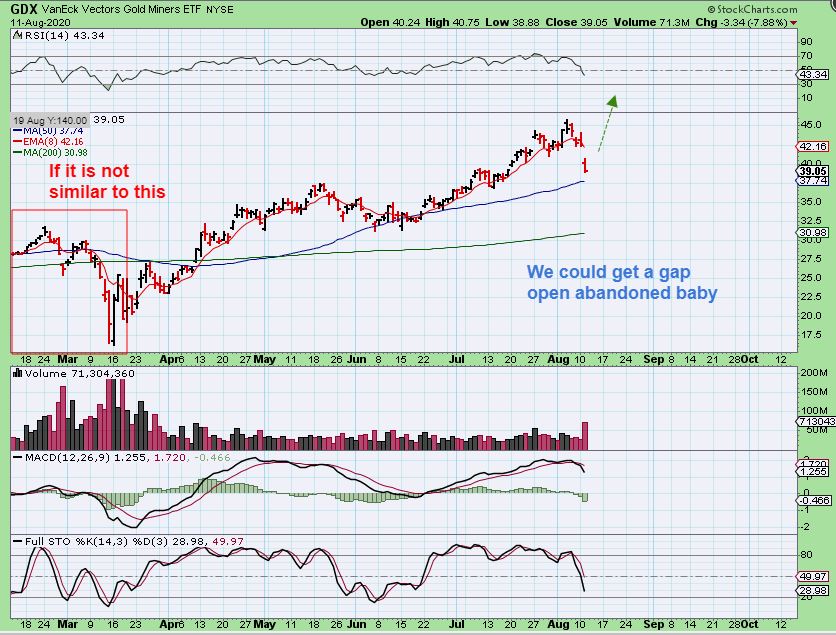
If GDX is not going to do what we saw in February, we could get a gap open higher Wednesday and leave an abandoned baby just above the 50 sma. If you buy that Gap open, Then you’d take it step by step with a trailing stop.
.
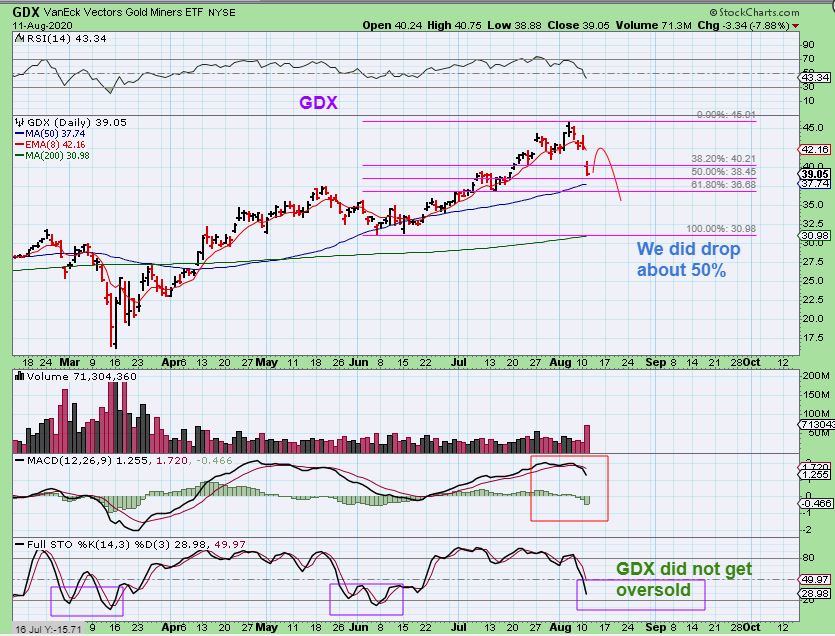
GDX – As a side note, GDX did drop & give back about 50% of the last daily cycle. That seems normal for a dcl and the timing is late, but now I also see a double top with divergence in the RSI, so this next bounce may be the 4th & final daily cycle that rolls over into the ICL, as discussed above. I drew it that way on this chart.
.
I am NOT going to sit here and tell you that I know EXACTLY what will happen next. You can see from my report that there are various scenarios. Jumping in at this point with this reversal could mean that you are catching the next dcl or low and you use a stop. It also could mean that we are on the final daily cycle before it rolls over into an ICL drop, so you may be buying near the top, as we bounce into that double top that could possibly become a H&S. THAT is why I recommend caution. I have seen some people just ride Miners down into an ICL because they don’t use stops, and I have seen that punch in the gut feeling take its toll. ‘Buy’ a reversal if you want, but have a plan, use stops and honor them, and definitely Stay Frosty my friends!
.
This may be a good day to just sit and watch how things play out in all sectors of the market, it may be a good day for ‘traders’ to catch a bounce. If I take a position, it will be with a view toward it being ‘a short term trade and maybe more’. Enjoy your Wednesday trading!
.

