
Wednesday August 5th
We briefly lost power during a storm and I got behind time-wise with gathering charts and putting this report together. I am releasing it without proof reading, so please ignore any typos. I will go back and fix them after I release this . Thanks 🙂
,
SPX JUNE 30 – A month ago we had what I labelled as a dcl day 31.
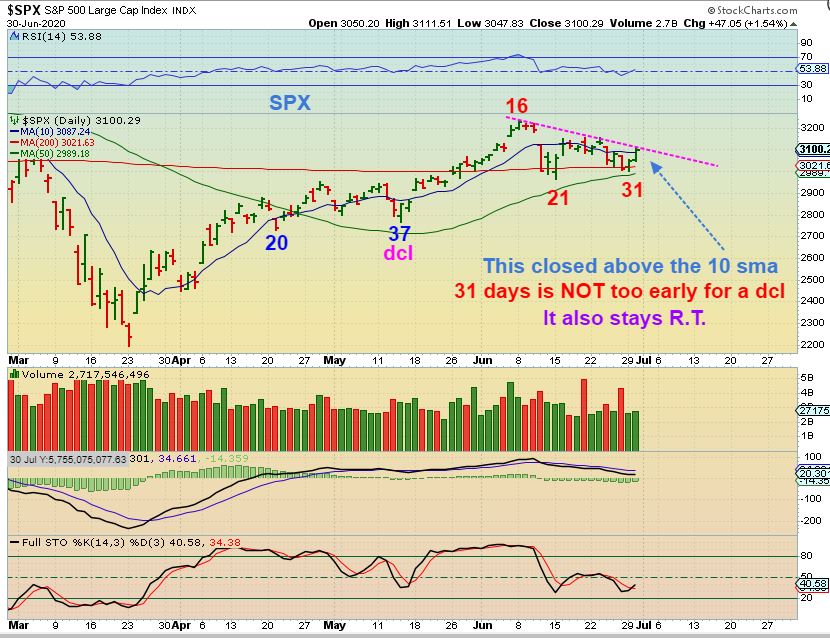
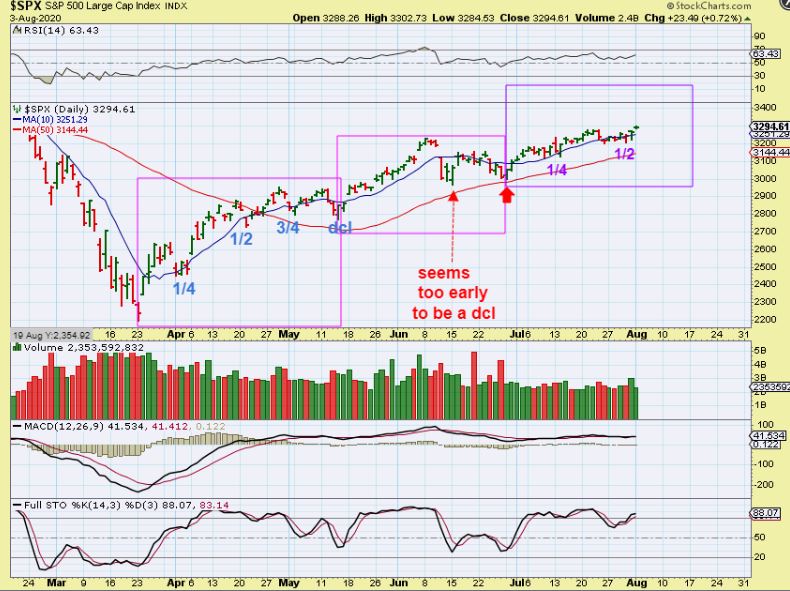
SPX FROM YESTERDAYS REPORT : So in our first daily cycle I pointed out normal ‘dips’ during the 37 day run. We had a 1/2 cycle low & two 1/4 cycle dips. Then in the 2nd daily cycle, we had a deep dip near day 21, and I labeled it a 1/2 cycle low at that time. The next dip I called a dcl as day 31, and now we are in the 3rd daily cycle. I see 2 small dips , but now we’ve moved back toward the highs. It remains a bullish set up above the 13 sma ( 10sma is shown). Many individual stocks remain bullish.
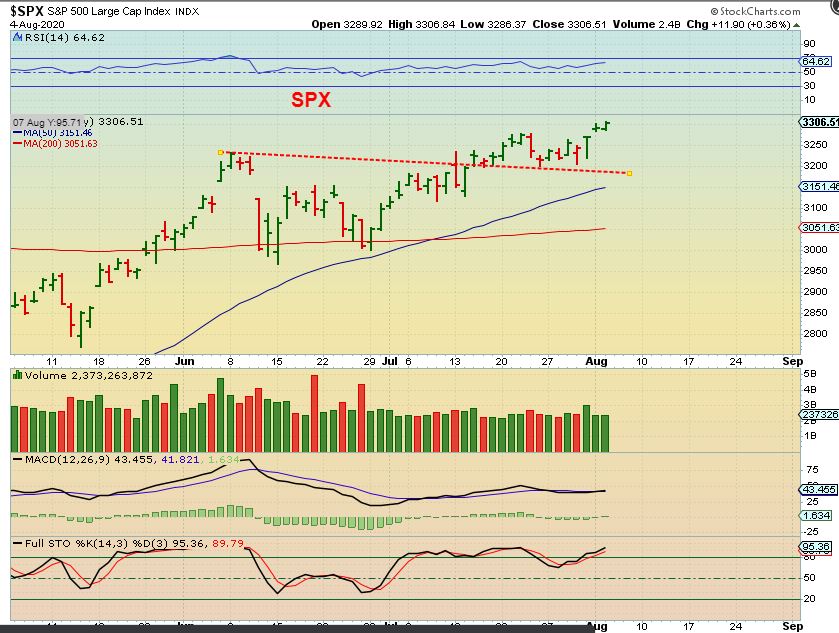
SPX – Continued higher
WTIC – Oil seems to have put in a visible low, and OIL stocks also look bullish…
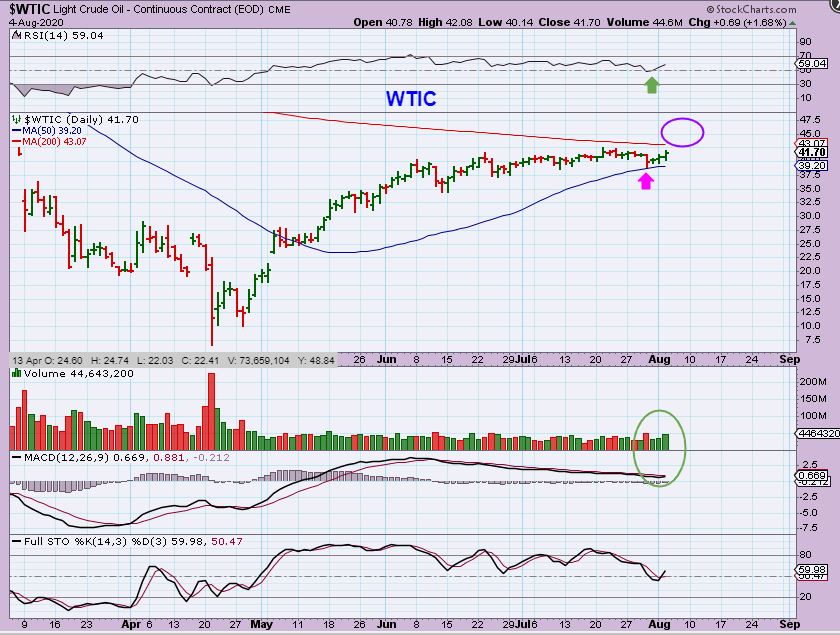
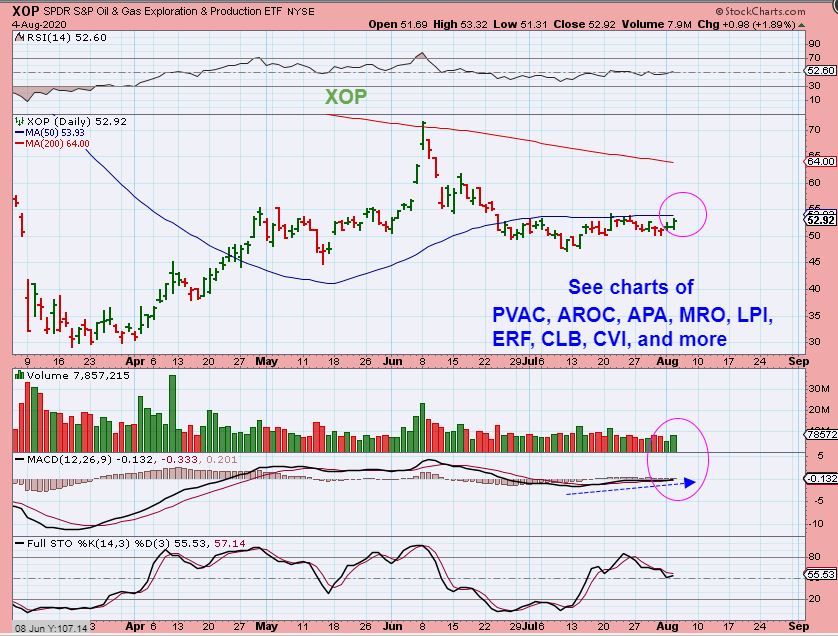
XOP did not break out yet, but it does look set up to do so. The Energy Stocks below are part of my list that looks bullish. I BOUGHT A FEW 2 WEEKS AGO EXPECTING A BREAK OUT & HAVE SINCE SOLD, so are we ready to break out right now? TODAY is oil inventory & this may help. Volume did increase…
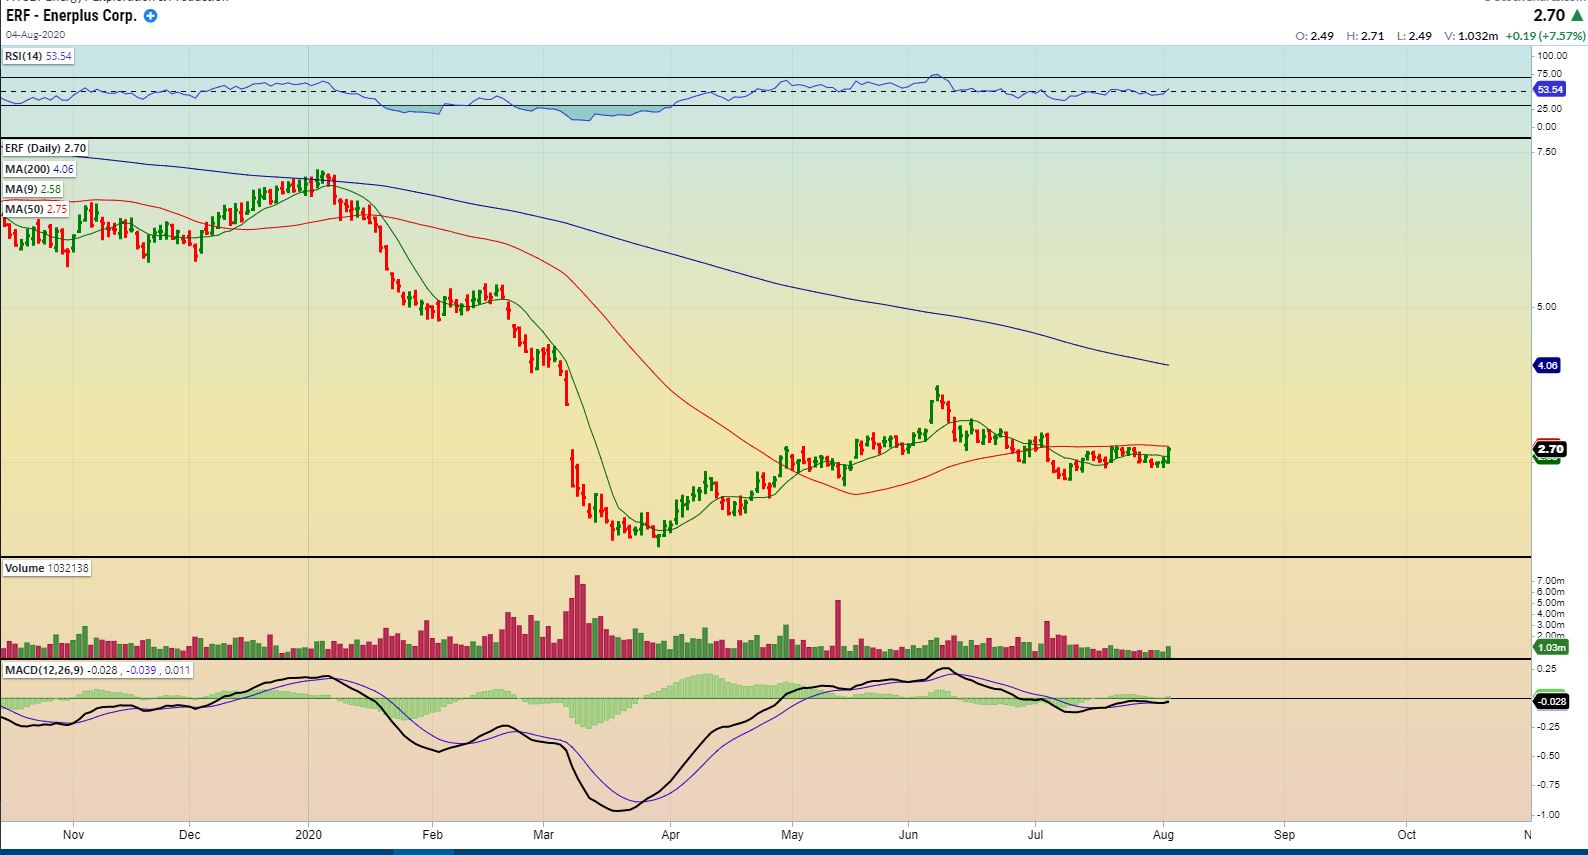
ERF – This is an example of a bullish looking set up, even though we do not have the break out yet.
1. Volume increased
2. MACD wants to cross higher
3. This (And the others like it) can be bought above that 50sma.
,
.
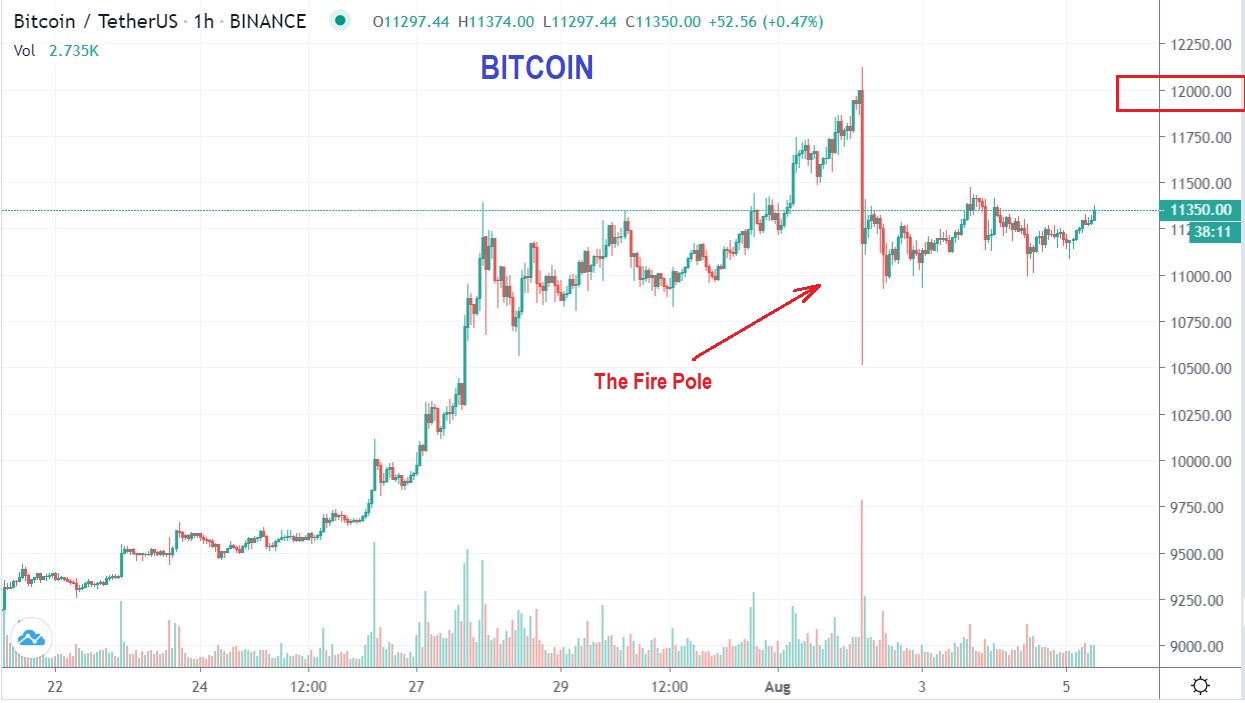
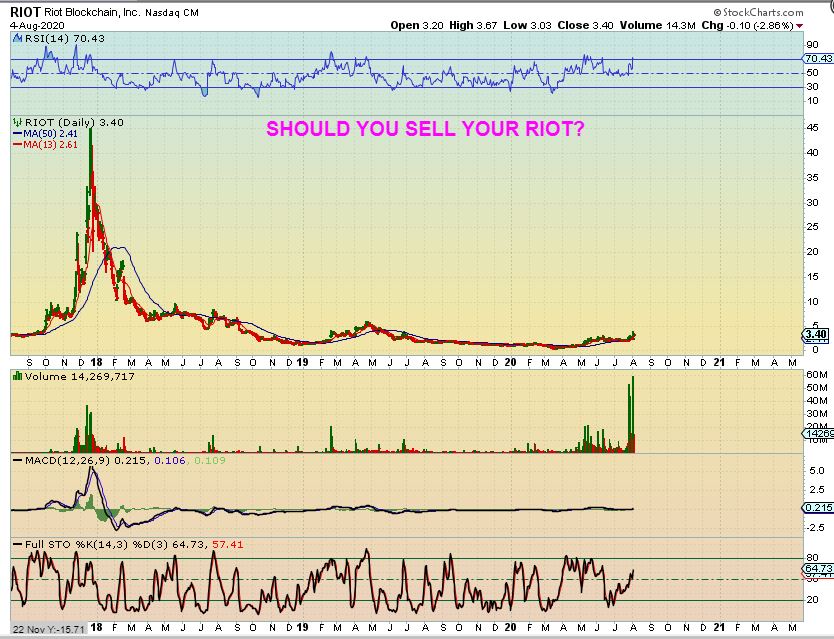
BITCOIN has a ‘Firepole’ pattern. I find that when these form they seem to “CLEAR THE LONGS OUT”. Now this fire pole is likely to have no big sellers in it, and price eventually climbs right back up. This one seems to be basing a bit, but this also should mean that BITCOIN will run back to that $12,000 area (Minimum) and our Blockchain stocks can run again too. RIGHT NOW BITCOIN CHOPPED SIDEWAYS, and so did our Block chain trades.
RIOT – Here I am simply pointing out that these can be rough rides. On the last climb higher, each POP (even on the way up) has a little chop for 2 or 3 days. We MIGHT NOT get that now if Bitcoin just heads back up the firepole. So …
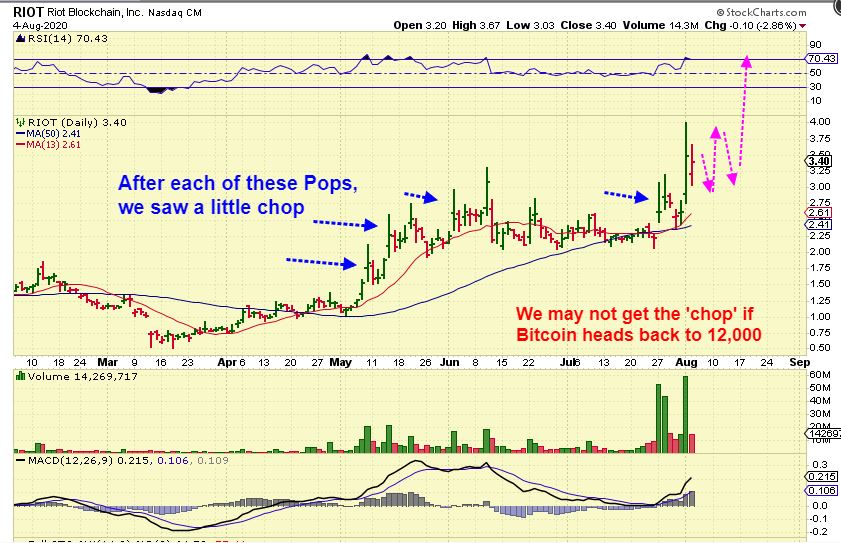
So I have had some say, “I have great gains and I hate this drop- should I just sell?” I have had others say, ” I missed that and I want in, should I Buy?” The answer is, “HOW WELL CAN YOU HANDLE THE CHOP, POP, AND DROP?” And then I would also say…
And then I would also say… ” I’m looking at the big picture and ignoring the chop for now. The upside potential could be excellent. EVEN a run to $10 on this chart is just a break out from this base. BUY, SELL, or HOLD? The choice is yours with the above information in mind.
.
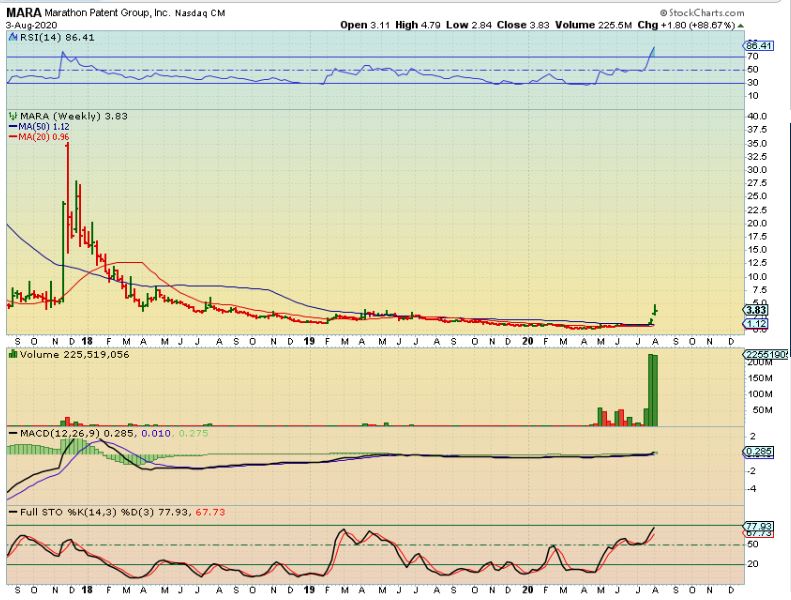
I DISCUSSED BLOCKCHAIN STOCKS IN THE WEEKEND REPORT: I SHOWED THIS CHART OF MARA -This is what ‘up over 200%’ looks like on the weekly chart. “Should you sell?” Could it pull back further? Yes. Does it have more upside? I would say , Yes. Did you see OSTK when it popped from its base? So many people look at OSTK…
.
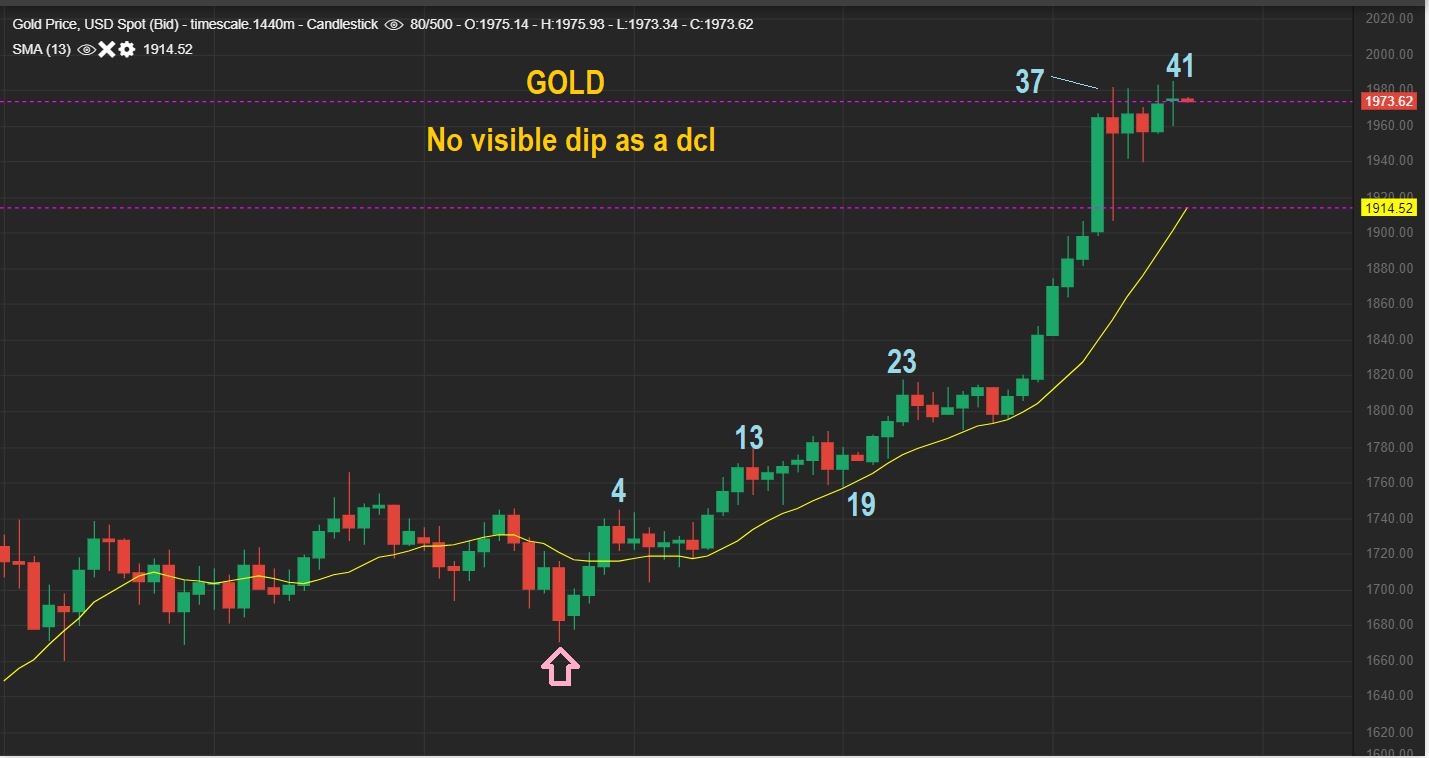
YESTERDAY I SAID / GOLD DAILY – Honestly? I see no visible dip as a dcl, we are on day 41 , and this still looks like a bullish consolidation that would break higher. So…
.
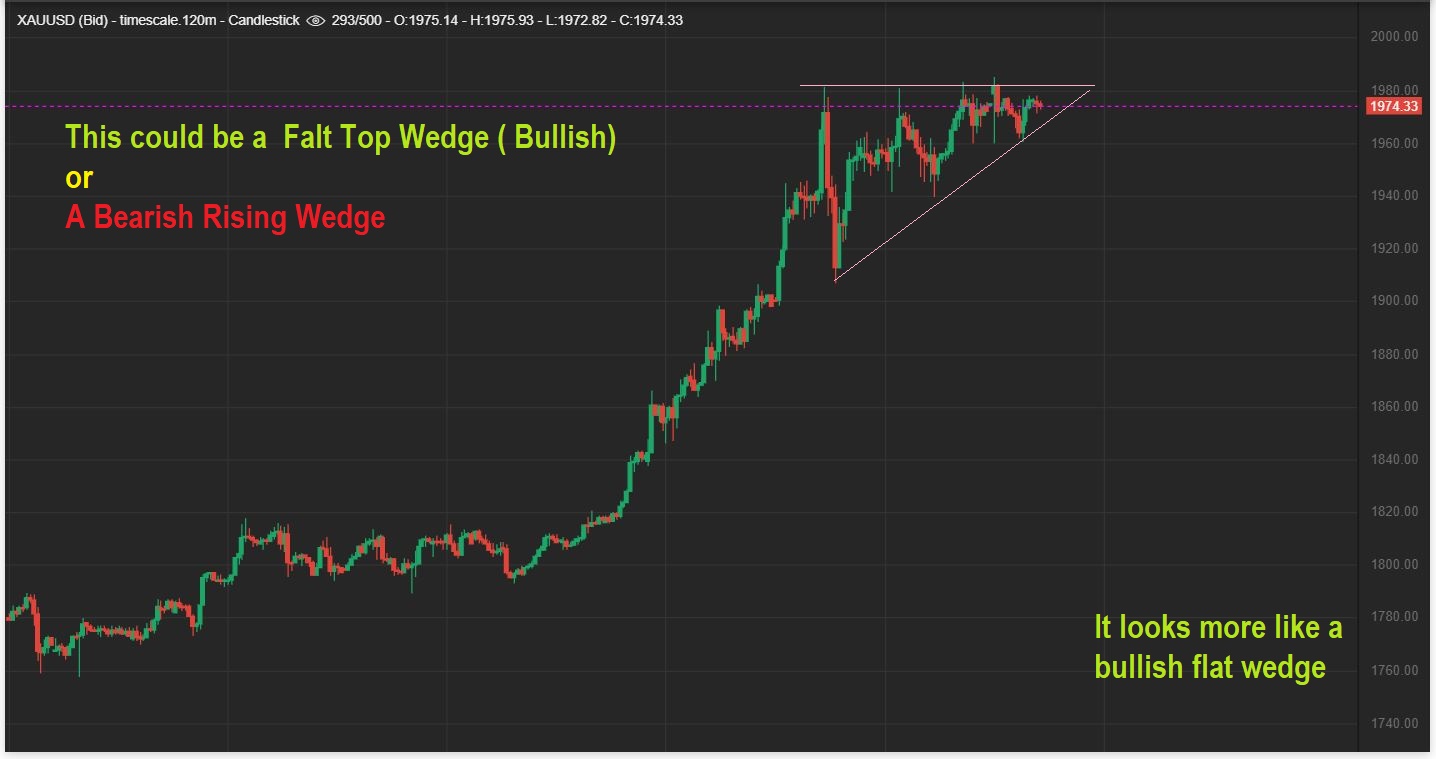
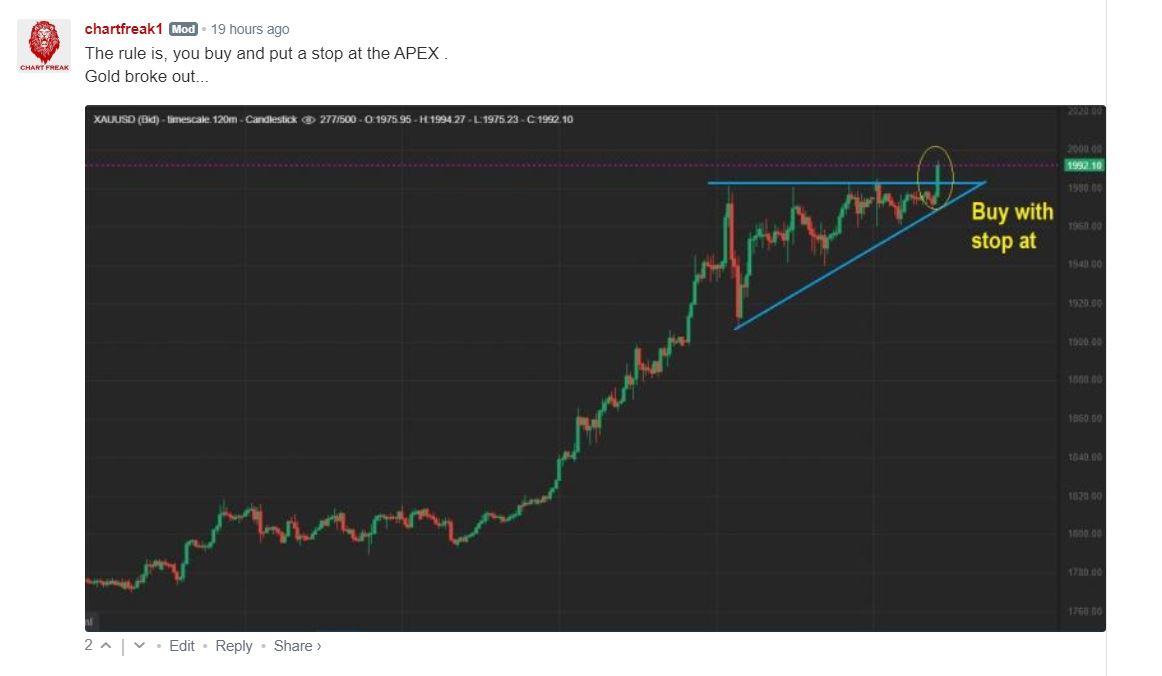
YESTERDAY I ADDED/ GOLD 2 hr chart – This looks very bullish, so we’ll just have to see how things play out. A visible dip into a dcl has been resisted so far with this strength, but silver and GDX are at least showing some form of dip . The word on the chart should be FLAT TOP, my apologies for missing that.
.
I POSTED THIS GOLD CHART AT 11 AM in our live area- We got a buy signal
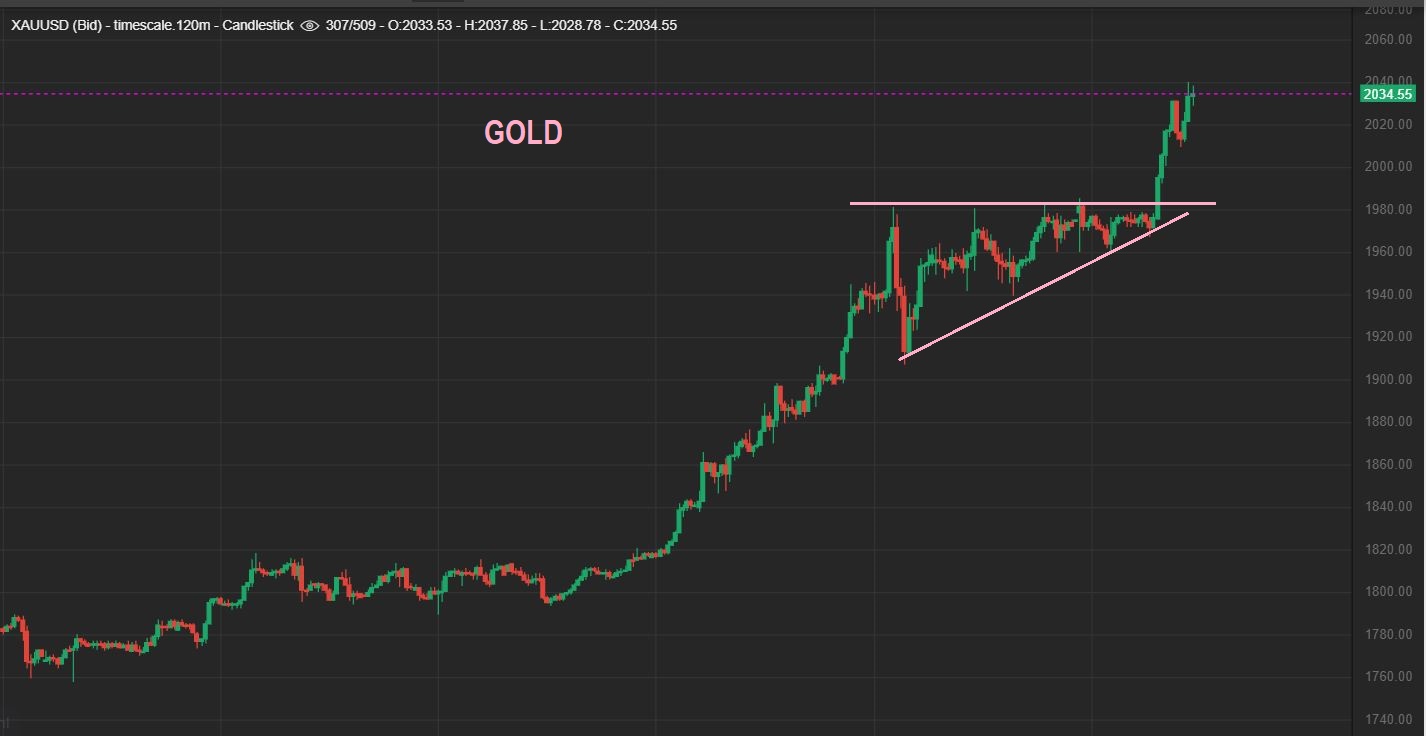
GOLD and that Buy had follow through, this is Gold this morning.
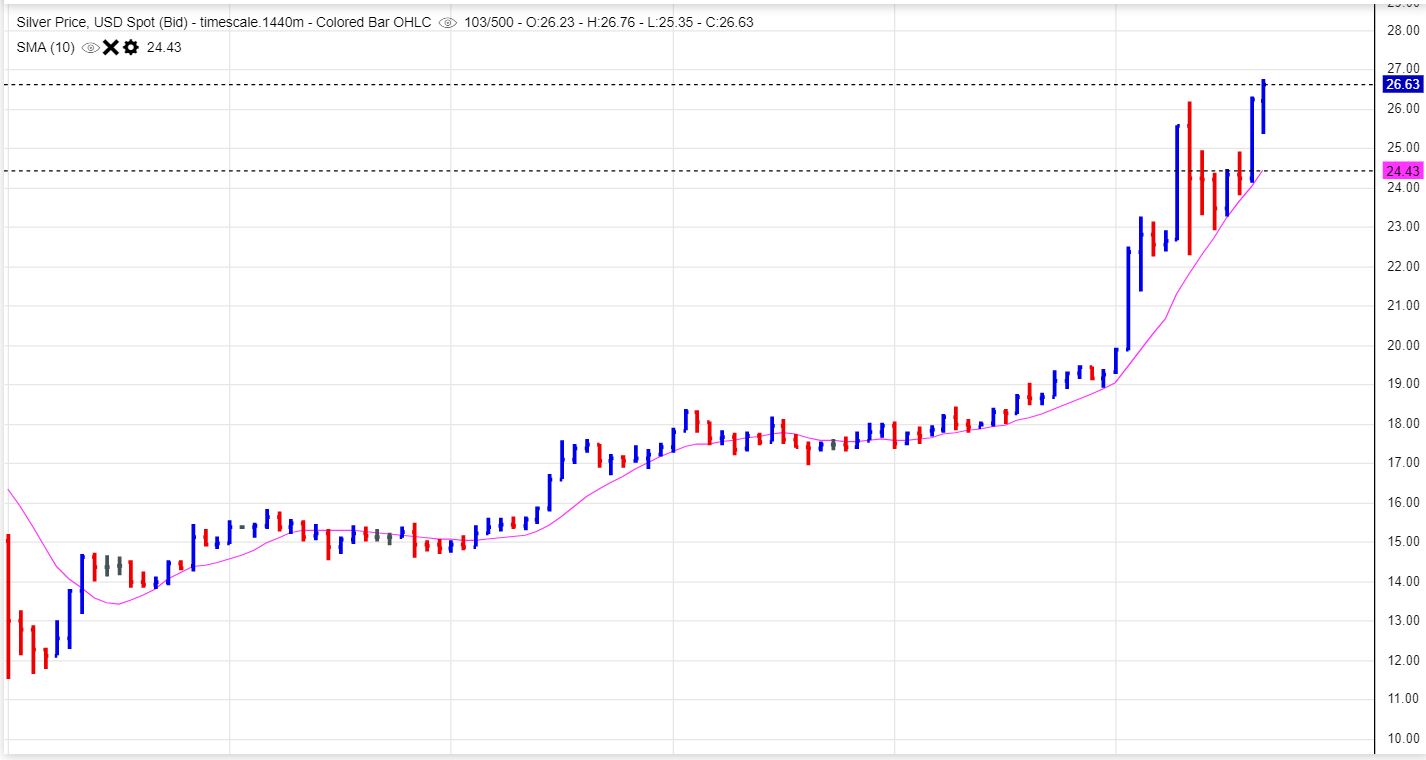
SILVER has consolidated and NEVER broke the 10sma. It is now reaching higher too. Silver stocks looked excellent…
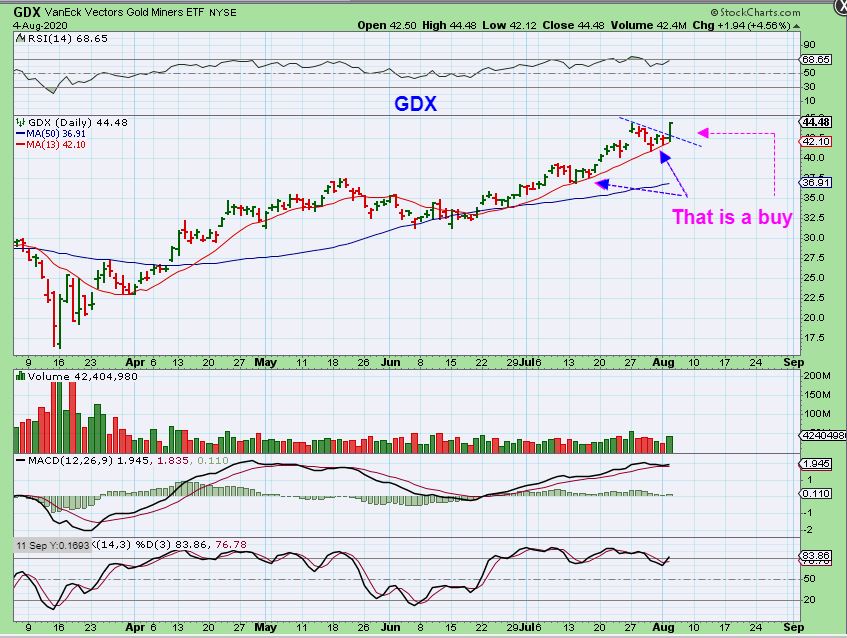
GDX is a buy.
I also posted this CDE chart at 11 a.m. in the live area. It is a buy when price dips to the 10 or 13sma & Reverses. I have mentioned that in a Bull Market (Like with the SPX) I use a 13 sma as a stop and it keeps you in the trade unemotionally. CDE WAS $8.23, How did it close?
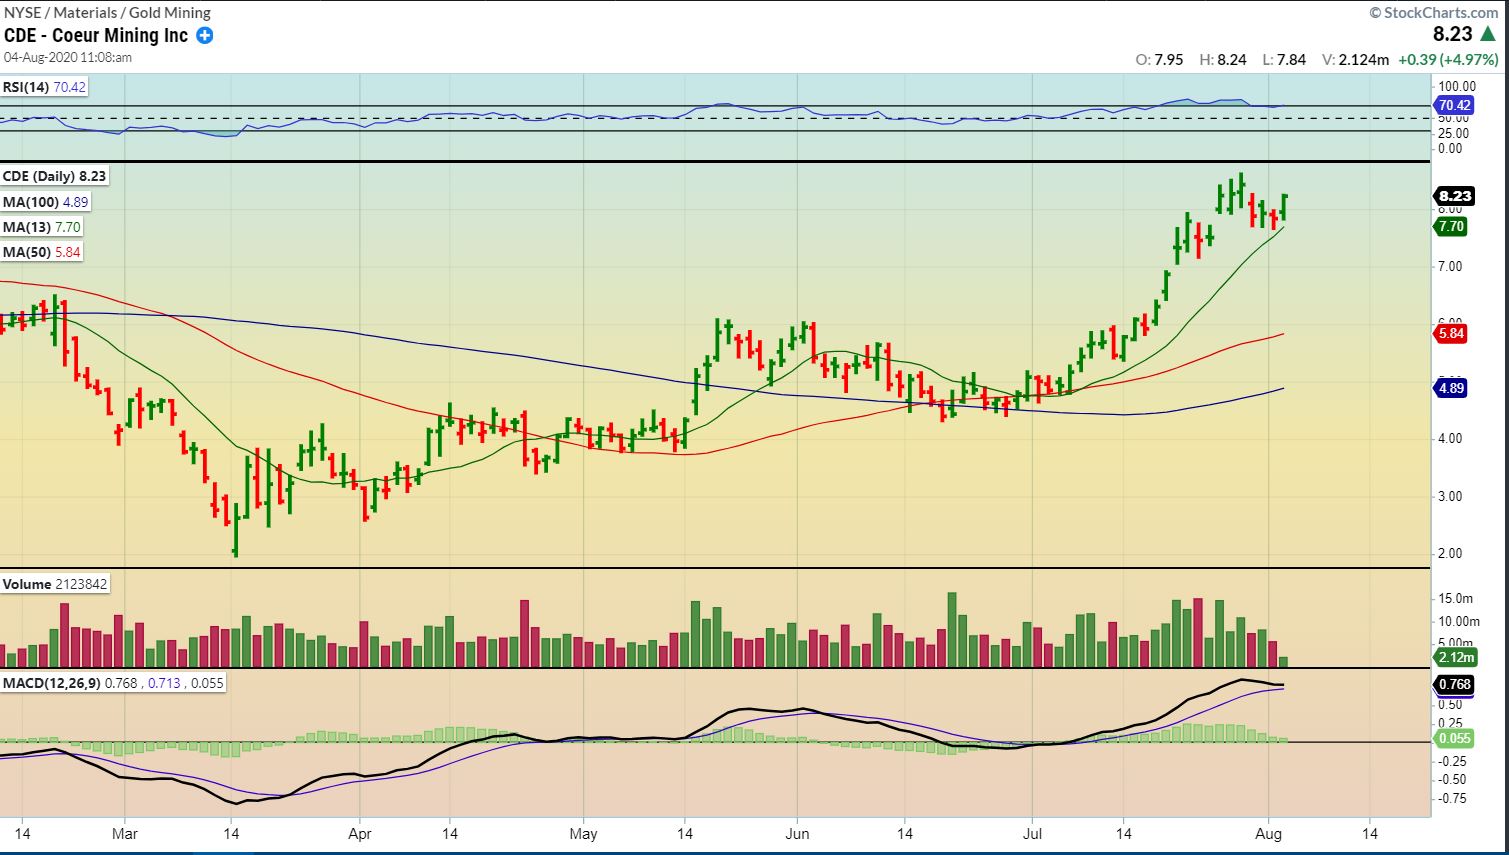
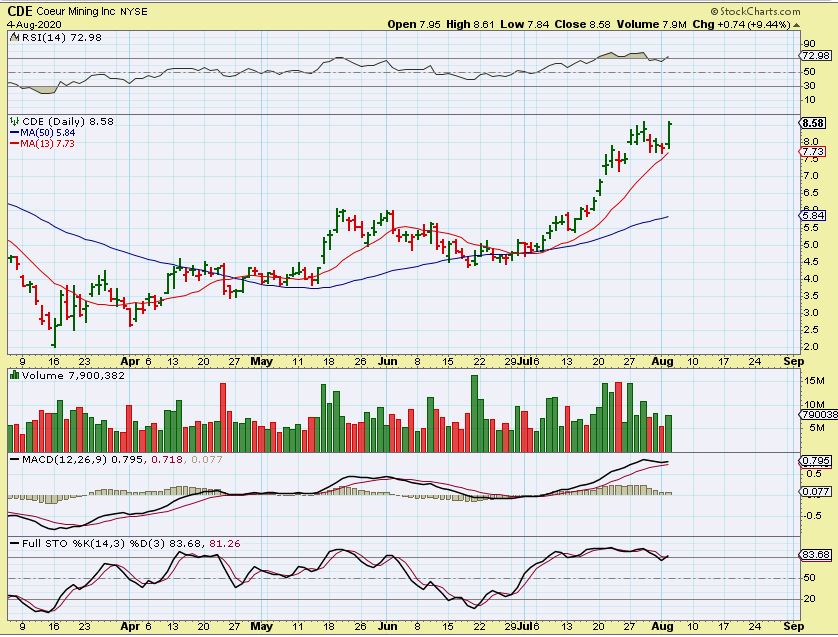
CDE closed at $8.58 . This MIGHT BE a 1/2 way point, since some consolidations are. IF SO, This went ‘roughly’ $4.50 to $8.50 and can run to $11.50, so these are worth buying or adding to current position risk/reward wise. I CANNOT Guarantee that this continues higher, it could pop , drop, and chop- but this is trading and you play the bullish possibilities. And…
.
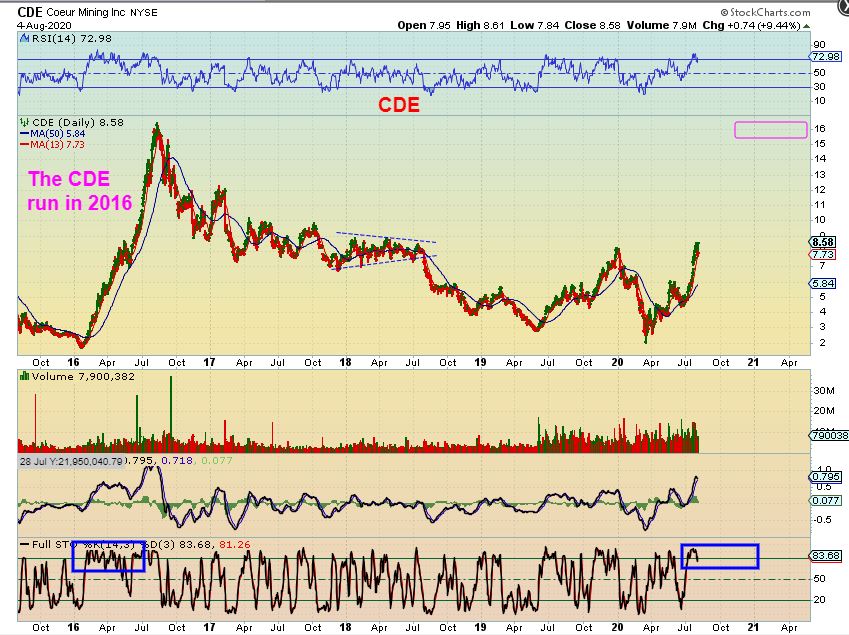
Stepping back & Looking at CDE – The current pull back to the 13 sma is hardly visible.
Notice how the 2016 Run moved relentlessly from under $2 to $16 with only these small dips to the 13sma. It did have a choppy period 1/2 way at $8. This time it was choppy in the early stages. Could it now put in that straight line bullish run higher, only consolidating to the 13 sma, similar to 2016? Silver has broken from that large base, I would say this is possible.
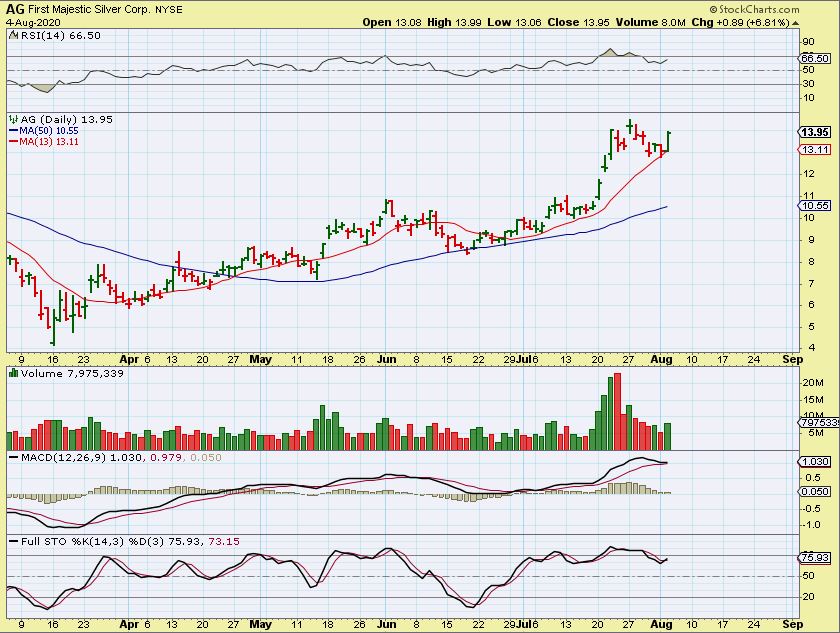
AG looks the same as CDE, it can be bought with a stop at the 13 sma.
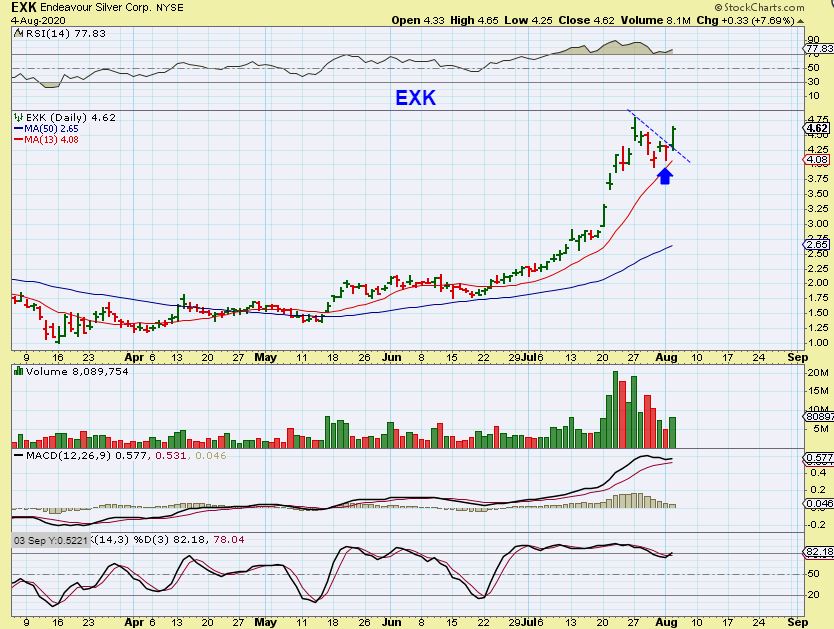
EXK – This is the same set up,, but if volume stays at this level, I think that we will see more chop.
.
So the Bull continues to run after a dip to the 13 sma. The SPX has pushed higher, OIL dropped to finally tag that 50sma & Pushed higher ( Energy stocks may now begin to run again) , Bitcoin is consolidating after a slam down fire pole, and it should try to recover, helping the Blockchain Bull to move again, and Miners have chopped over to the 13 sma & put in a reversal Tuesday. They can be bought with a stop too.
Some are still holding core positions and can enjoy the ride, and this is a good place to add to position or start one in a miner that has consolidated and reversed. Some Miners look weak to me and need to show a sign of strength or you may be parking your money in a stock that is just going to chop around. Below I want to discuss ‘Choppiness ‘ in 2016, that did lead to very short term pop & Drop, or false break outs. Just a review.
.
Enjoy your Wednesday trading!
.
~ALEX
.
LOOKING FOR THE DCL: Did we drop & curl the 10sma down, as a signal that a dcl came about? No. Did it break the trend line higher, to signal a dcl? No. Was that a dcl at day 38? It doesn’t fit the criteria, but I have seen the bull run in the NASDAQ hardly show a dip at times too. So with no visible DCL, I do want to see if I can point something out here while comparing it to 2016 GDXJ.
When I look at this chart I simply see that This is a bull run bouncing off of the 13 sma and it may just continue higher, so I can’t ignore that just in case we keep running higher. However…
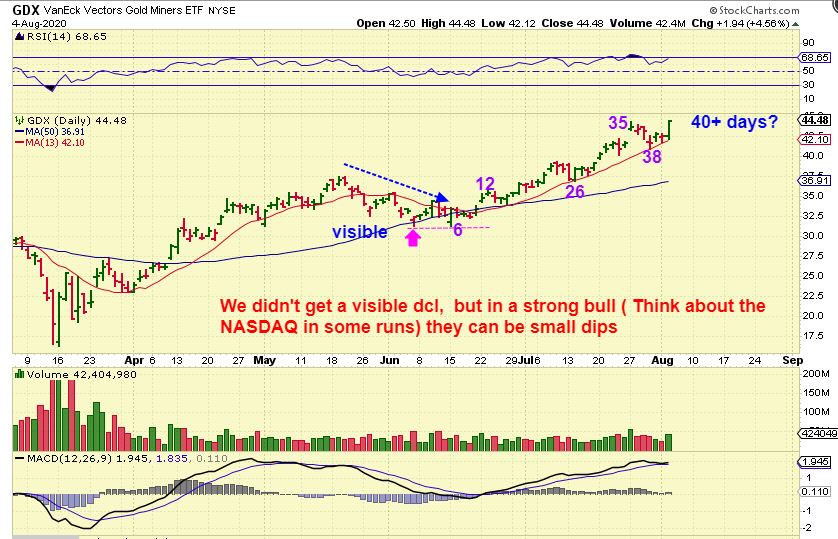
However, in the 2016 run, we had some break outs similar to this, that then Popped and became choppy with the GDXJ. Let’s go to the 2016 run in GDXJ.
I have showed this 2016 charts before, so the writing is from back then.
For current purposes: Look at the dip at the 2nd Magenta arrow. It was more of a sideways consolidation, and looks like our May/June move on the recent run. That was a Sideways chop that barely turns the 10sma lower. AFTER that barely visible dcl, the next daily cycle was very long and broke out to double top in May, before selling off to the 50sma ( Possible ICL). So could we get a final pop break out that turns into a double top? It is possible, but that next dip was still a buying opportunity. 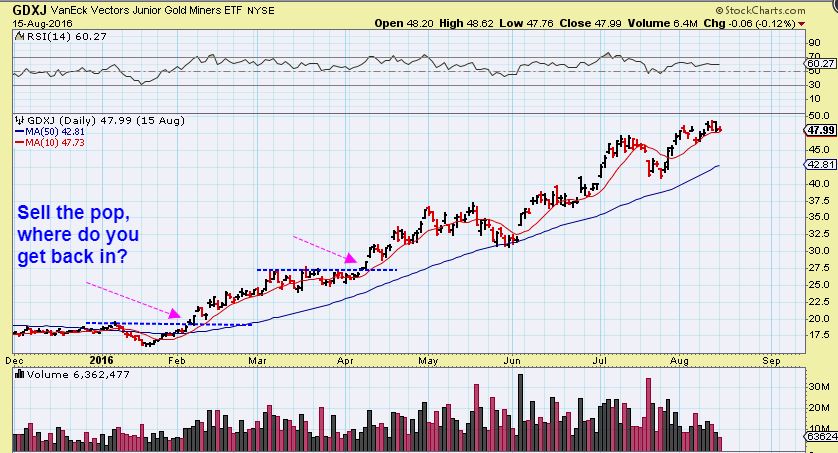
.
I will keep an eye on this and the daily reports will discuss possibility, but for now it is a bull run that reversed at the 13 sma.
.
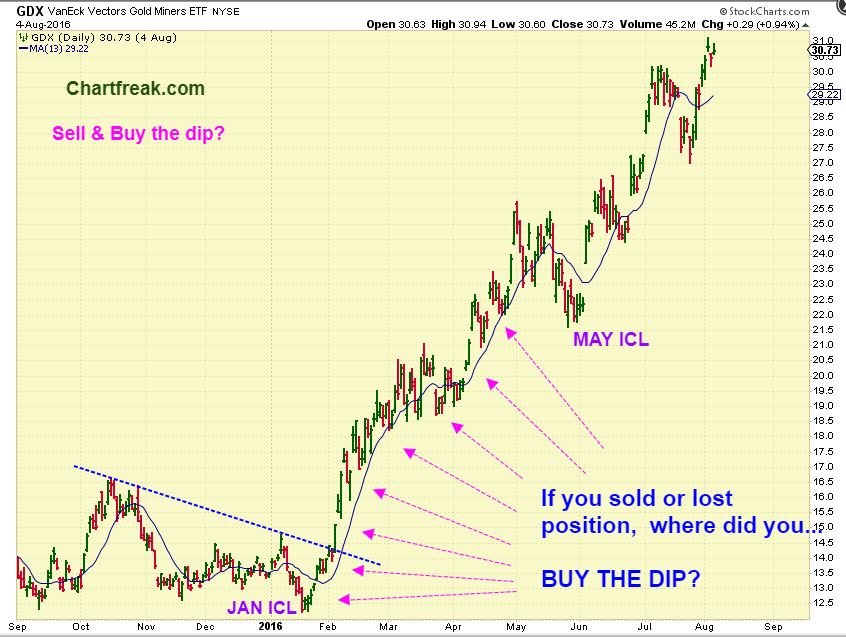
GDX 2016: That choppy area in March & April also had steeper false break outs with Pops and drops, but the dip was not big and it didn’t exactly ‘look’ like a dcl. It was not always an easy ride, but again- dips were minimal . The MAY ICL dip came out of nowhere with a double top, but was short lived.
I don’t know if I was exactly clear about what I am trying to point out here. I am in a hurry here, because we briefly lost power & I got behind in gathering charts and putting this report together. Basically I will be looking for signs during the run higher for strength or possible short term weaknesses on the break out & put that in the daily reports. For now, the miners became a buy reversal at the 13 sma.

