JULY 29th – FED REACTION
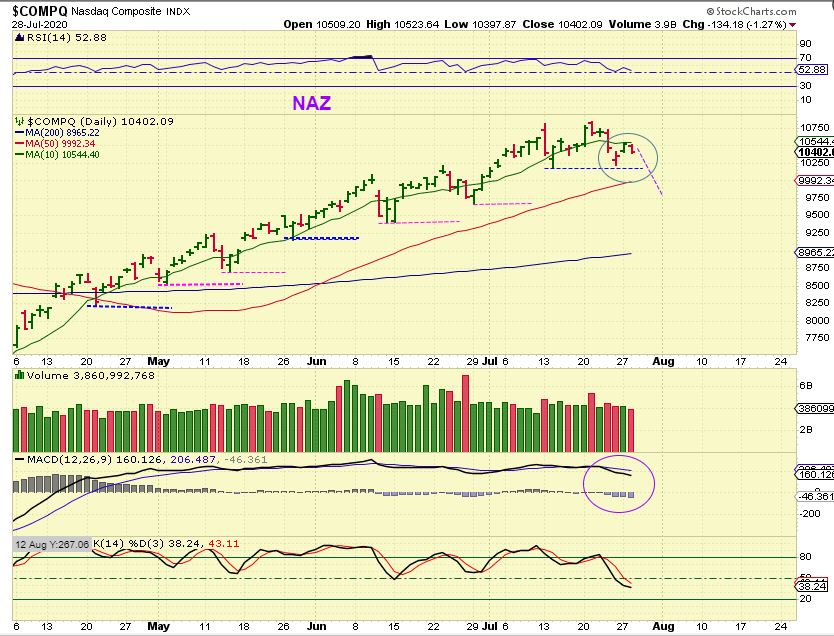
NASDAQ – I discussed that I am watching the series of higher lows in NASDAQ. If that changes and we see a prior low broken, we may be starting to roll over ( a sign of weakness at least). The NASDAQ could not get back above the 10sma. CAN THE FOMC MTG HELP? Or will we start to see an A-B-C Down? Or…
.
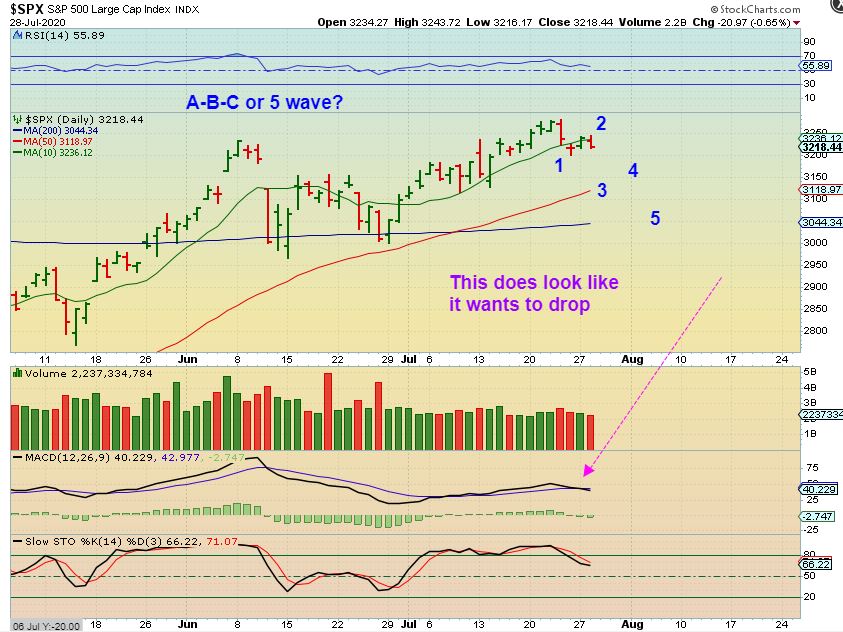
SPX – A deeper drop? The SPX also could not regain the 10sma. I felt that the first dip in June was too early for a dcl (21 days), so I counted the 2nd one as one. Tat means we should be on day 20 ( with plenty to drop if this starts to roll over). I’m just watching this for now, and we;ll see what FOMC Wednesday can do to it.
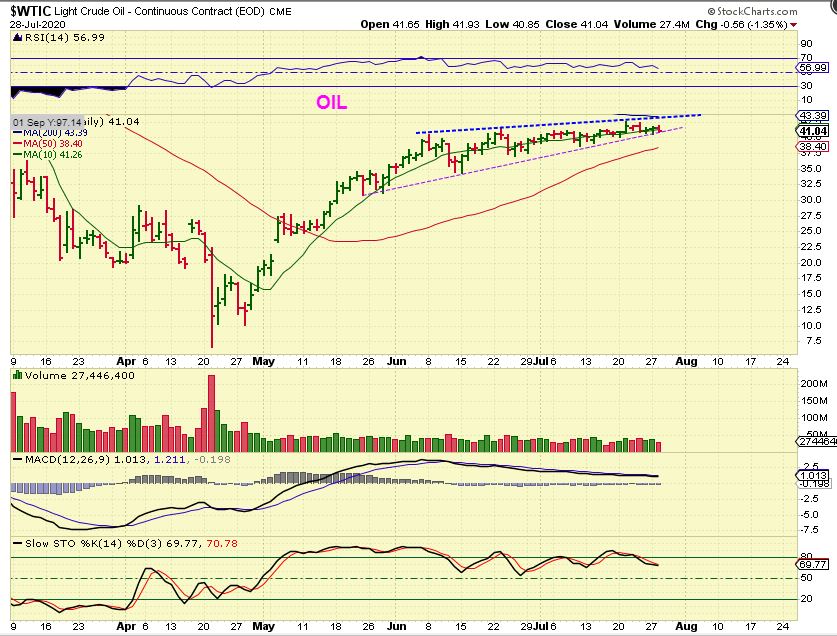
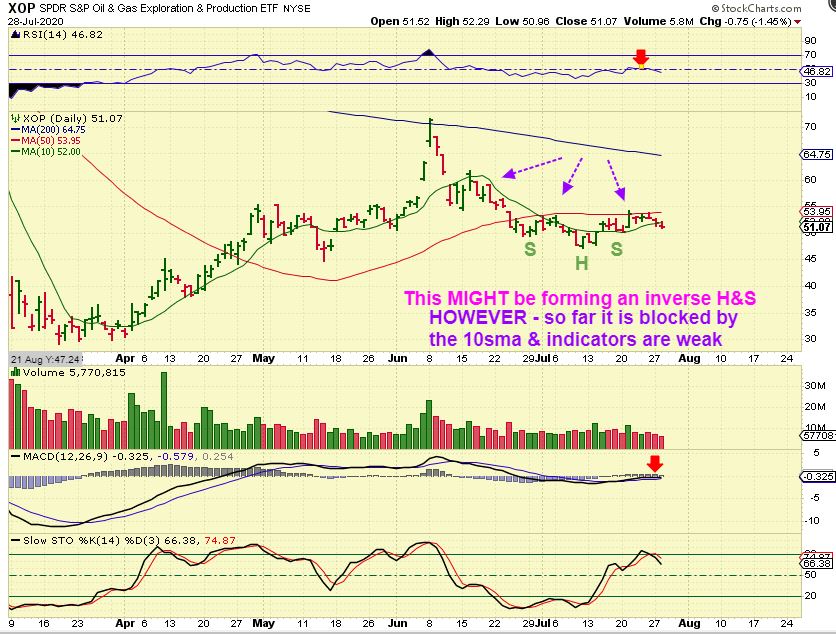
WTIC – This has dragged on for a long time. Wednesdays are the Oil Inventory Report, and that might move Oil out of this tight consolidation. Meanwhile the XOP has not been able to get back above the 10sma either…
XOP – This MIGHT be an inverse H&S , but it really needs to break higher sooner than later. The 50 sma has blocked price and now it lost the 10sma again. I closed up 2 trades and will simply watch and see if it breaks higher. CPE & SLCA are closed with no big loss or gain, just dead money for a week or so. I will re-enter if they act correctly.
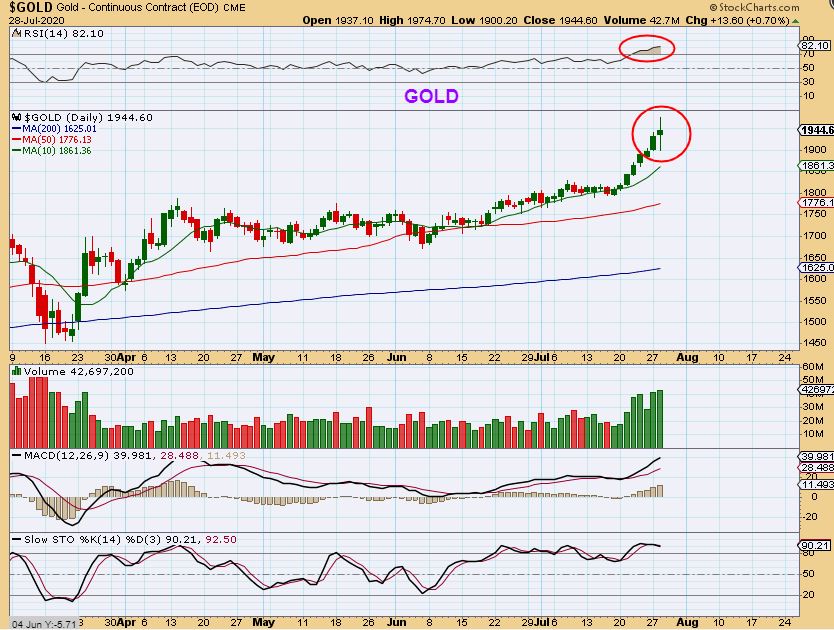
GOLD – This is a Giant Doji. The RSI is very high, the Doji is often indecision and can signal a change of direction after a long run. We’ll see what the FED does to this. Honestly, it could go either way , but it is extended and as we discussed, the USD is due for a low.
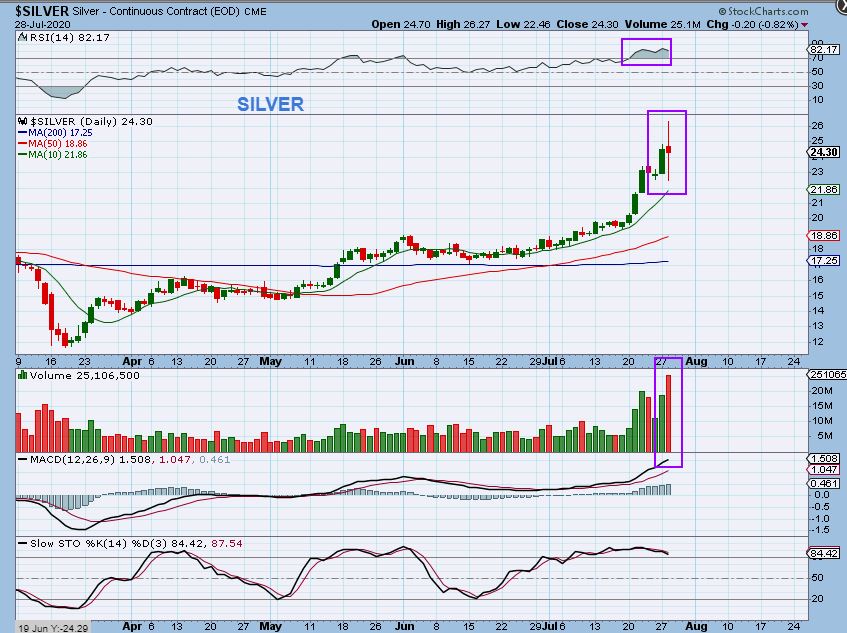
SILVER – And we’ll see what the FED does to this too, or a USD bounce.
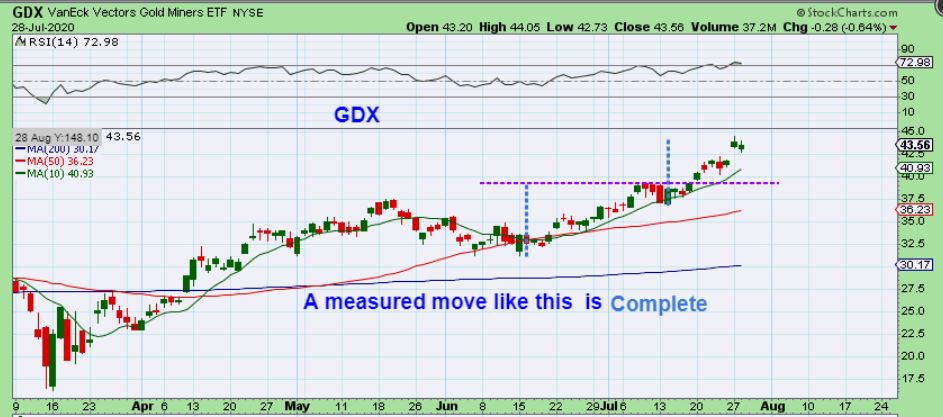
GDX #1 – This is not too extended. You can do a longer term measured move & get higher price, but it might take a pull back and another daily cycle to start in order to reach that area ( and it may not even happen too).
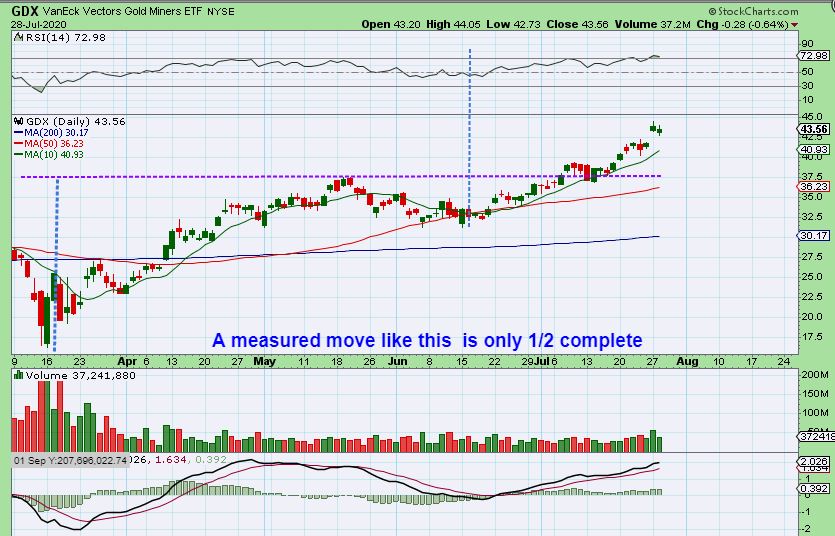
GDX #2 – A short term measured move may have completed. The FED Wednesday may push this one way or the other.
.
So many areas seem to be stuck in the middle right now, and the FOMC MTG may be the catalyst to push things one way or the other. As a review,
– The General Markets are in the middle of a 3rd daily cycle, and seem to be struggling at the 10sma. It could be peaking.
– Oil has been in a very long tight sideways consolidation under the 200sma.
– Gold, Silver, and the Miners have had a long strong run higher, they put in a massive Doji at recent highs, Silver hit the $26 Target where resistance is, and The USD is due for a low. It would seem that the FOMC MTG could trigger a pull back , but so far surprises have been to the upside so a trailing stop is keeping the trade alive.
.
The FOMC Mtg concludes at 2 p.m., Stay Frosty my friends, and enjoy your Wednesday trading !
.
~ALEX
.
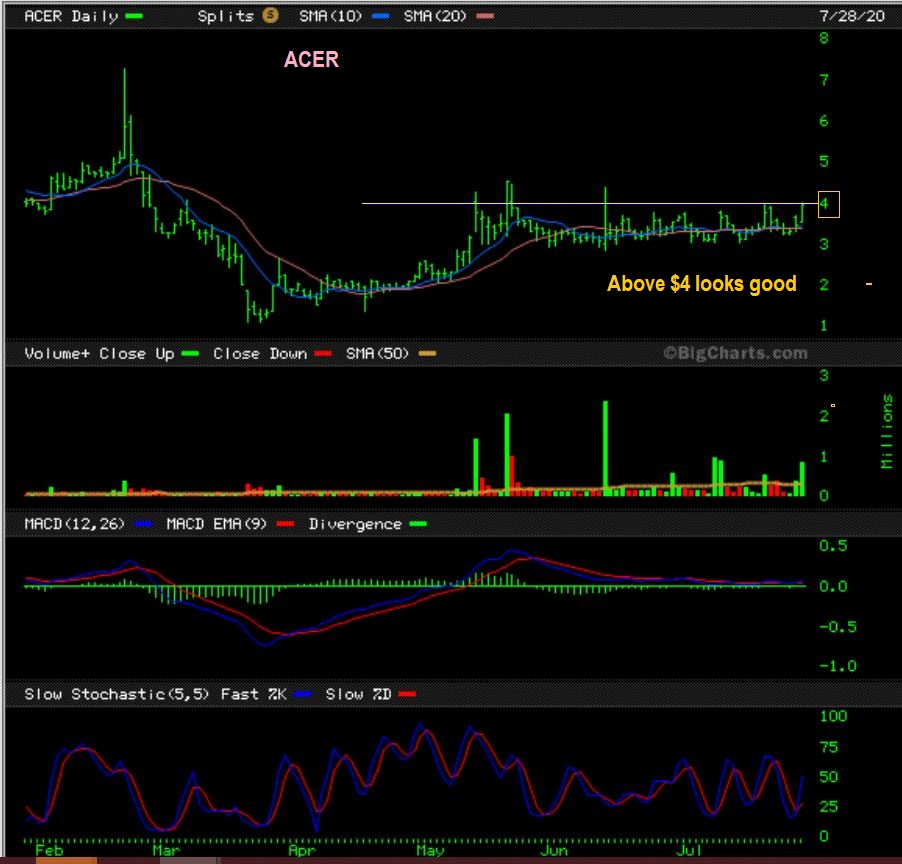
ACER – This is not a company that I have mentioned in the reports, since we have been watching CHFS, NOVN, BNGO, etc , but I bought this one twice and it never broke out. Yesterday it ran to that $4 area again do I captured this chart. If it breaks and closes above $4 it could run back to Feb highs.
.
SAME ACER CHART: I have even thought of trying to trade this in near $3, out near $3.75- $4, but have not done so.
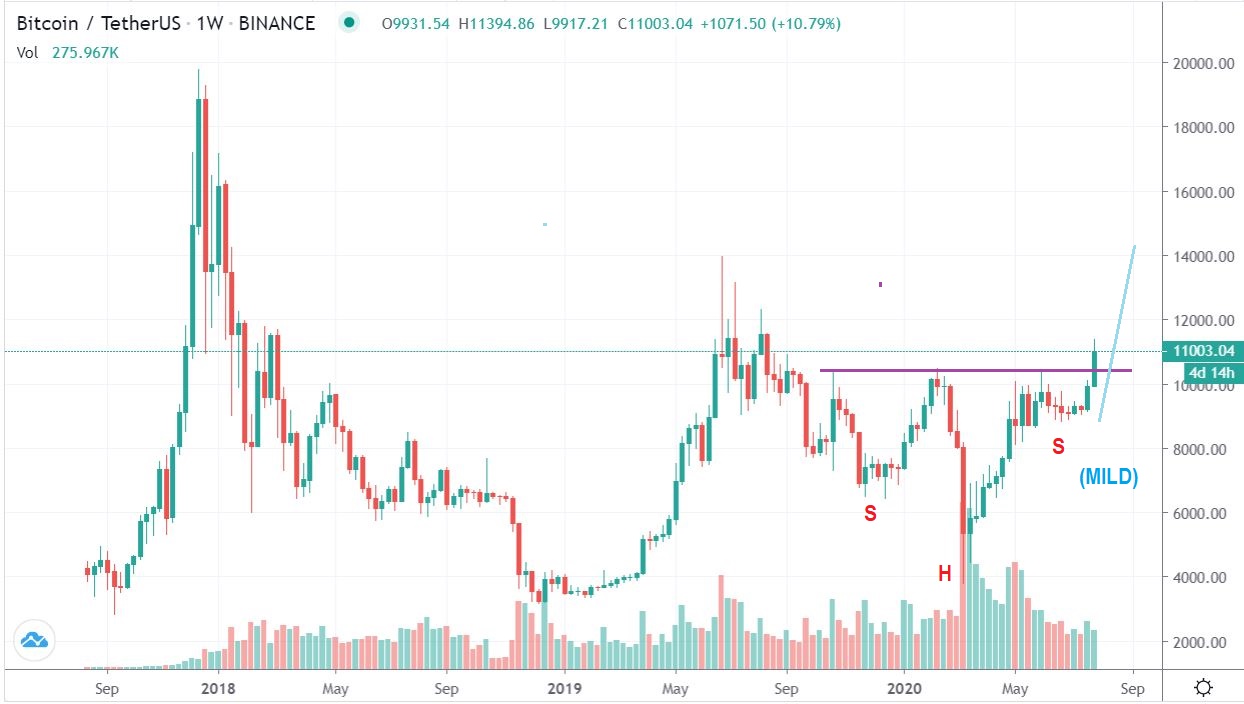
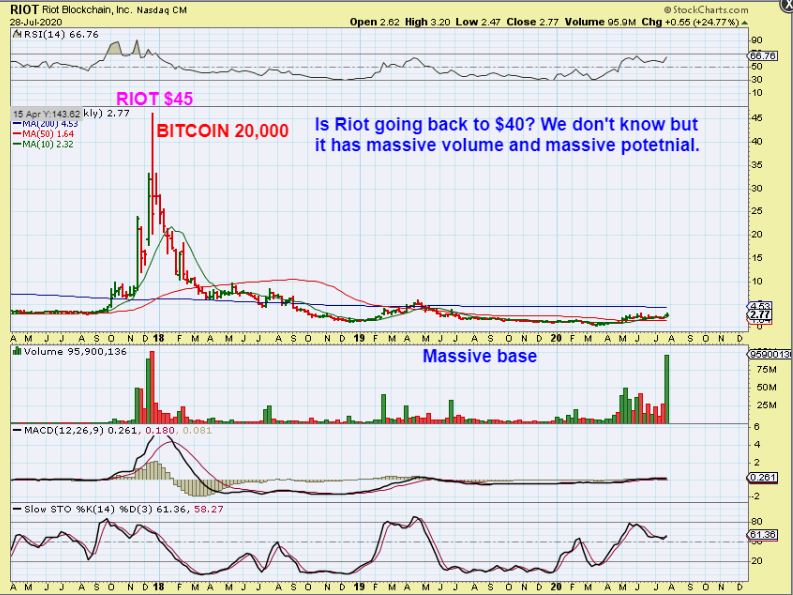
BITCOIN & THE BLOCKCHAIN STOCKS: I do believe that BITCOIN can easily run back to $20,000 area (And more), this is a very bullish move and a very bullish set up (And other Cryptos look great too), so I am looking at some of the Blockchain companies with longer term charts and short term. LOOK AT BITCOIN AT THE END OF 2017…
.
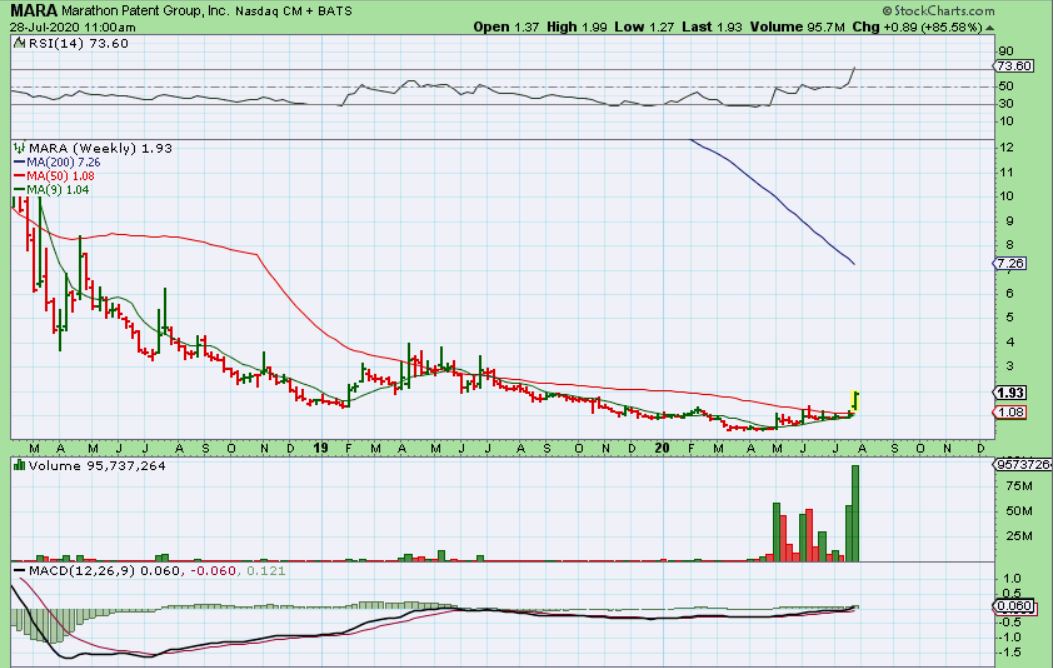
MARA WEEKLY BIG PIC – MARA was much higher in 2017-2018 ( $30plus). We just saw MARA drop below $1 on a Public offering last week. Now it shot up to $2 ( 100% Move this week), but look at the upside potential! This might become a nice long term hold.
.
RIOT – This is actually a beautiful long base after a parabolic run to the $45 area when Bitcoin hit $20,000. If RIOT is $2.75 right now, it easily has the potential to run up 100%, then 200%, then 500%, etc over time out of this base.
.
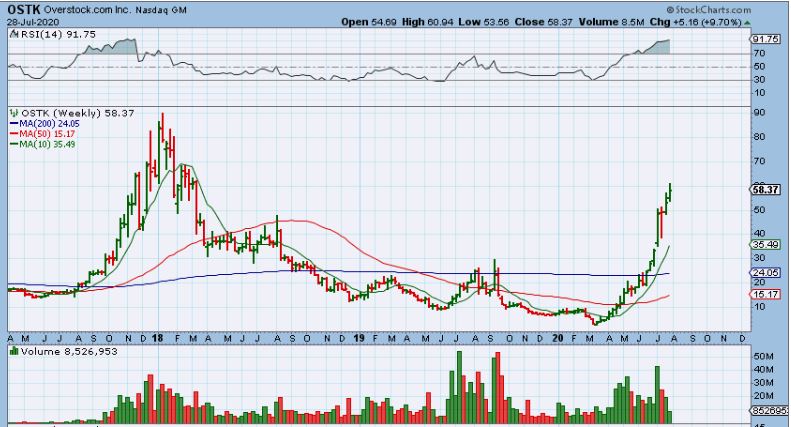
OSTK – This is what I’m talking about when I mention a possible recovery in this area. OSTK just ran from $4 to $60 THIS YEAR! FTFT has moved from the 50 cent area to $2.50, so this is an area that offers great potential. THESE ARE NOT ALWAYS EASY TO RIDE THOUGH. THEY SWING WIDE, but if you can buy and hold and ignore it- you may do very well.
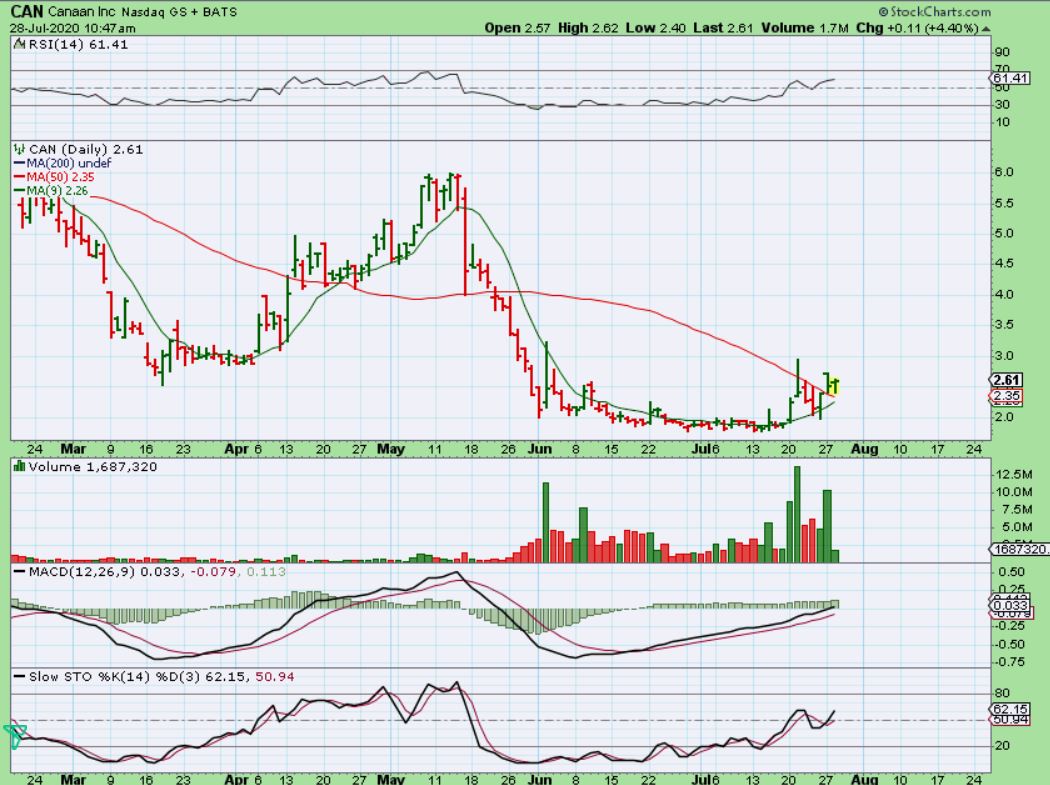
CAN – This was mentioned in our live area as a blockchain possibility, and I like the volume around these lows as it tries to push higher. It looks to be forming a round bottom base.
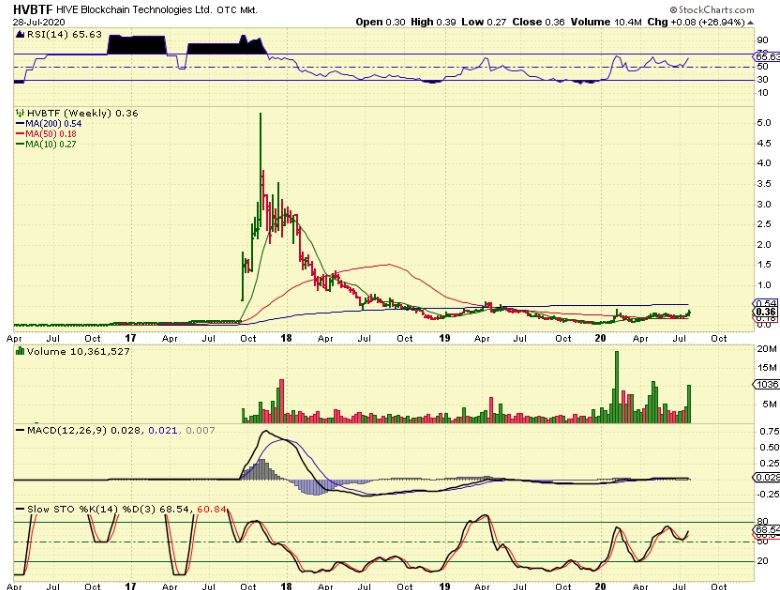
HVBTF – I have done well with this company in the past, even though it is an OTC stock. The potential shown here is also big.
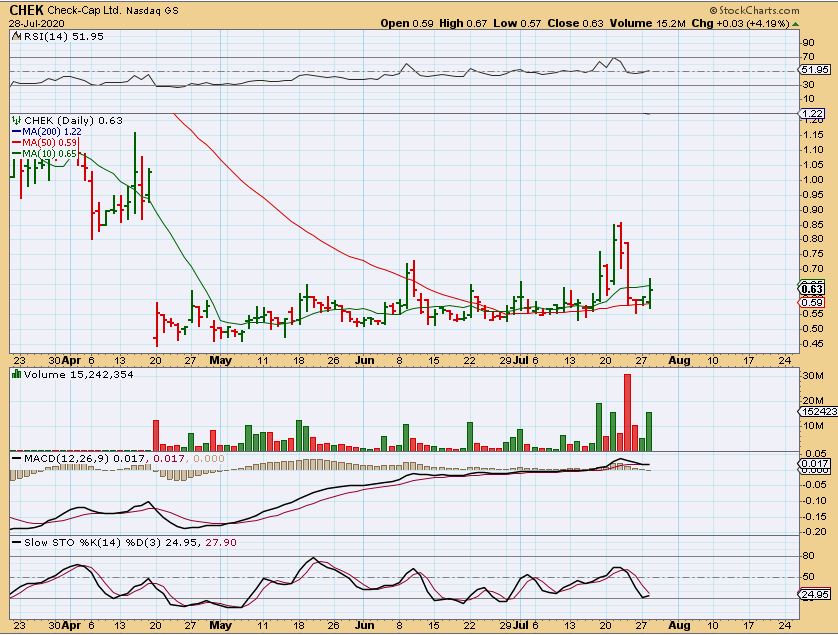
CHEK – We traded this, buying the base in June. It then POPPED and filled the gap to the left, but then it dropped ( on an offering I think). Suddenly yesterday it seems that the offering has been digested and it might be ready to move higher again. I would keep it on the watch list, it actually looked ready to go with the strong reversal yesterday. If you held on to this one because it didn’t break below your buy point from June- you may still do well. I do not own this anymore.
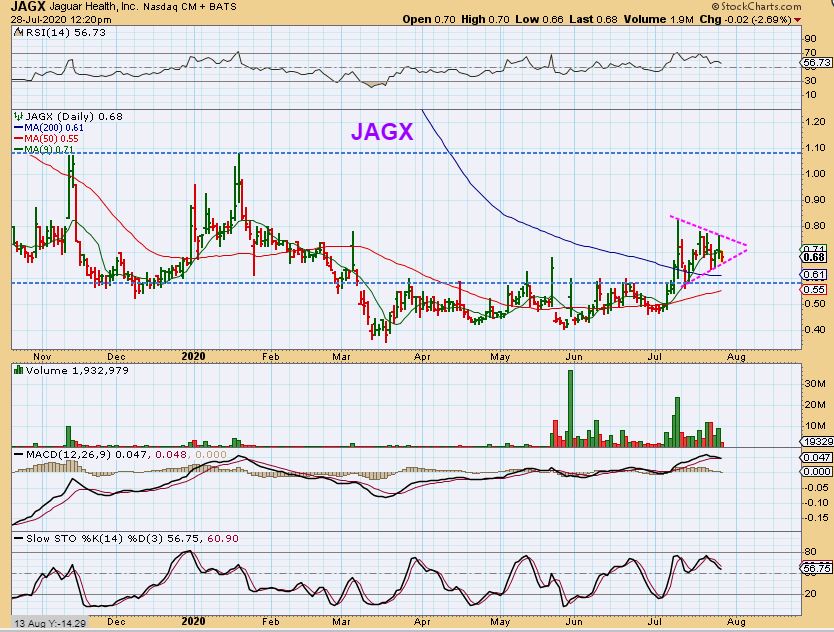
JAGX – I like the set up, but it is a bit jumpy at times. This broke from a base & moved above the 50sma & then the 200sma on a quick 70% gain, and it has now started to put in a possible flag or triangle. I would expect this to break higher. One concern would be if it dropped to tag that 200sma again first. You might (TRADERS) want this on your watch list too. It is in the 65 cents area and could run to $1.00.
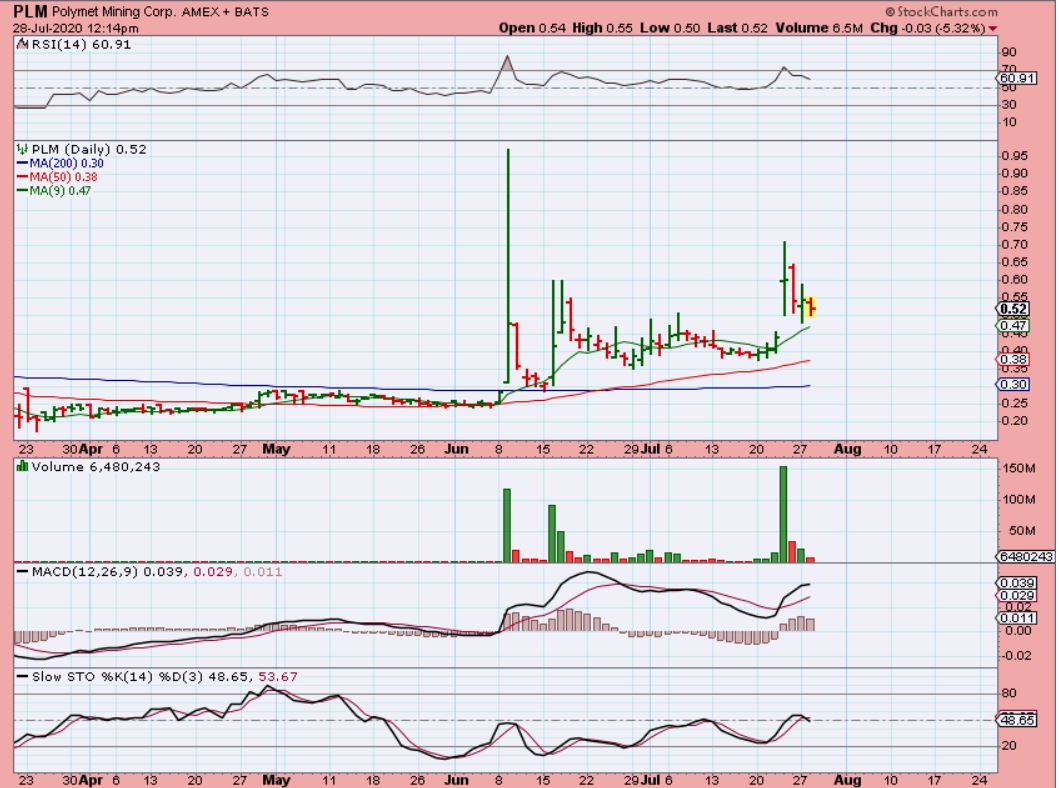
PLM – Also good for the watchlist, PLM Popped last week and has slowly drifted lower. It almost filled the gap and yesterdays volume was quite light. Look for a reversal .
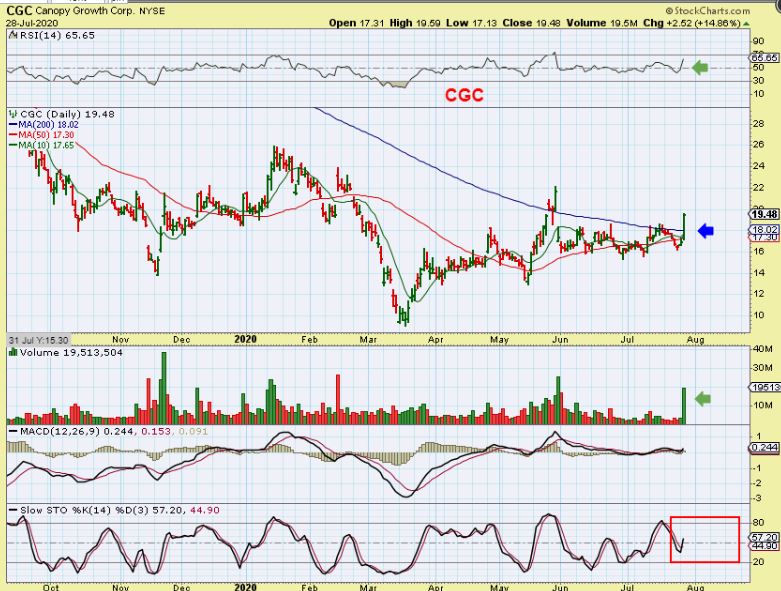
MJ STOCKS BEGAN TO POP : CGC, TLRY, ACB, APHA, VFF, TGODF, etc . Check your watch lists, check your charts. I will show you a couple here too…
.
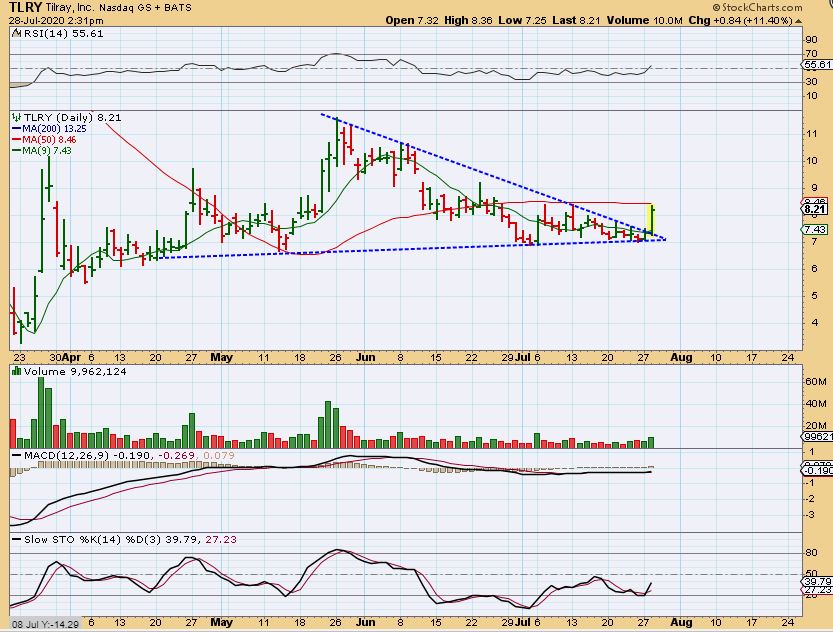
TLRY – This was midday and TLRY looks ready to break out above the 50sma. If this runs to the May highs from here again, thats a nice trade. I bought this one.
CGC has strong volume and did push above its 200sma. It was pinched between the 50 & 200 and this type of set up looks good.
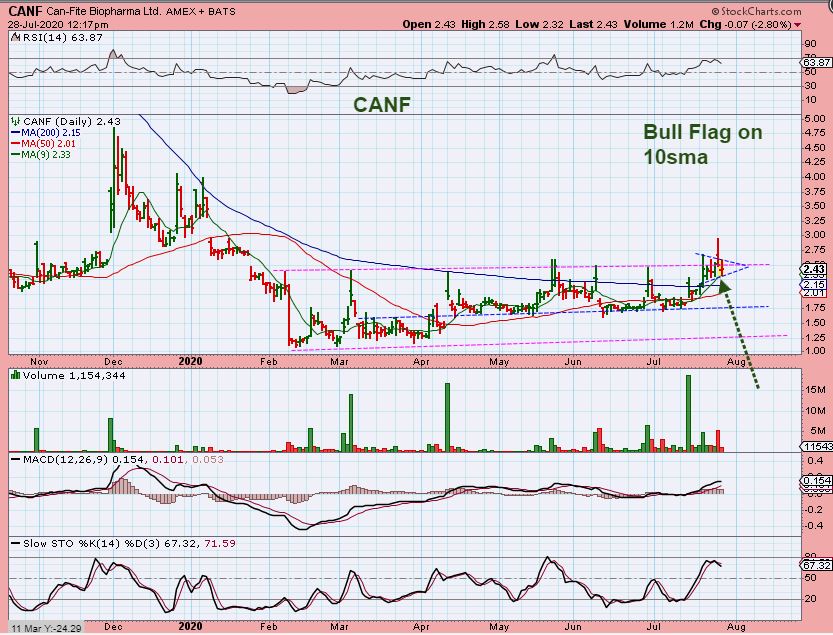
CANF -I always knew CANF as an MJ Stock, but I saw the news clip below and it is applying to try one of its drug for phase II study in the treatment of Covid also. So the chart does look progressive, the news clip is below the chart.