July 18th Weekend Review – Still Climbing Higher
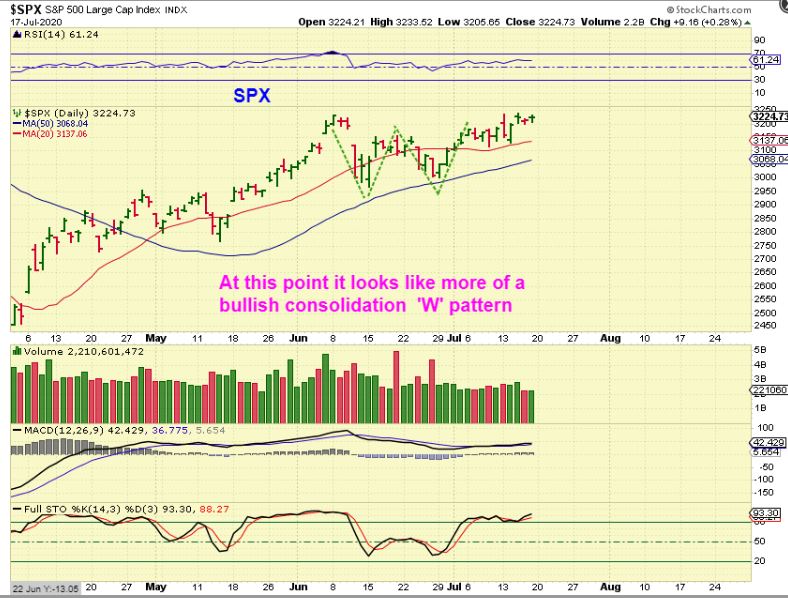
THE SPX and the General Markets continue to set up Bullishly. This is a ‘W’ Pattern and usually they resolve higher.
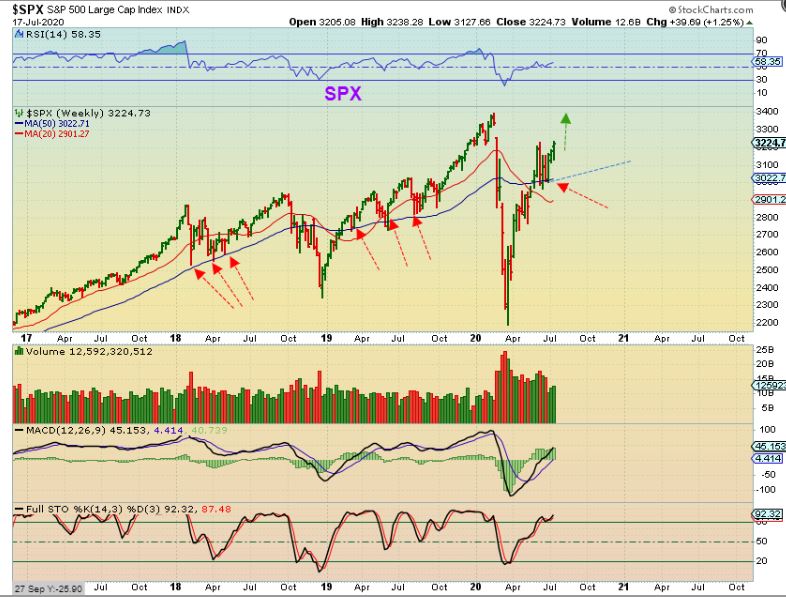
THE WEEKLY SPX dropped to support and reversed higher, as shown in prior reports.
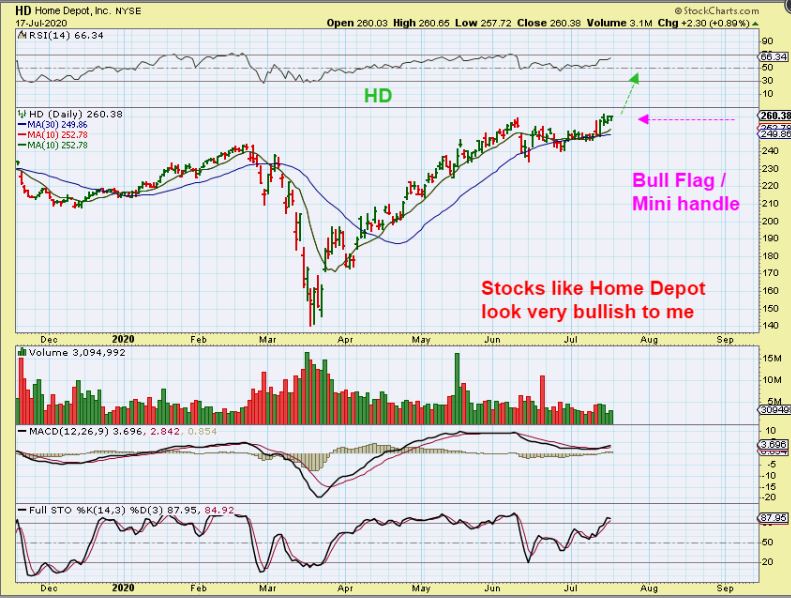
HD – Home Depots and Lowes, Walmart , Target etc are bullish looking set ups if you ask me. I would say that Home Depot is an immediate buy.
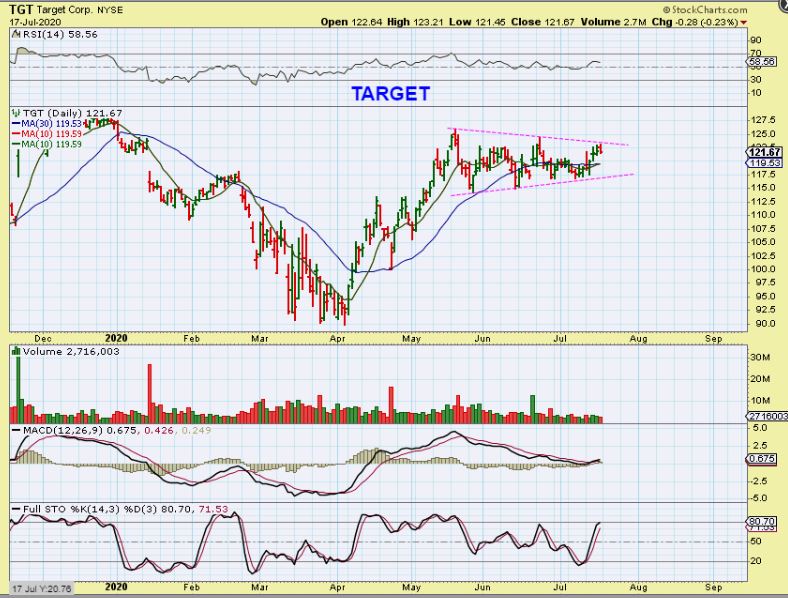
TGT seems to be bullishly consolidating recent gains too. A break upward would be a buy.
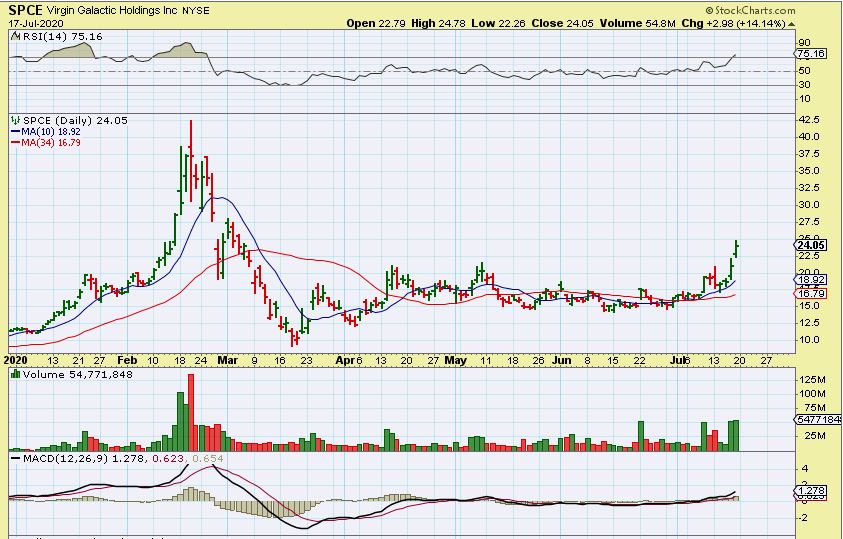
SPCE was a buy this week, and it was up 25% for the week, so things remain bullish in some areas. If you bought SPCE, ride it to $40.
THE VIX started to break down further Friday, below the 200sma and …
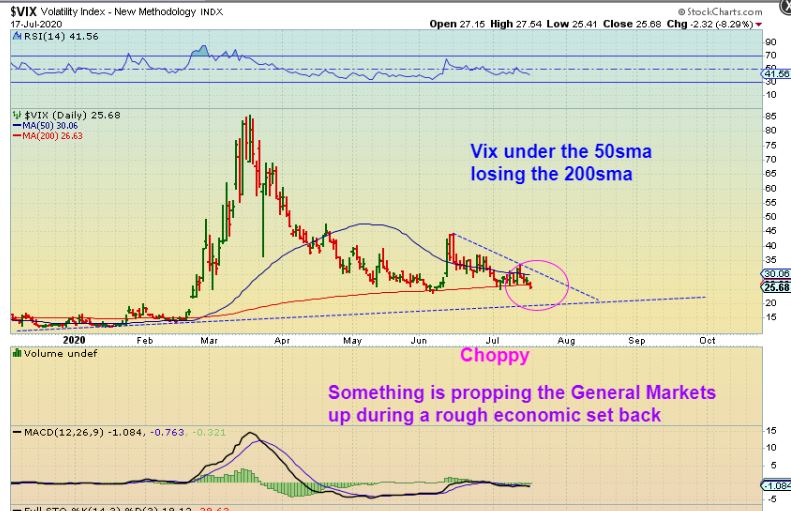
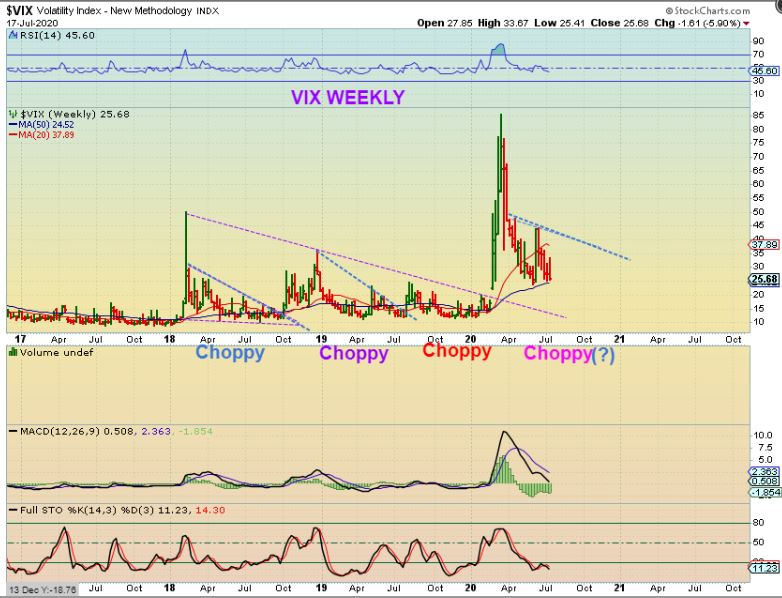
VIX – In the past after a large Pop, it often chopped around for a while too, which is what we’ve seen here recently. This seems to be saying that the General Markets are not ready to drop.
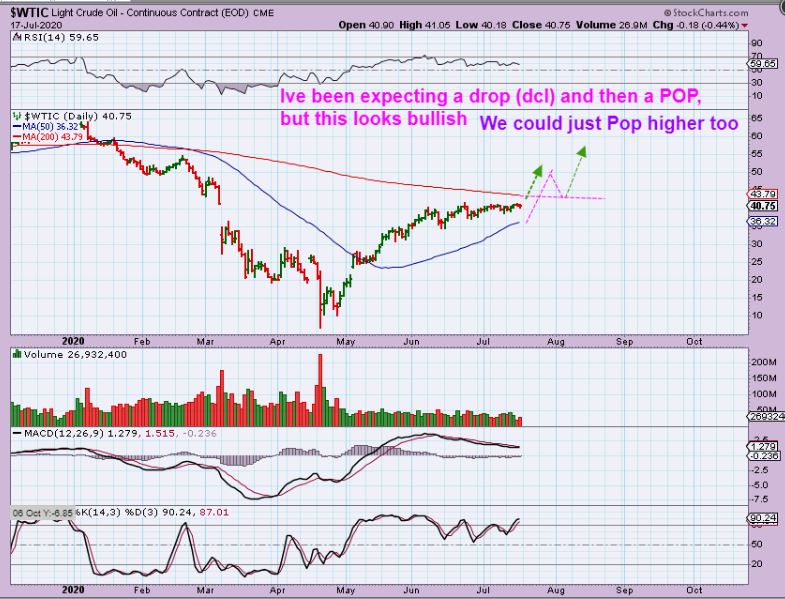
WTIC just continues to churn sideways in a very tight consolidation. We are late for a dcl, and I expected a dip to the 50sma, but if this just breaks higher it wouldn’t surprise me.
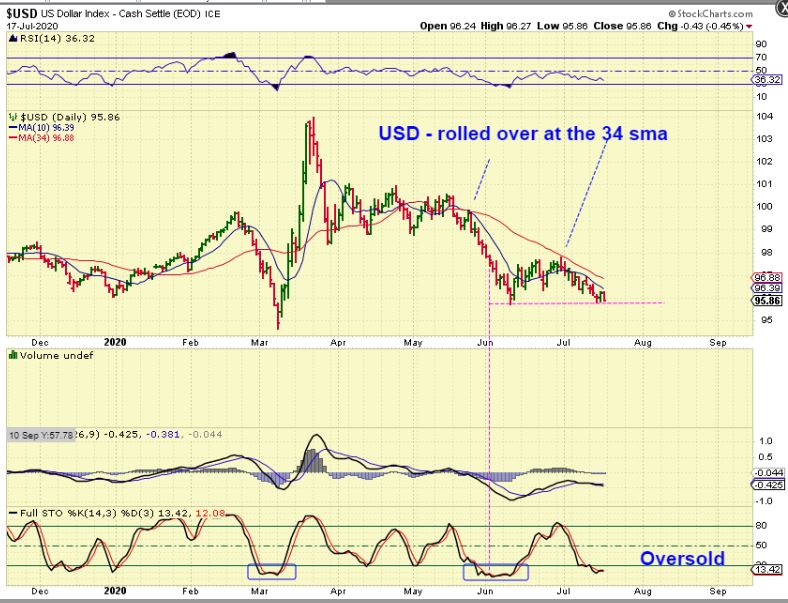
THE USD is back at the June lows after being rejected at the 34 sma. It is oversold but it can drop further and breaking the June lows is a failed daily cycle. Bearish for the USD, Possibly Bullish for Gold.
.
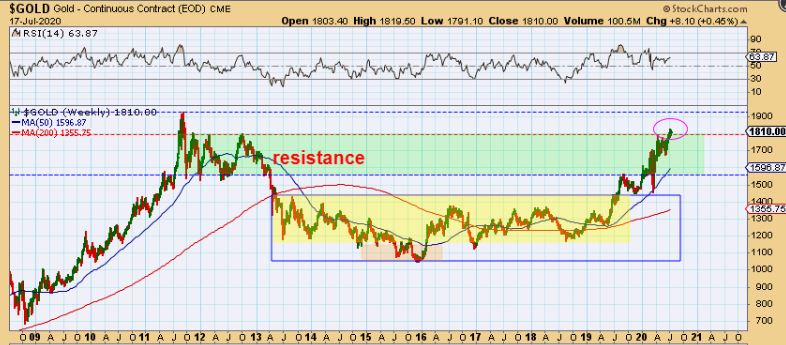
GOLD #1 – Gold has worked its way through the resistance level that I have been pointing out and actually broke higher.
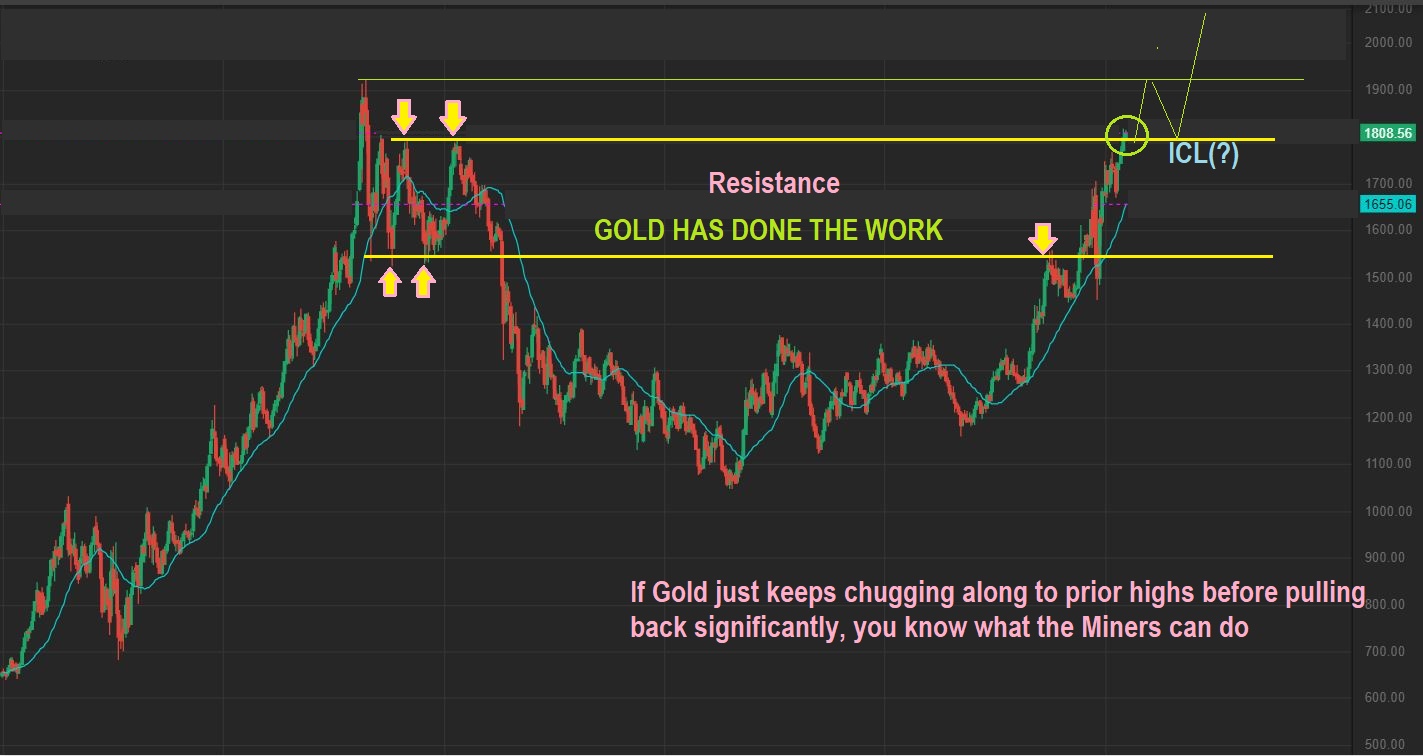
GOLD #2 – Gold can continue to push higher to the 2011 highs. Let’s just say that the Big Picture continues to look very bullish and is playing out exactly as we expected.
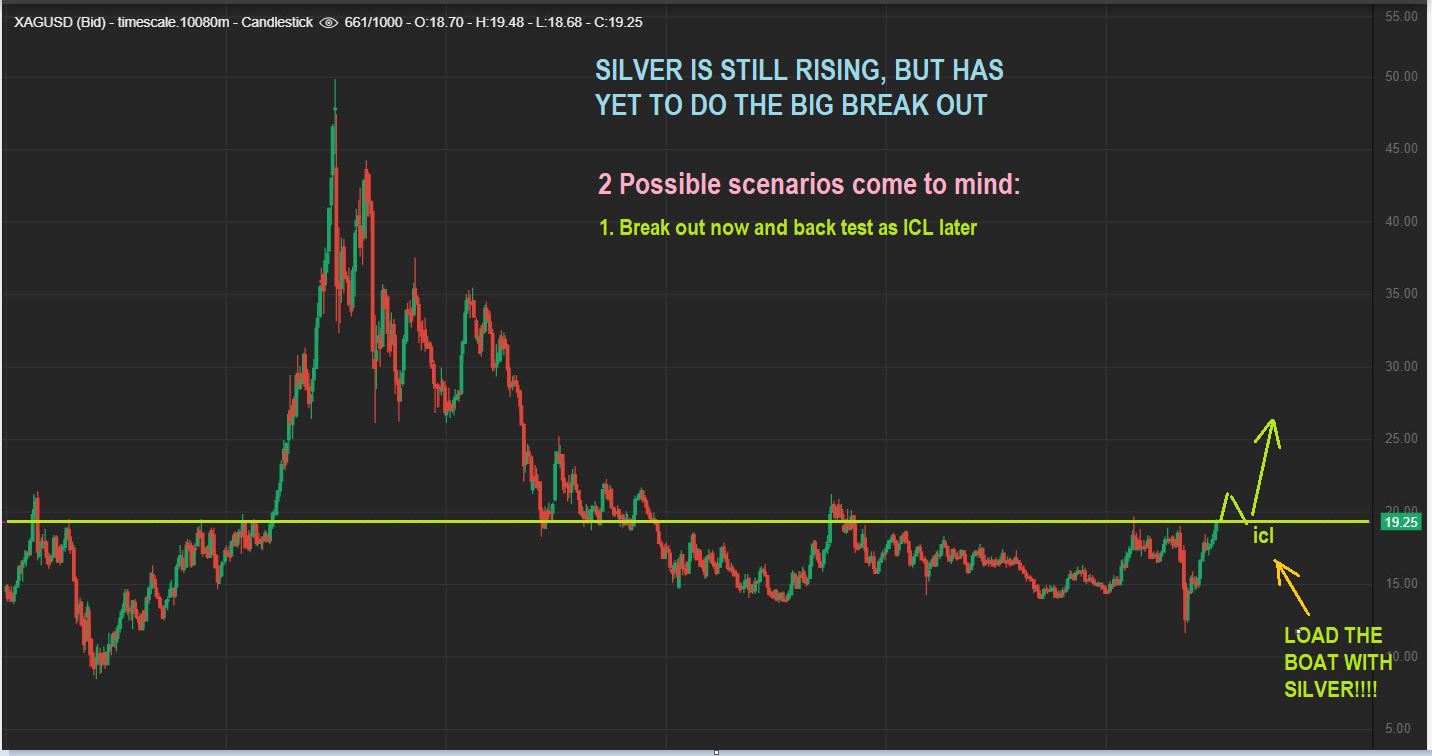
SILVER is still in the massive base. It is either going to break out here or pull back as it is right at resistance. so read idea #1 on the chart…-
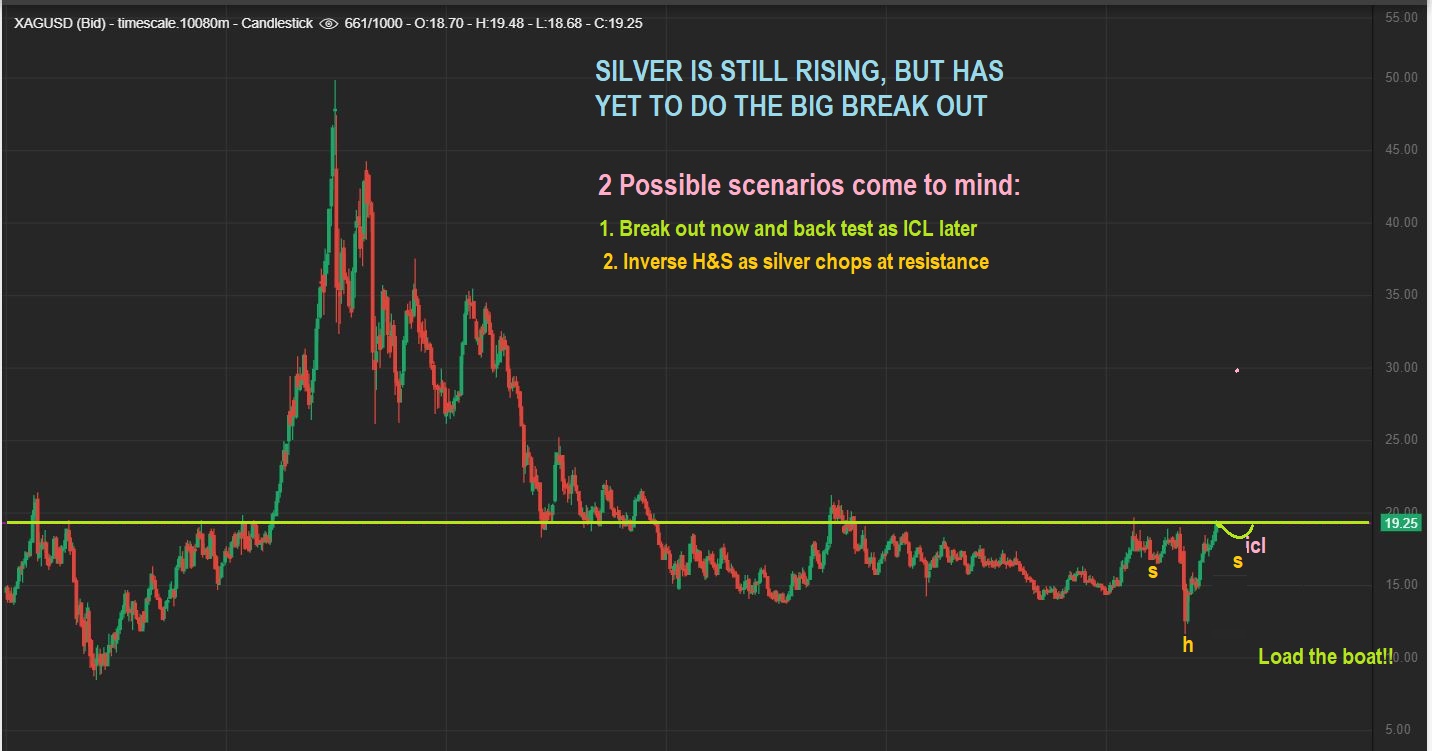
SILVER – Read #2 scenario on the chart
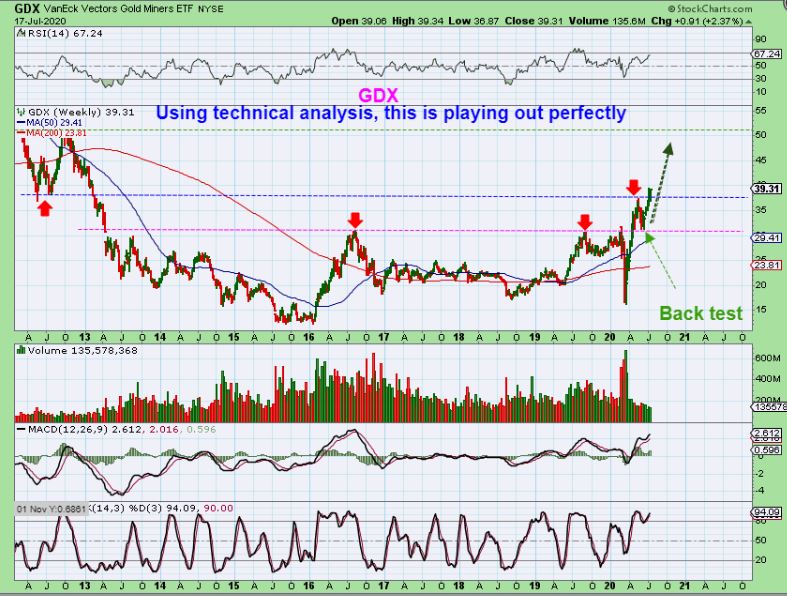
GDX has been textbook technical analysis.
1. It formed a huge multi-year base,
2. Then it broke out
3. Then it Back tested that base & pushed higher, now even breaking that next overhead resistance area.
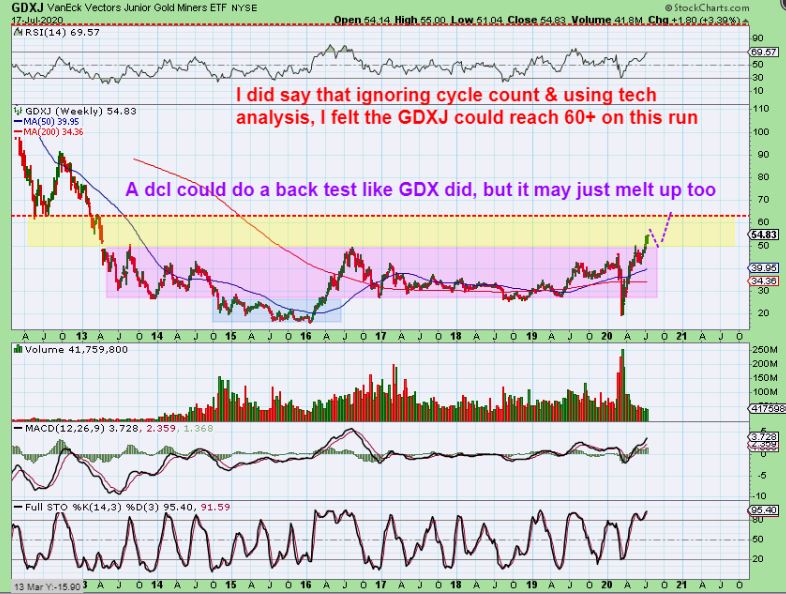
GDXJ just broke out from its base this week. I said in past reports that I thought GDXJ $60+ was possible.
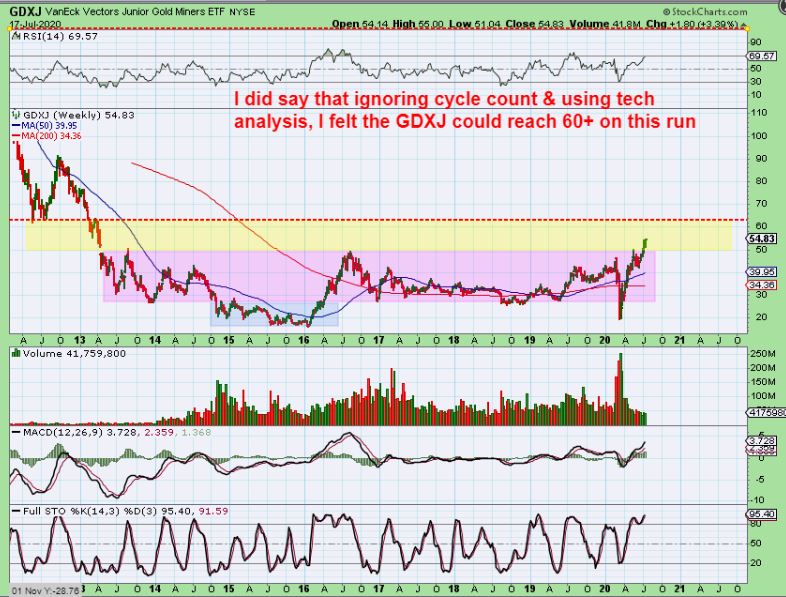
GDXJ either just continues to melt up or it does a back test pull back and then continues higher. It is possible that GDXJ runs to resistance overhead, and back tests as an ICL in the months to come.
.
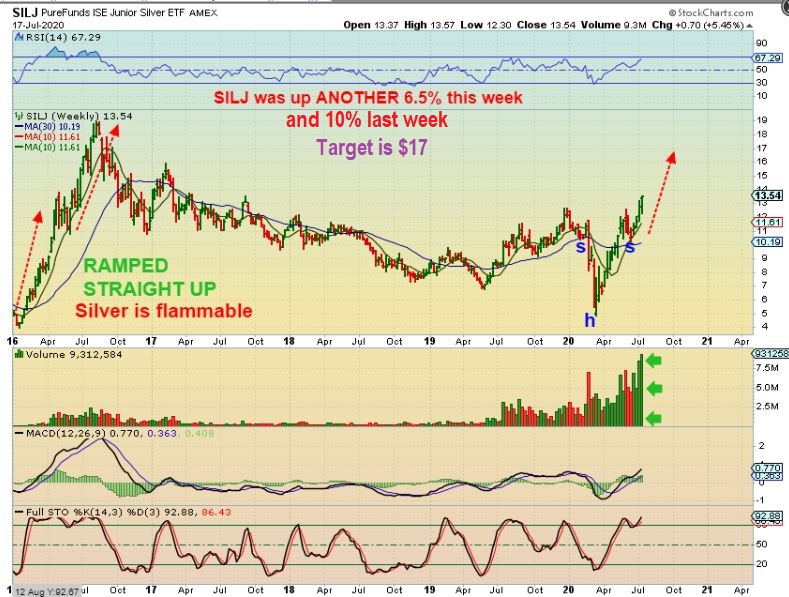
SILJ was up another 10% this week! It is accelerating out of the dip in June when it formed a ‘cup’. It had its biggest volume week ever. If this repeats what it did in 2016, it could simply melt up . I will discuss this a bit more at the end of the report.
.
I WROTE A REPORT 2 WEEKS AGO EXPLAINING WHY IT MAY BE A BAD IDEA TO BE SELLING. I MENTIONED HOW IN BULL MARKETS THINGS CAN MELT UP AND DISCUSSED WITH MANY CHARTS HOW LONG SOME BULL RUNS WERE. Some didn’t ‘peak’ until week 20 or even 30. ( It is often best to use a 13 sma as a loose stop below the 10day sma). YOU MIGHT WANT TO GO BACK & RE- READ THAT REPORT FROM JULY 4th WEEKEND . LET ME SHOW YOU WHAT HAS HAPPENED SINCE I WROTE THAT REPORT.
.
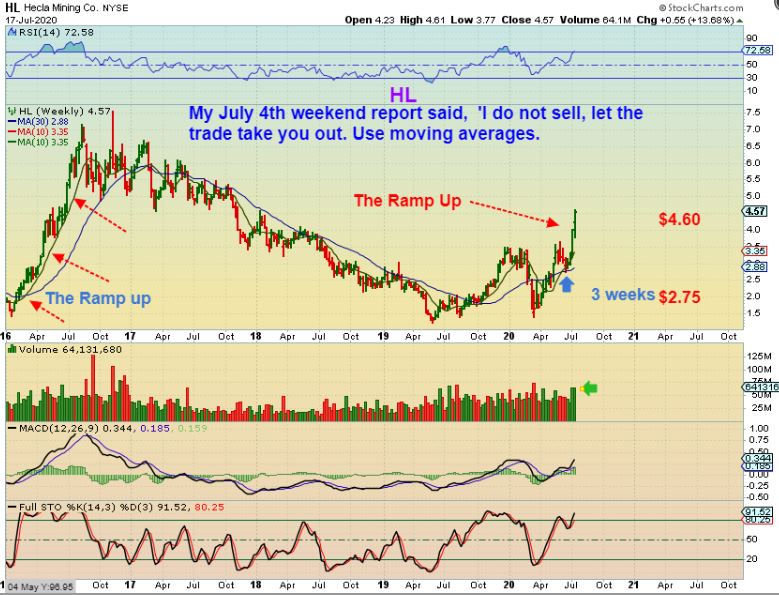
HL was up 26% by July 10th, 1 week after I wrote that report, and…

HL – was up another 13+% this week alone. That is 39-40% of Gains in 2 weeks . Read the chart.
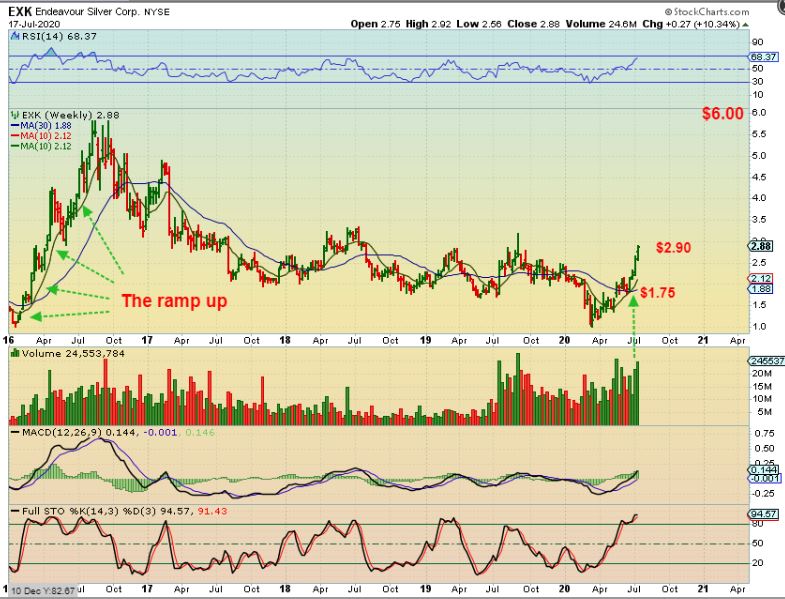
EXK ( & CDE) were up 17% that week and another 10.34% this week. That was about 30% gains in just the last 2 weeks.
.
The Bulls have certainly been running through our streets and if you held on to those Silver stocks, your gains are great.
– The General market has stalled along with Oil stocks, but they are still setting up bullishly.
– Oil stocks could put in some big gains in the weeks to come.
– As we just saw, The Precious Metals sector turned up the juice a bit this week with some Juniors and silver stocks putting in double digit gains too.
.
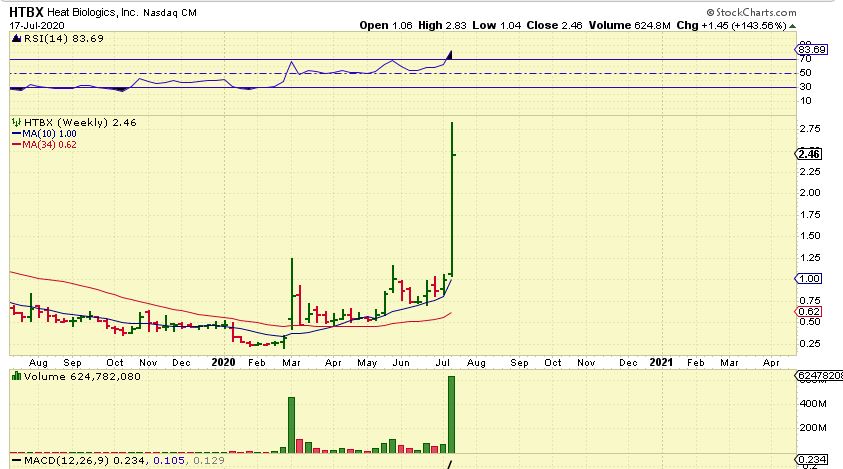
Several of The Biotech stocks that I follow and some of us own have done this ( up 143% for the week) and several others were also up 30-60%…
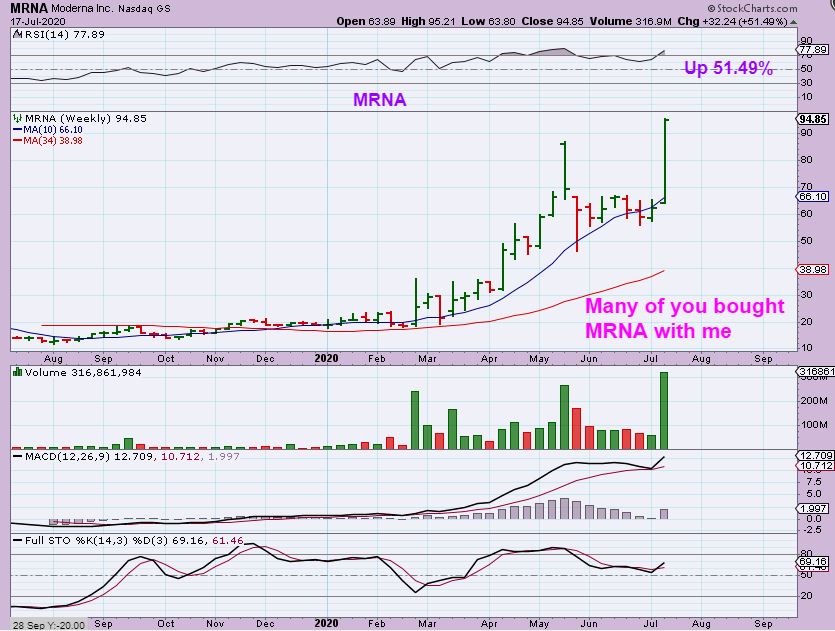
I know that a good number of you were buying MRNA with me at the $60 level too . It was up about 60% from that entry point. MRNA added 16% Gains on Friday alone as it broke to new highs! Notice that the weekly stochastics isn’t even over bought. BNTX was also up 33% in the past 2 weeks too, so it has been very rewarding in these areas.
.
So not only have we had some explosive gains in these sectors, but the set ups continue to form bullishly and if you can ride the bull without getting knocked off, there can be plenty more to come. I will discuss a bit more about this below. Enjoy your weekend!
.
~ALEX
.
Silver review by request: Some emails written have asked , “What if I sold my Silver positions over 2 weeks ago to buy a pullback that did not come?” So the question is naturally, “Now what, how do I get back in? 1. Keep waiting for a pull back? 2. Jump in and risk some losses on a pull back? ” To be honest, this is very hard for me to answer when I’m seeing a bit of a melt up and I wouldn’t have sold my positions voluntarily unless price broke the 13 or 20 sma on my positions. So I’d say that we need to go back to the charts for clues. I think that I can help, but there is no exact way to tell how this will play out, if it is a ‘melt up’.
Let’s look again at SILJ and a few Silver stocks…
.
Look at SILJ in 2016’s melt up. We had a solid run #1, and then a blue box choppy consolidation period, and then run up #2 was almost non stop too. I DO see what might have been a dcl midway up. It was a 1 week dip as seen by my arrow. Do we get one here soon? I can’t promise or even know if we get do get a mild one or sharp one like that, so that’s what makes this tough . Volume is extreme and SILJ is up 16% in 2 weeks, so…
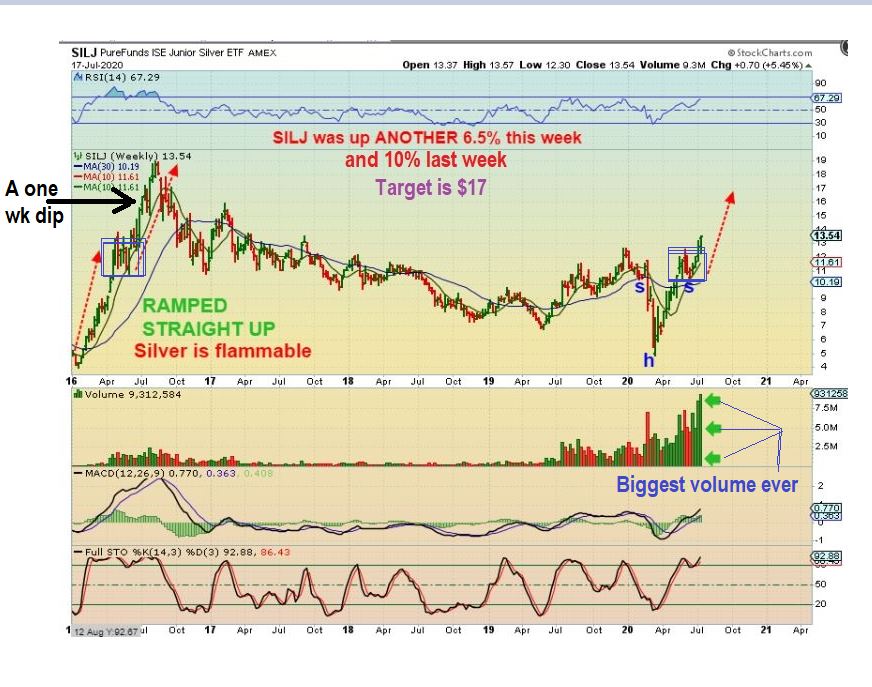
SILJ #2 : Volume is extreme and SILJ is up 16% in 2 weeks, so you either build your own basket of laggers or try to find a way back in ( start small & add?). Let’s look at something else…
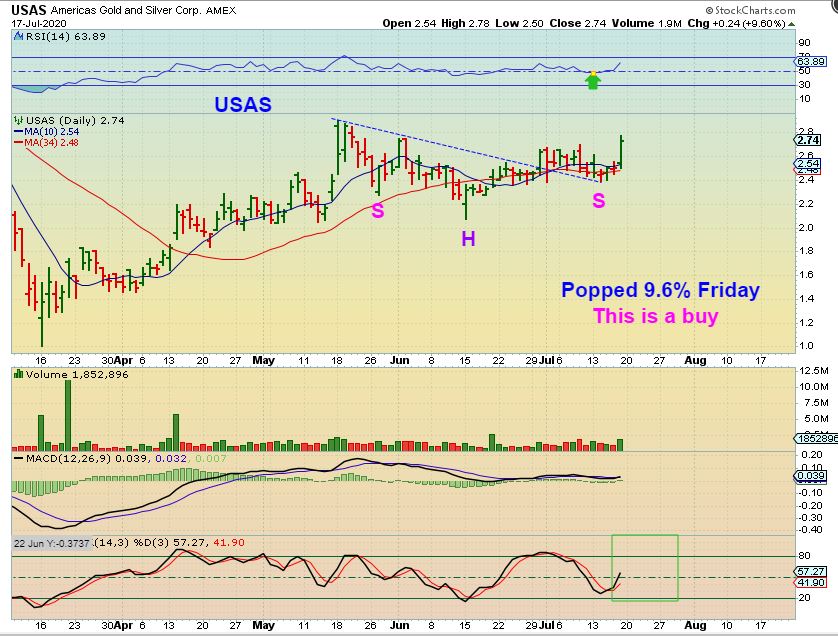
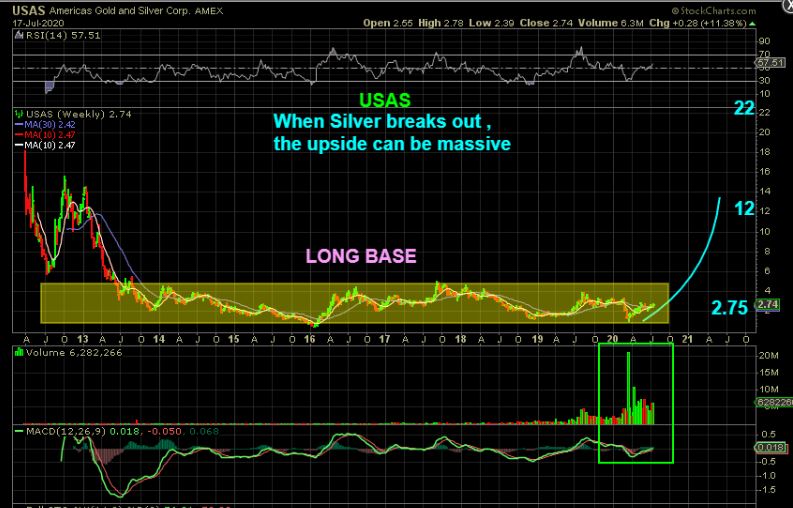
USAS popped over 9% Friday, but this is one that was lagging. I personally would be buying some of this. This is a buy. Now let me show you something else…
.
USAS WEEKLY is a massive base. I showed you that SILVER itself is in a massive base and wants to break out. Do you see the potential in USAS? The top of the base alone is roughly $5+, and it probably wants to go there now (100% gains). Breaking out and ramping up to prior price levels is a home run for the Buy & Hold crowd. Imagine buying a stock near $2 and running to $22. Now…
Now to HL – USAS has an inverse H&S and so did HL. Remember that HL just put in 40% gains in the last 2 weeks by breaking this H&S. Look at the RAMP UP on the left in 2016. We could be seeing that 2016 run repeat here.
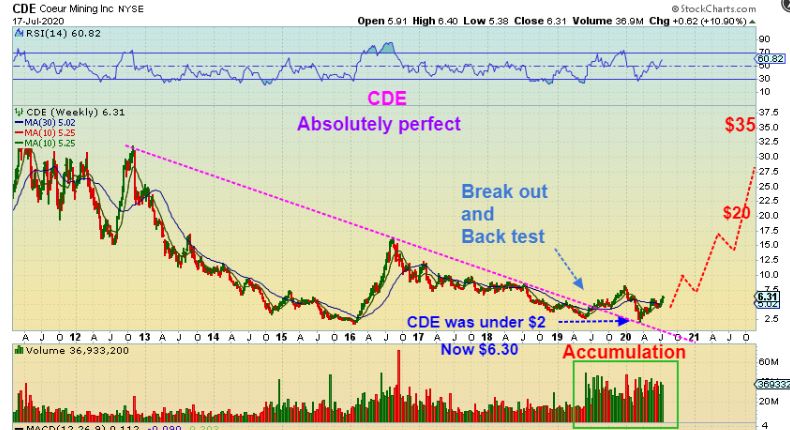
Now look at CDE– Yes CDE was up 11% this week alone, but this is NOT as extended as HL or EXK, and look at the potential going forward. Let me discuss CDE…
.
CDE was under $2 when it back tested the long term break out in our March crash. It is now $6.30. In 4 months it gains 200%. Do you now see the upside potential? I recommended CDE 2 weeks ago at $5 and said it would form a cup. It has, and it is not a sell, I think it is just getting started.
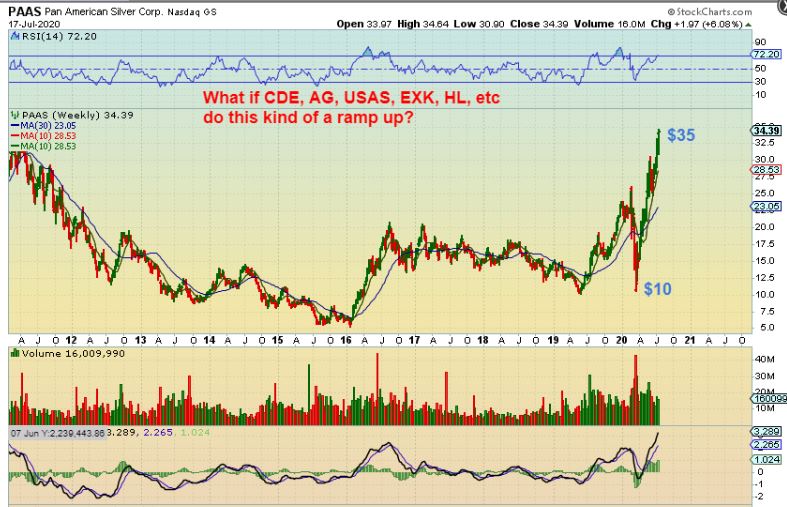
PAAS is an example of what any of these Silver stocks can and may do when Silver breaks out of that base.
EXK is ramping up higher, again it added another 10% last week, but look at 2016. These can fly. Look closely and yes, there were dips. That means that maybe you will get another chance to enter lower, but it is a little tricky trying to enter once they get running. This is also 200% off of the March lows $1 to $3, but it looks like it will break from this multiyear base before or with Silver.
Take a look at AG Weekly. Look at that 2016 Ramp up. It never lost the 10 week ma in 2016, and it hasn’t lost it now. Ag moved from $4 to $11 here out of the lows and it may be 1/2 way to its destination if it runs like 2016’s melt up. This recently chopped over to the 10 week ma and that would be the buy. Do you know what that choppiness recently was?…
On July 7th AG was a dip to the 50sma where I pointed it out as a buy after writing my weekend report about not selling. Lets look at AG Now…
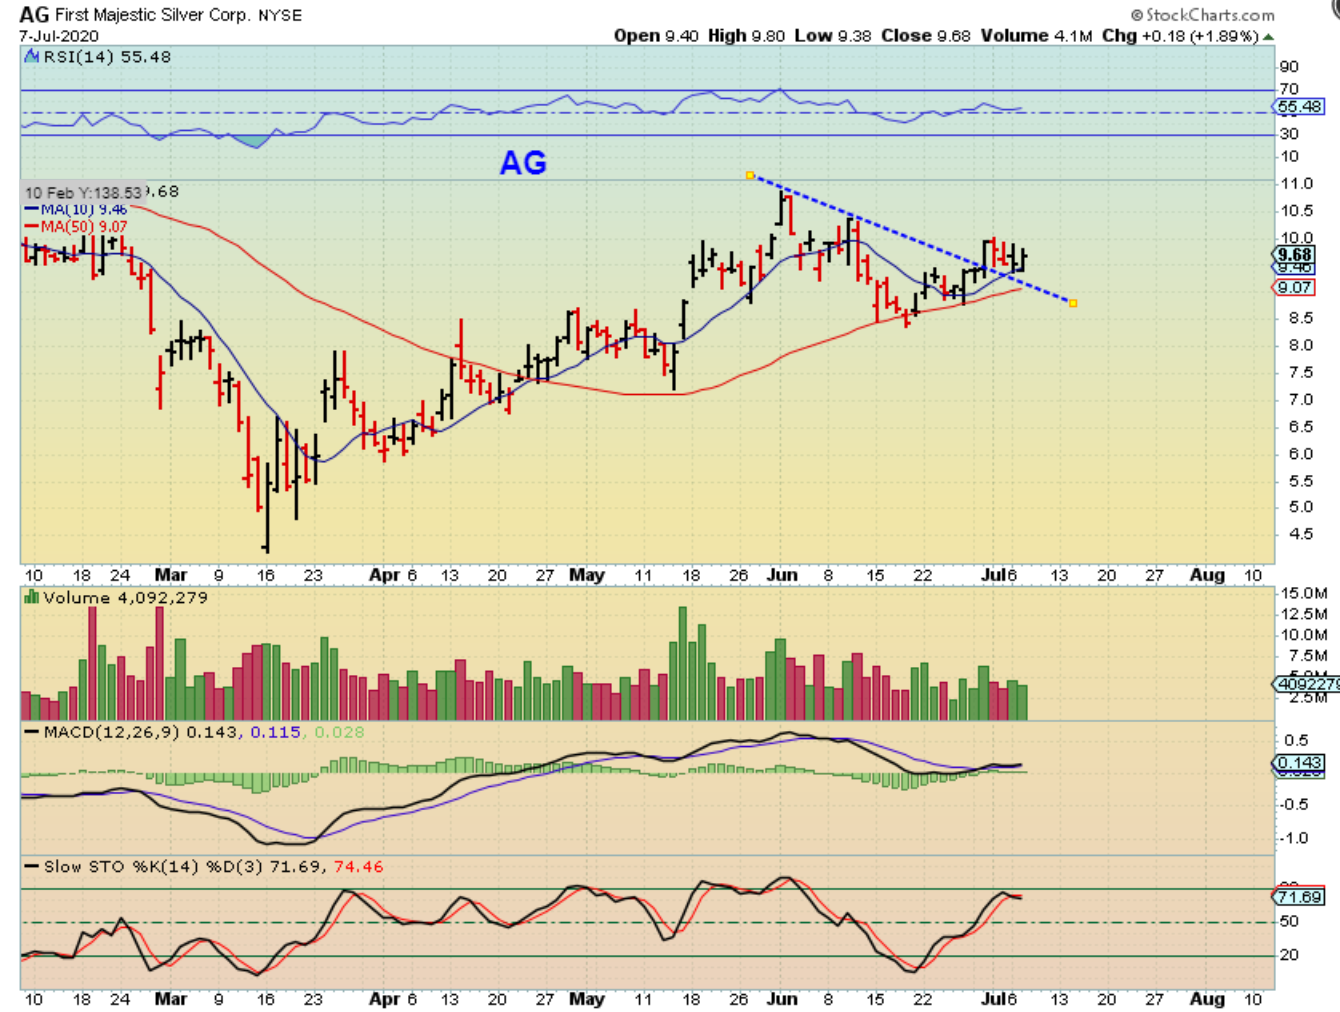
AG has formed a cup & handle. That is what that choppiness on the weekly chart was. In my opinion, it was a buy at the bottom of the cup and it is still a buy with this handle.
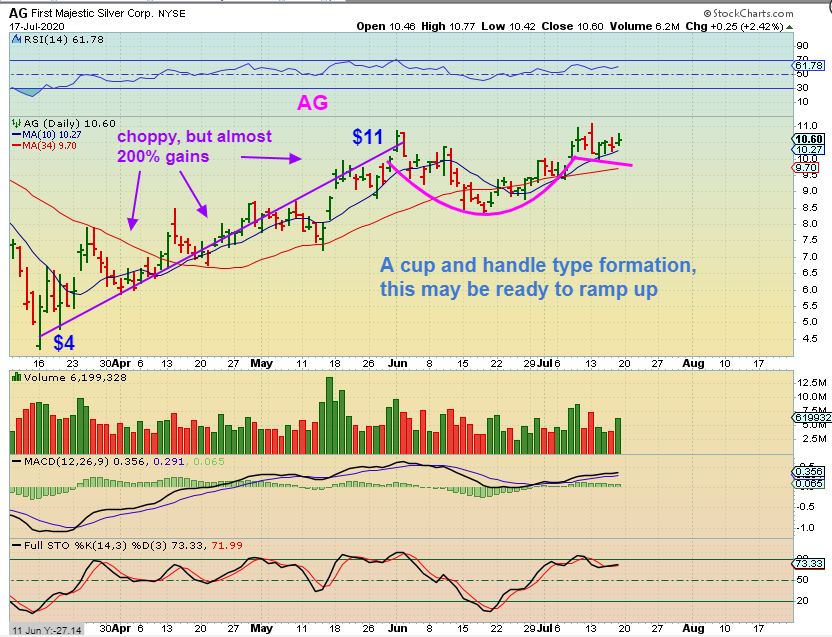
And again, the weekly shows that current cup & handle as a simple choppy move to the weekly 10ma, which was always a buy in that 2016 ramp up.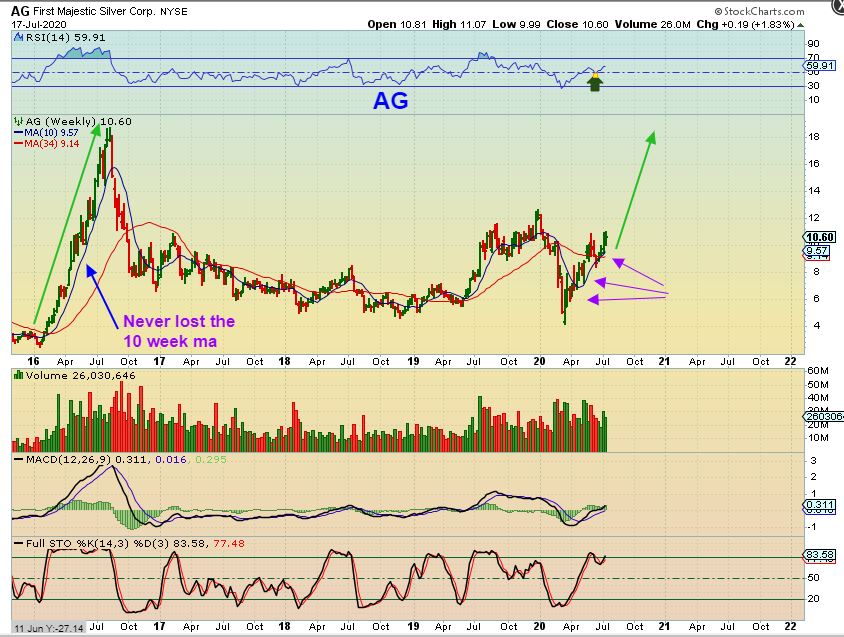
.
So my point is that some Silver Miners are extended, others have consolidated and I think they are safe to buy. IF we get a drop, they’ll likely pull back to the 50 sma or 34 sma briefly, and then be ready to ramp up higher. Find a way to get in a lagger and add if it dips, ride it if it rips. 🙂
.
TIME FOR ANOTHER LESSON: FUN WITH PATTERNS!
.
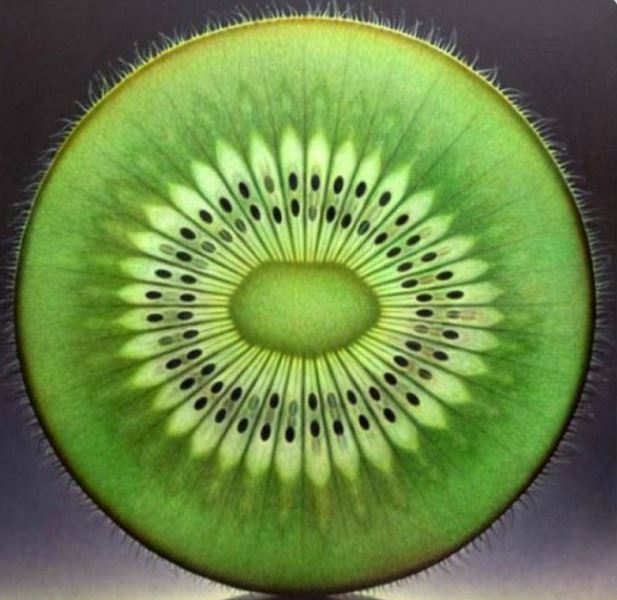
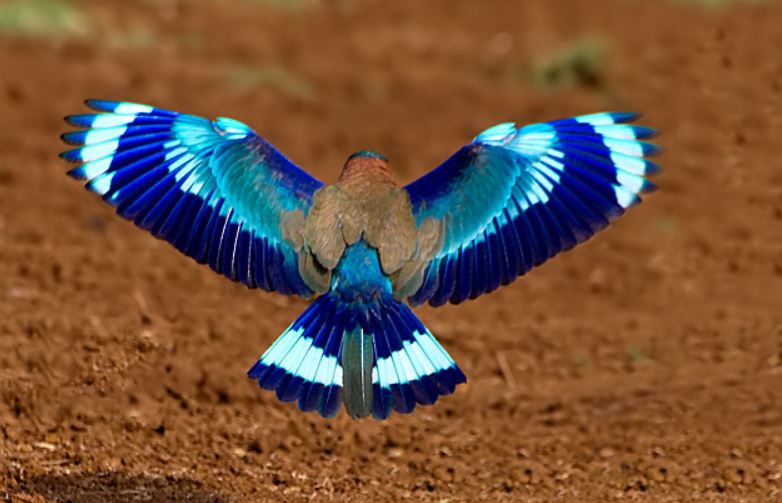
I have mentioned in past reports that Nature is full of patterns, and they often repeat. I have studied Fibonacci Patterns in Nature, and you just cannot believe the beauty of these natural designs. I often see patterns in the charts too, and it can help us to see things differently when we trade too. So I want to just briefly discuss with you what I see lately.
First, I will share a couple of natures beautiful patterns and then on to the charts! Notice the symmetry and repetition in these patterns of nature…
.

.
.
.
With that above example of natural patterns that appear in nature, I’d like for you to see 1 of many ‘patterns’ that keeps appearing in my Charts With Bases and has helped me with my short term trading.
.
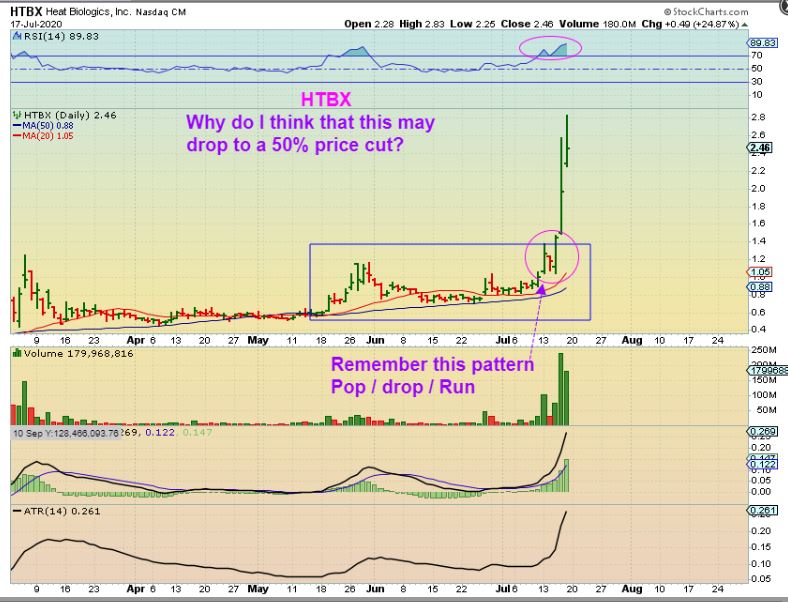
HTBX – I sold most of my position at an average of $2.50. It MIGHT go higher, but I feel that this can pull back.
2 things I want to point out on this chart.
1. Look at the pattern in the Magenta circle. It is the POP Toward Break out , a 1 day DROP, and then the Real surge higher.
2. Why do I sell such a bullish push higher? We will look at SOLO…
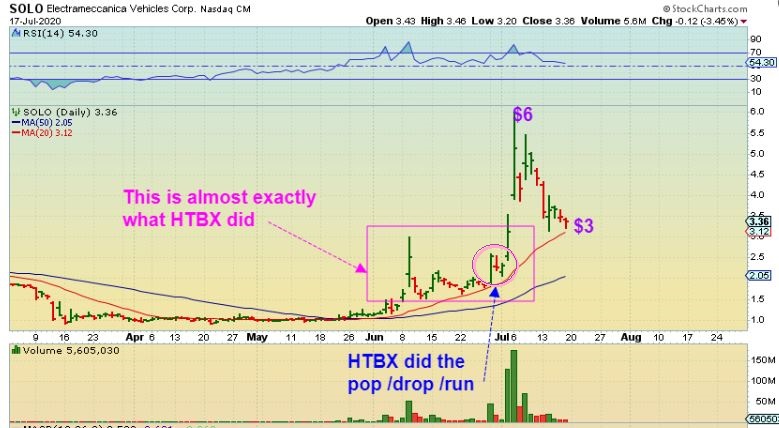
SOLO – 2 things I am pointing out …
1. Do you see that pattern of a POP, 1 day drop , and the Real Surge Higher? I see this a lot. It shakes people out before the REAL move.
2. This is a twin of the chart above (HTBX). Notice also the pull back after the surge. It is normal and I see it all of the time.
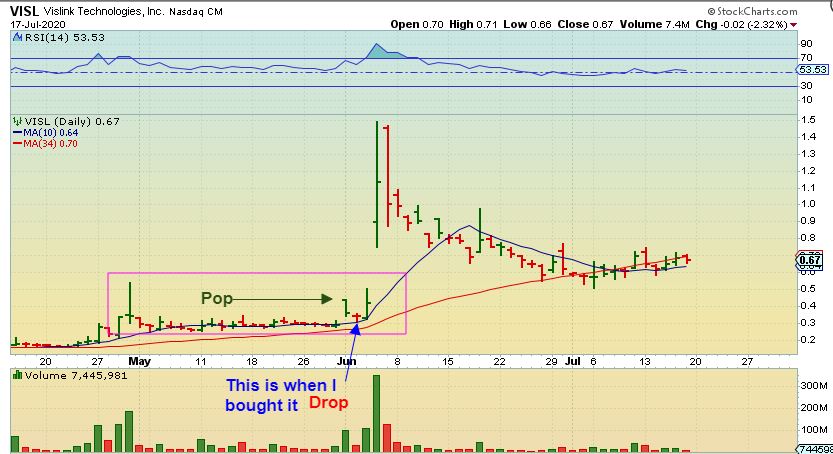
You may recall that I/ we traded Bases of VISL & NAKD . Did they have that pattern too?
.
VISL formed that base between 2 pops also. After that based formed…
1. We got the POP, it dropped for 1 day and then the real surge took place.
2. It also then sold off, taking back a lot of the gains. I sold that huge pop since it was 200% gains
.
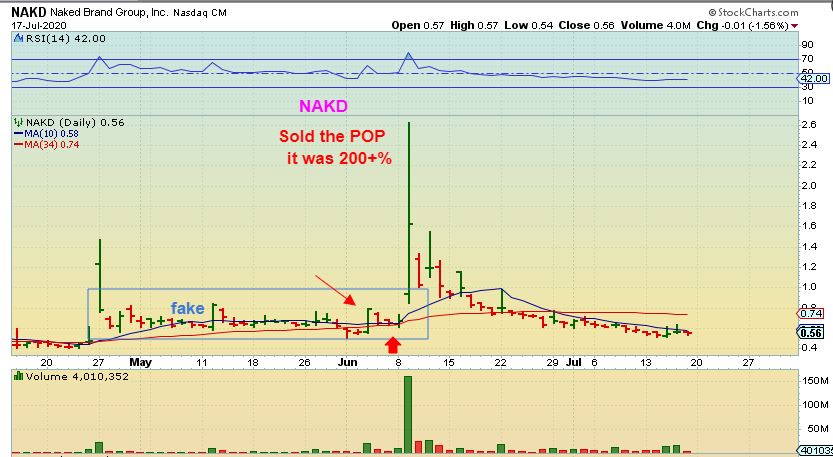
NAKD – I saw the long base and bought it after a high volume pop.
1. It Popped, dropped for 2 days and then the Real surge came in.
2. After the 200% surge, it started to take the gains away.
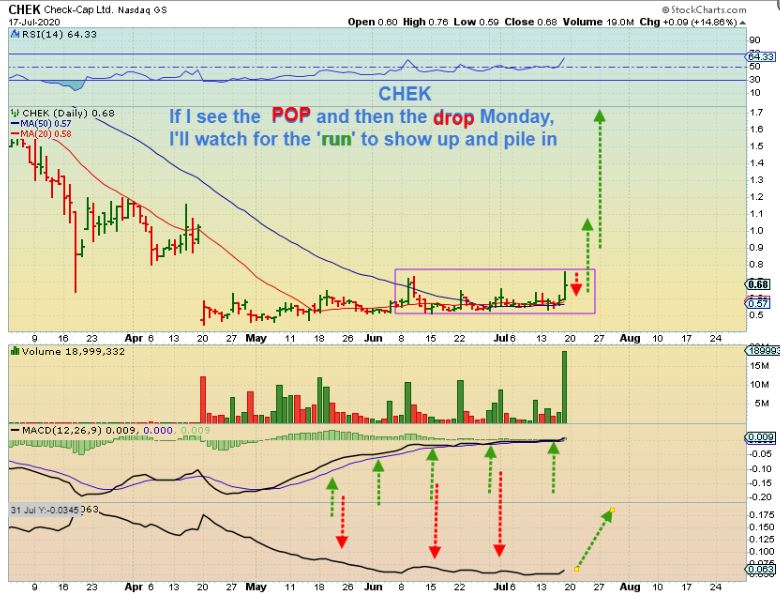
CHEK started to POP Friday and pulled back (Still up 15%). It may actually POP more Monday, drop Tuesday and then really surge Wednesday if it follows that pattern. That is just something to watch for, but I’ve been in Cheks base for weeks and I am patiently waiting for the real payday.
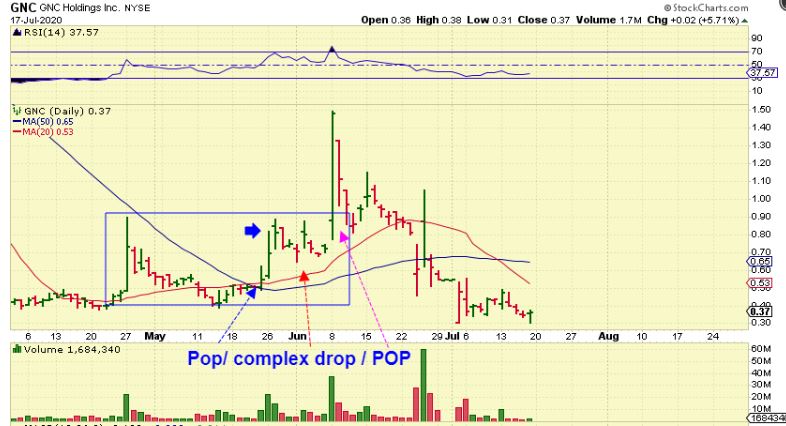
GNC had a complex version of that run to prior highs,
1. This had a POP, Then a prolonged drop or chop, and then the Real surge.
2. It sold off since then, I sold that ‘real’ pop.
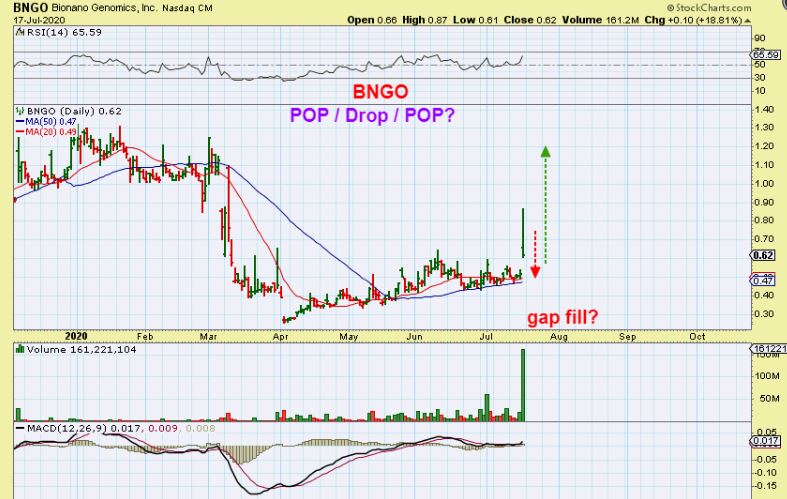
BNGO may or may not follow that pattern. It looks a bit different. This has more of an uphill slanted base. So far we got a really big surge out of the base already, but it dropped back intraday. It was still up almost 20% at the close Friday, I’m looking forward to seeing how this one plays out. Pop , drop, Surge? We’ll see.
Some of these are forming a different pattern. They seem to Base out, POP higher and then drift into a consolidation right away. These can start up-trending and may become BUY & HOLD moves in an uptrend. Time will tell, but let me show you a couple of these.
.
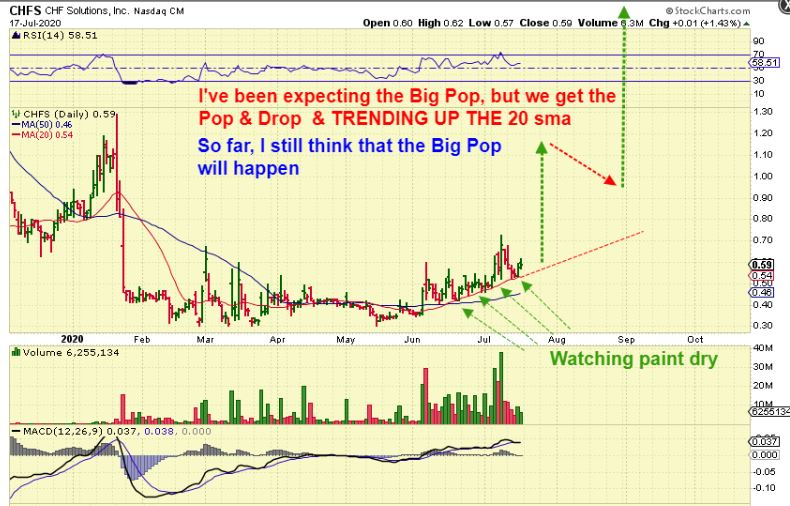
CHFS popped and then chopped sideways repeatedly, forming a triangle or wedge. It then Popped again and has just steadily been climbing up that 20sma. It could just keep trending higher, but I think that it is more likely to POP or Surge higher soon, as drawn here. .
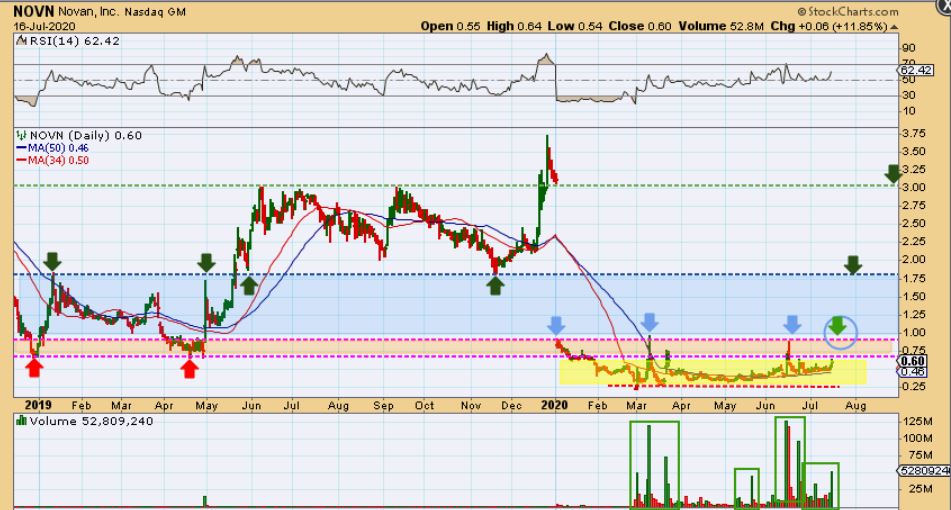
NOVN has been chopping sideways inside of this Yellow base. I wanted to draw resistance levels, in case it starts trending higher rather than bursting higher. I noticed that it is actually currently at resistance, so this may be (temporarily) keeping it from Surging recently. I still think that it’ll pop to near $1.00 sooner than later. It could also surge to $1.80. The many high volume spikes in 2020 are a good sign.
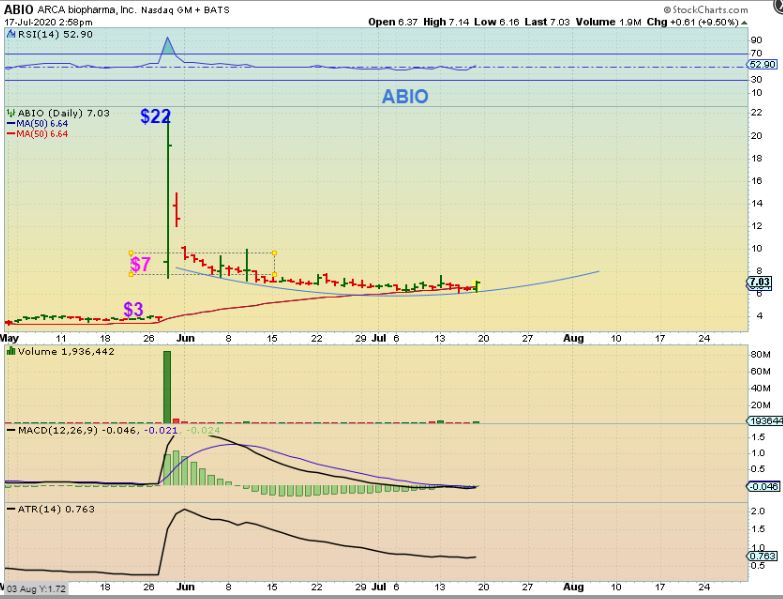
I like this long base on ABIO, I think that it’s one to keep an eye on ( watchlist). .