July 11 Weekend Report
I think that you may be surprised by what I’ve found from the last weeks trading, because I myself was slightly surprised. My weekend Big Picture Reports often only contain weekly charts for that big Picture, but this one may need a few daily charts to help us get the whole picture. Let’s get to the charts!..
.
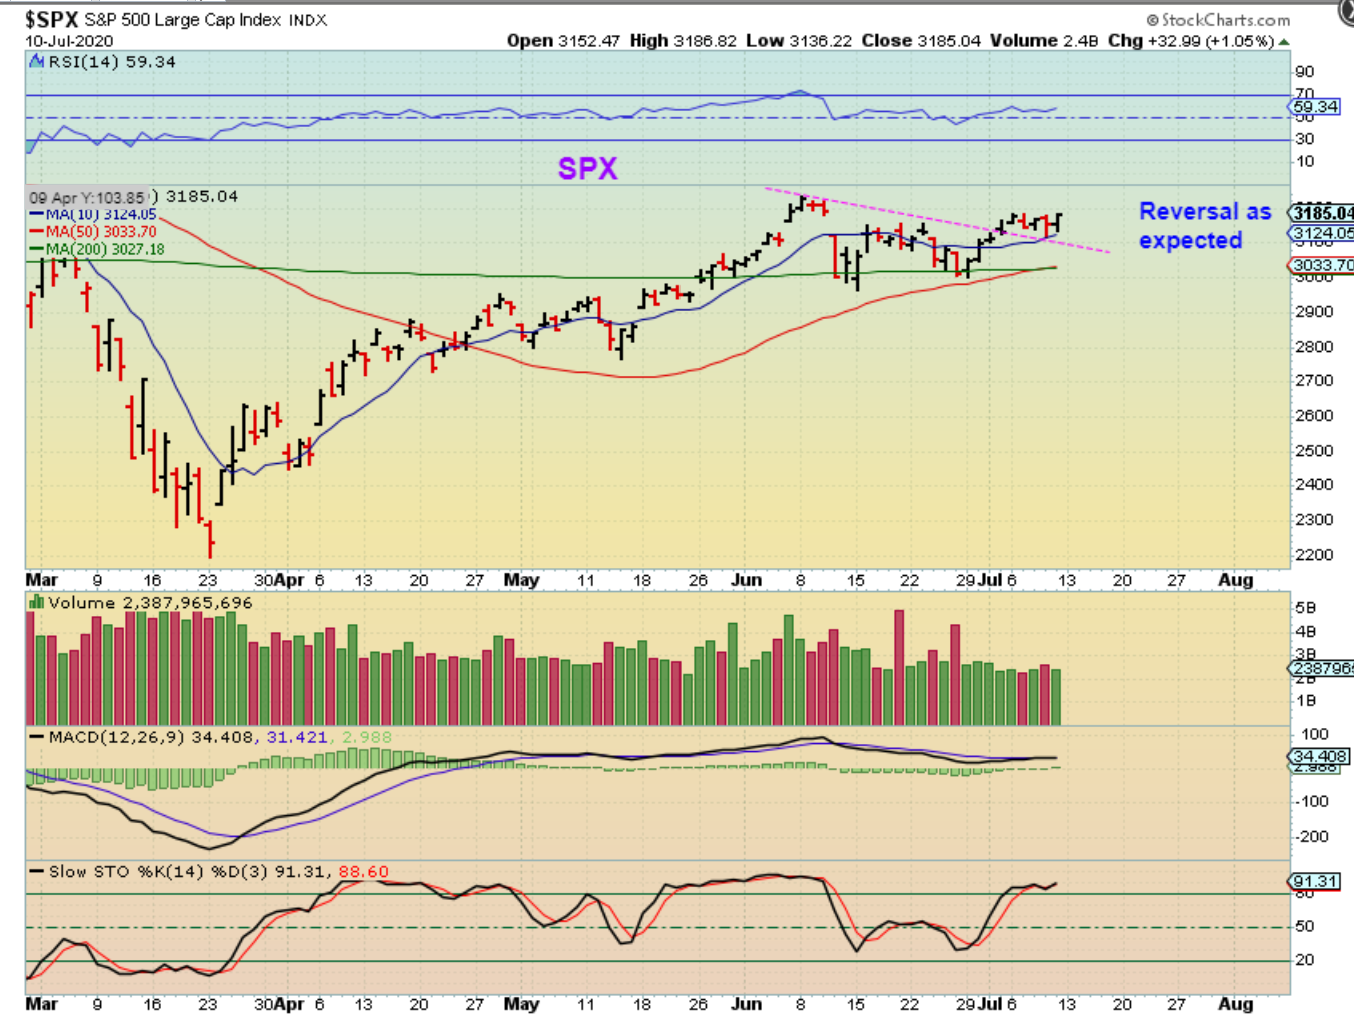
SPX DAILY – This is playing out as expected. We got a back test of the trend line and 10 sma and price reversed higher Friday. I pointed out in Friday mornings report (when futures were Red) that TSEM, MU, AMD and other stocks made me feel that even with Thursdays drop, we should go higher.
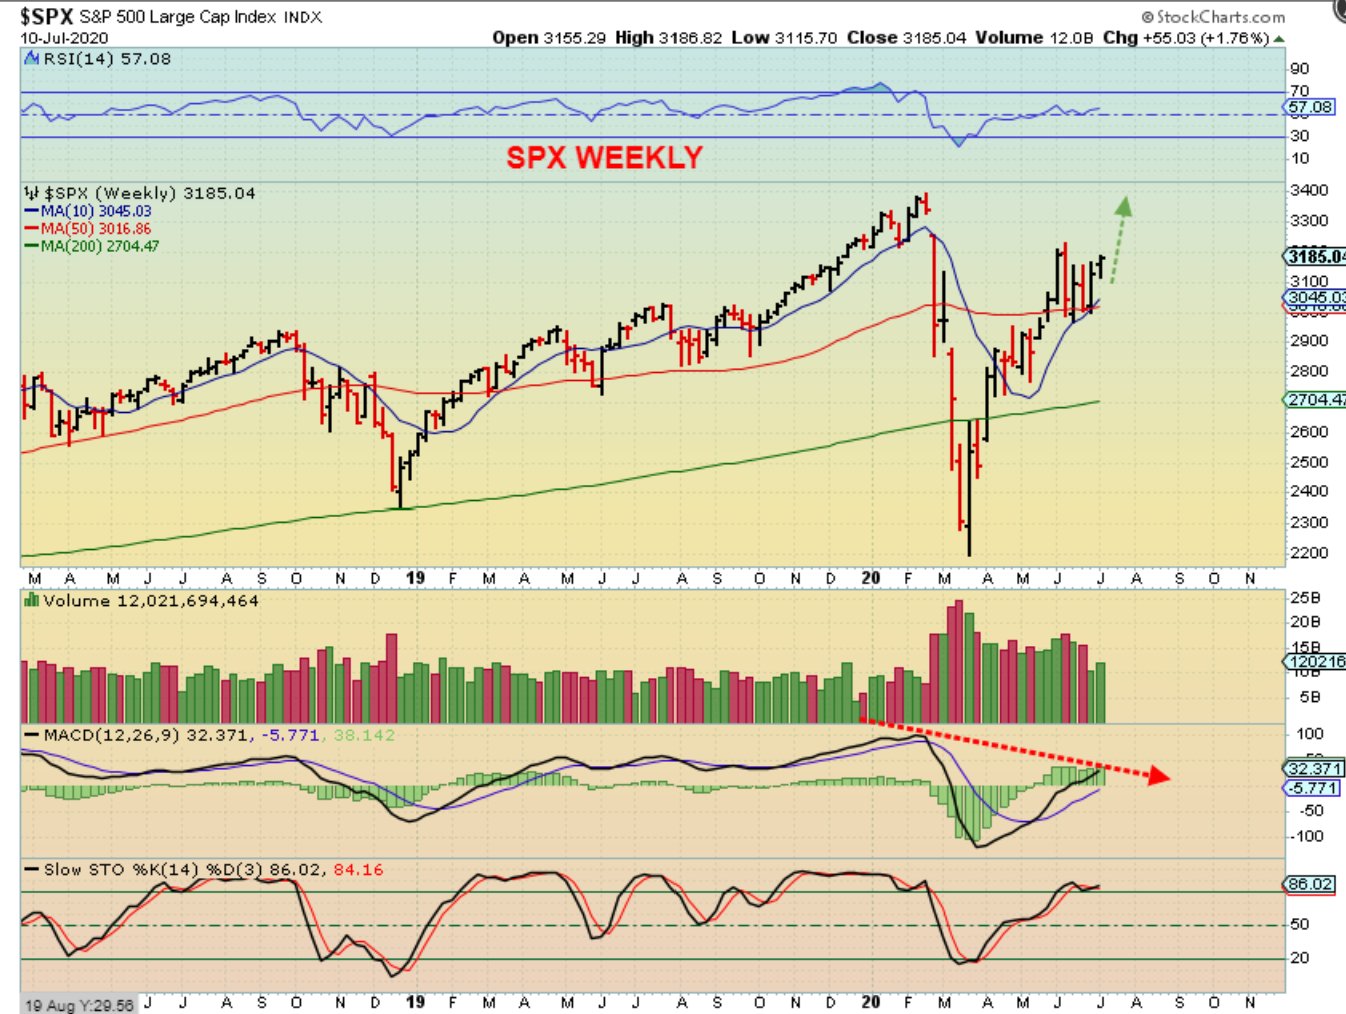
SPX WEEKLY – So I think that we can expect a move higher at the start of next week.
WTIC DAILY– This sideways move has been tight, and it may be distorting a dcl in the same way that I have said that triangles often obscure when a dcl formed. It is a milder form of a dip, so it doesn’t show up the same way. THAT SAID: This now looks bullish without a real deep DCL. Oil sold off Friday and revered the 10sma.
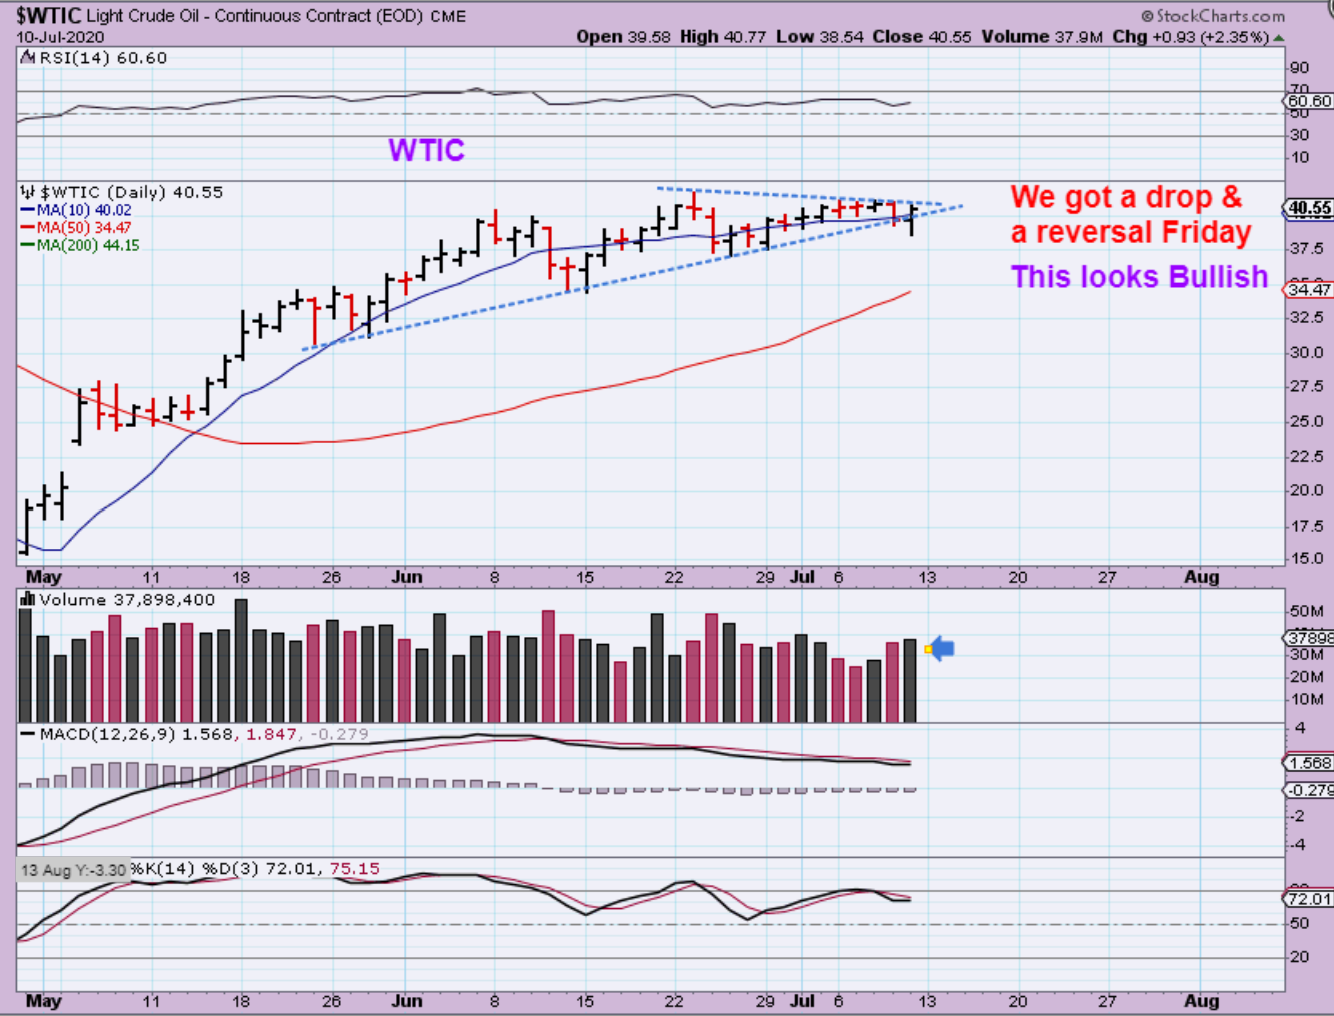
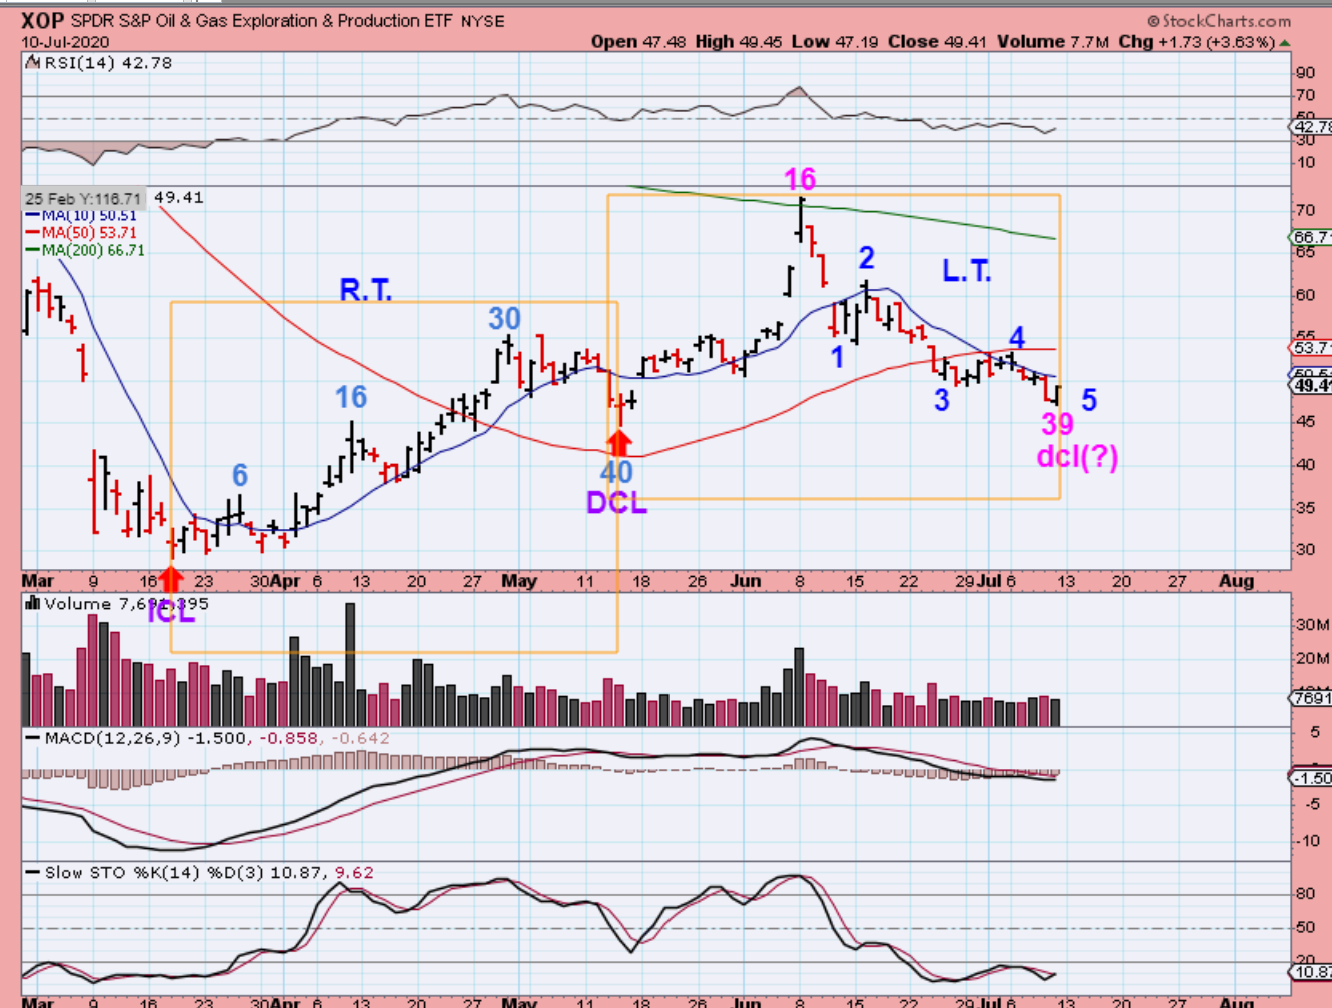
So looking at The XOP -I have mentioned a possible 5 wave down low forming soon.The first daily cycle was 40 days long, and Fridays reversal formed on day 39. This MIGHT be the low, but we need a move through the 10sma to start to confirm that. Many Energy stocks look like this& could become a buy next week.
.
THIS IS THE PART OF THE REPORT THAT MAY SURPRISE YOU
.
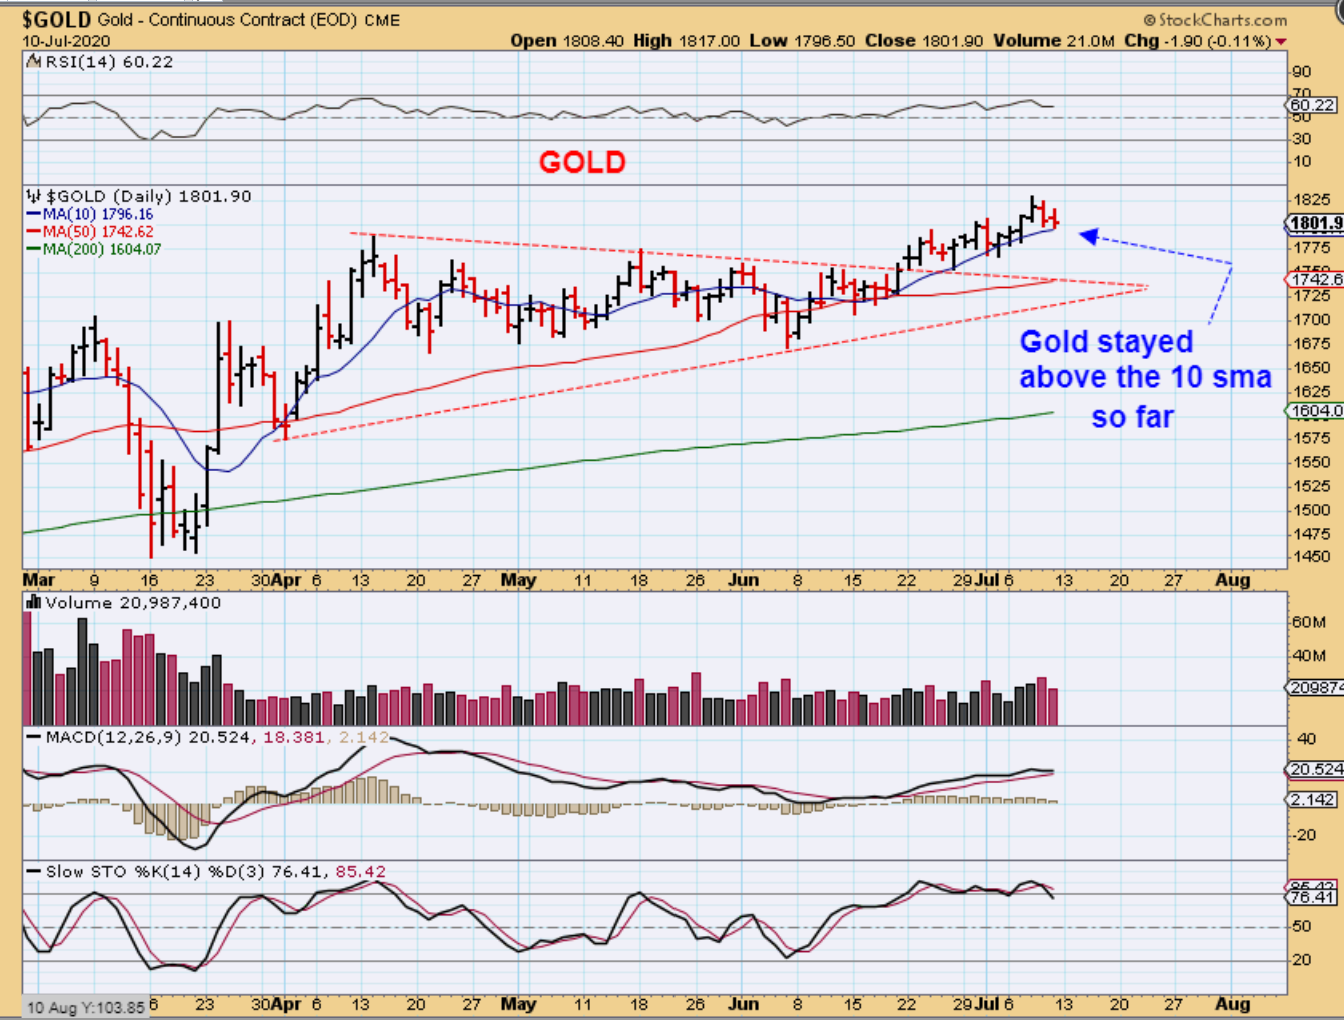
GOLD DAILY – We saw Gold move higher Monday through Wednesday, and then pull back Thursday and Friday. It remains above the 10sma ( None of this is the surprising part yet ) 🙂
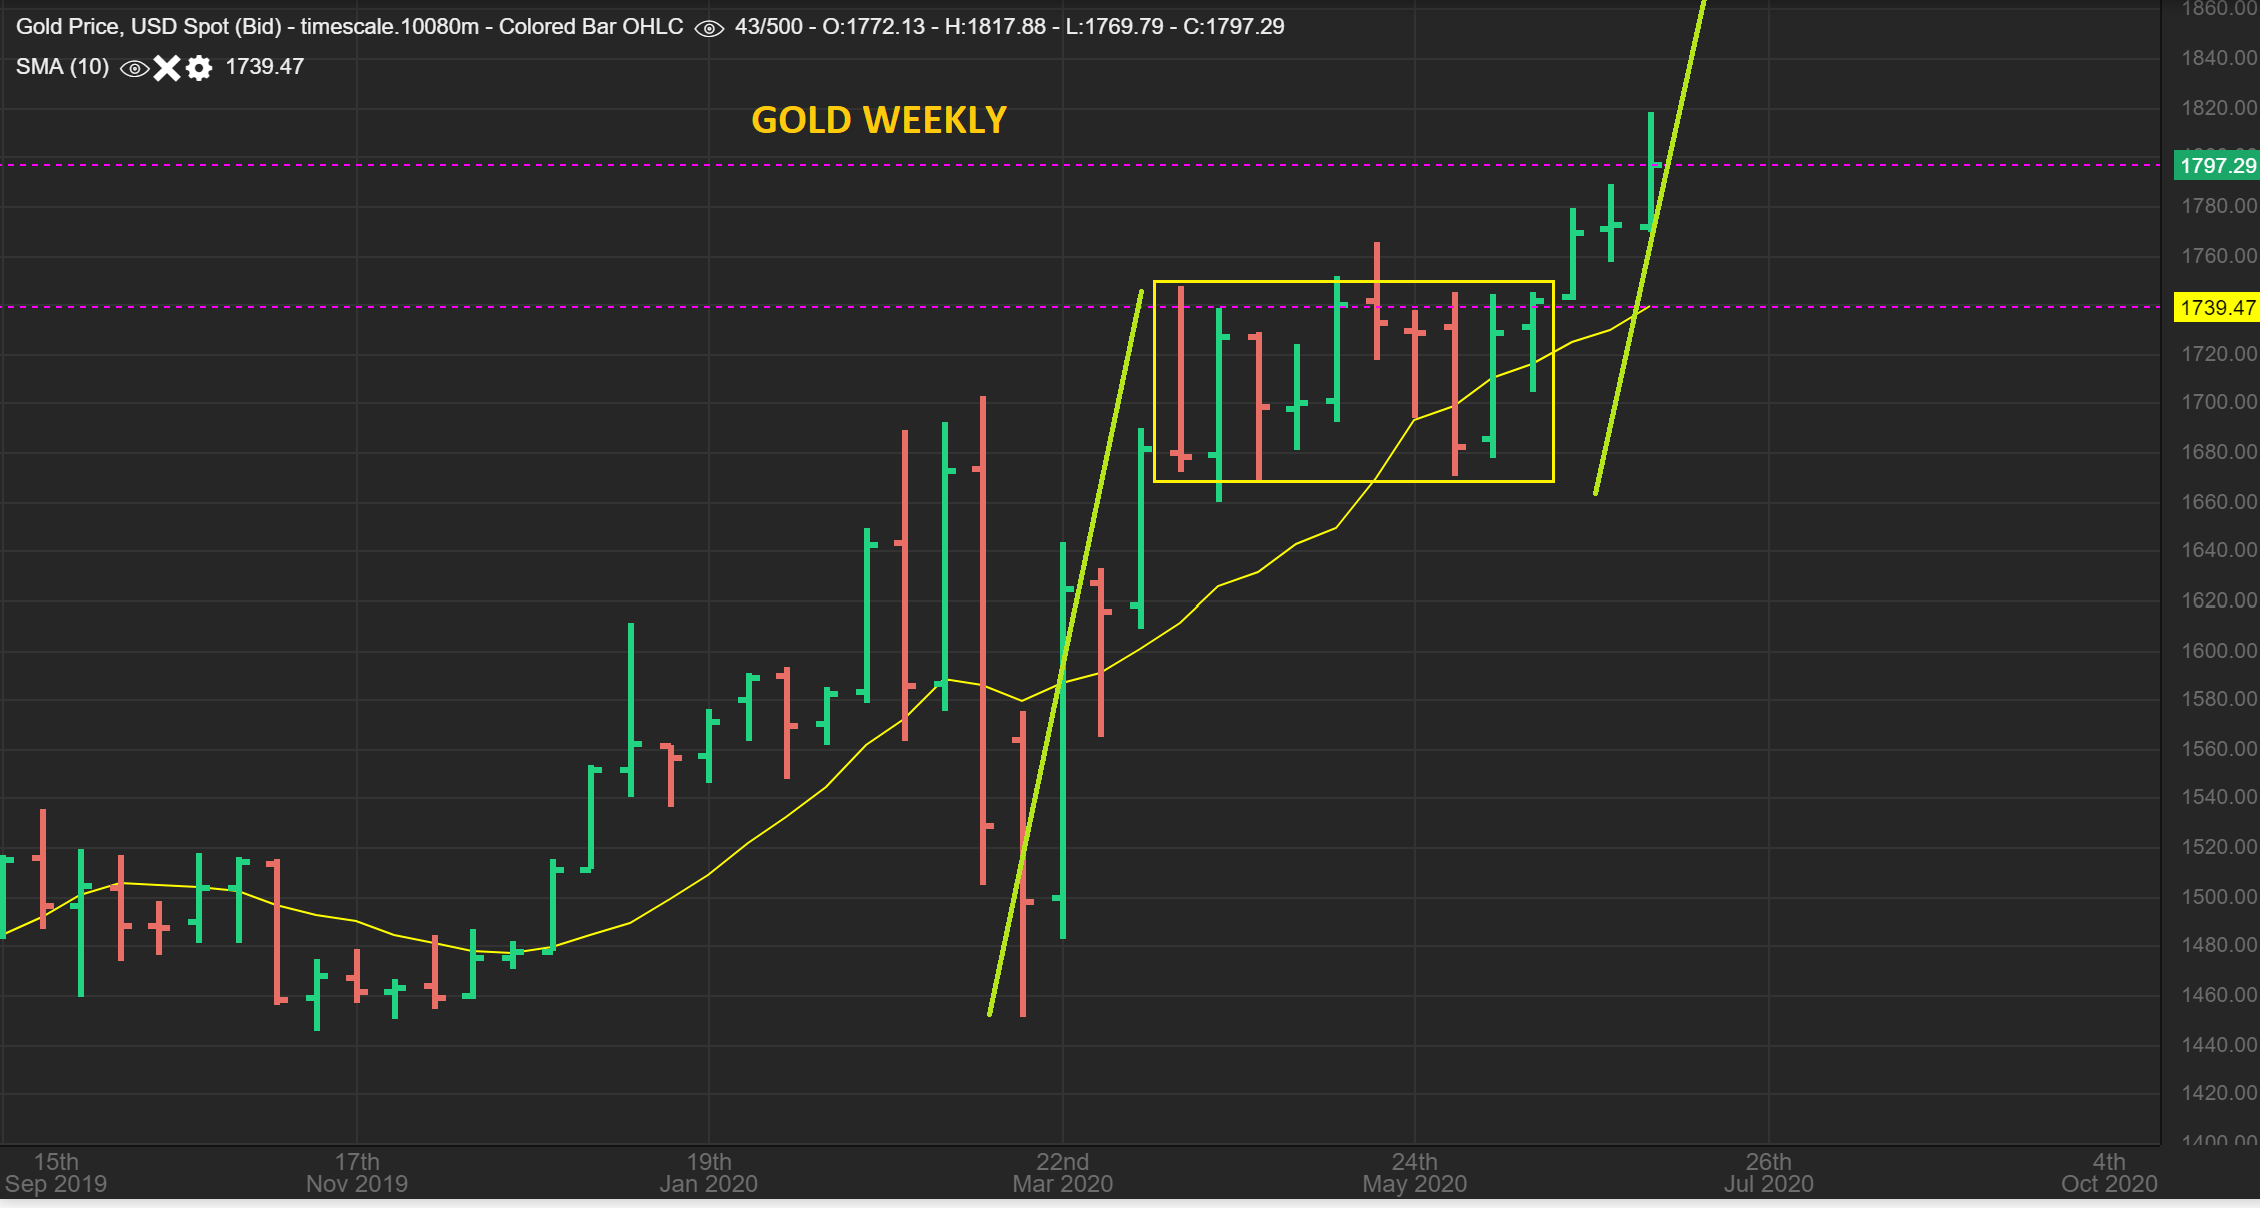
GOLD WEEKLY – So we broke from the Box Consolidation that I had been pointing out, and to be honest, a Measured move for this break out is MUCH Higher. I get roughly $1980 or so. That can happen with or without a daily cycle low in there, because this is a weekly chart.
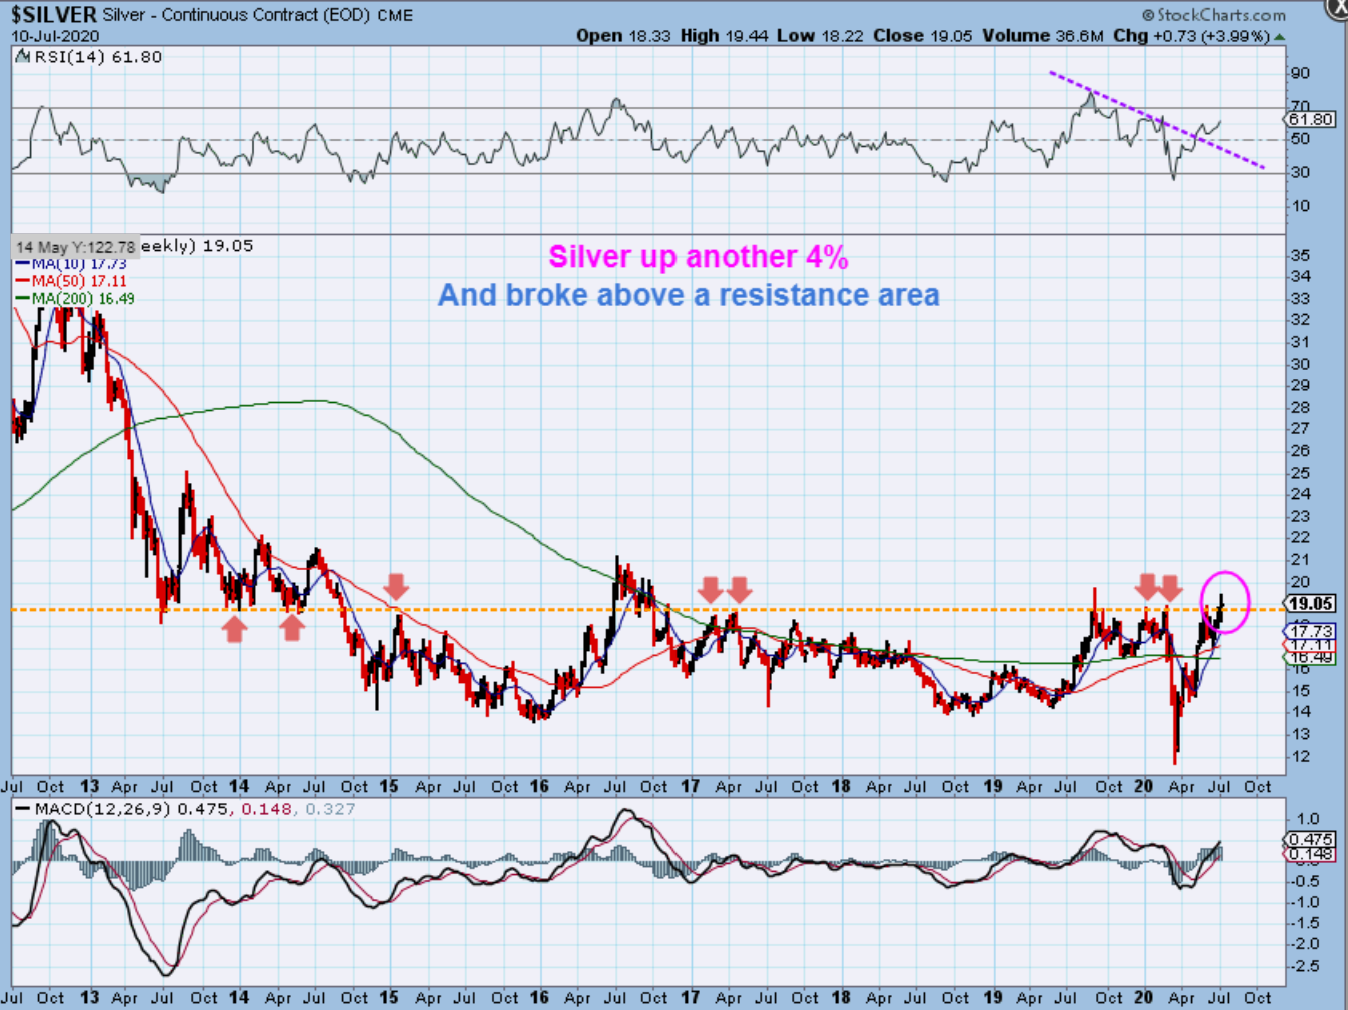
SILVER WEEKLY – Silver is trying to break out and volume is increasing. Silver was up another 4 % this week. I thought that THAT might surprise some of you.
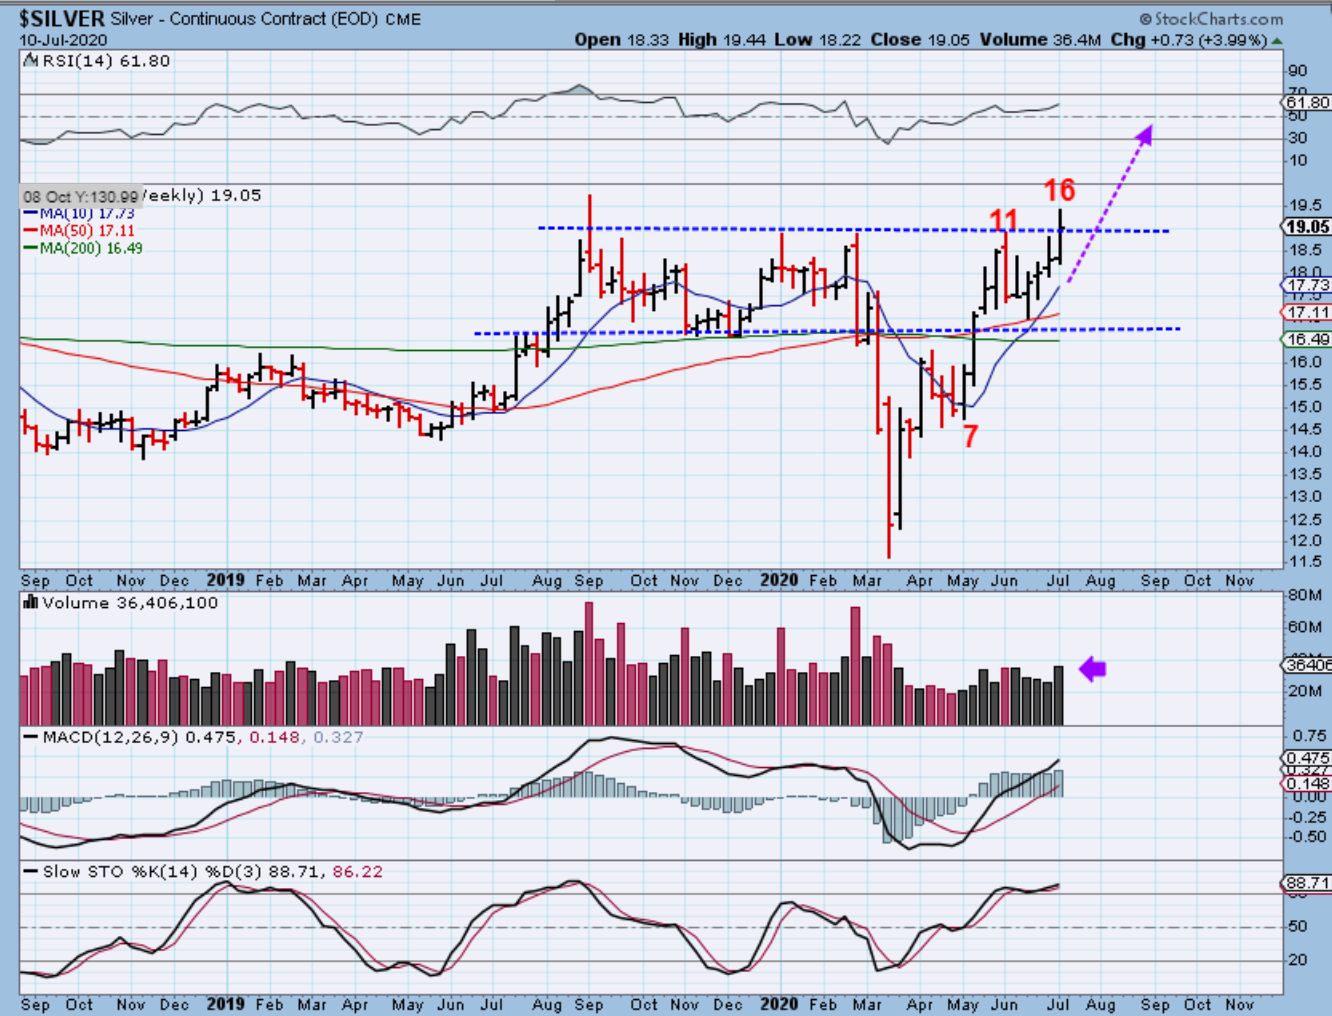
SILVER WEEKLY BIG PIC- So this is Silver trying to break from that big Base. We could get a small dip into a dcl and then a break out & rally , or this can just go higher. Let’s just say that the Big Picture remains very Bullish. That may not surprise you, but…
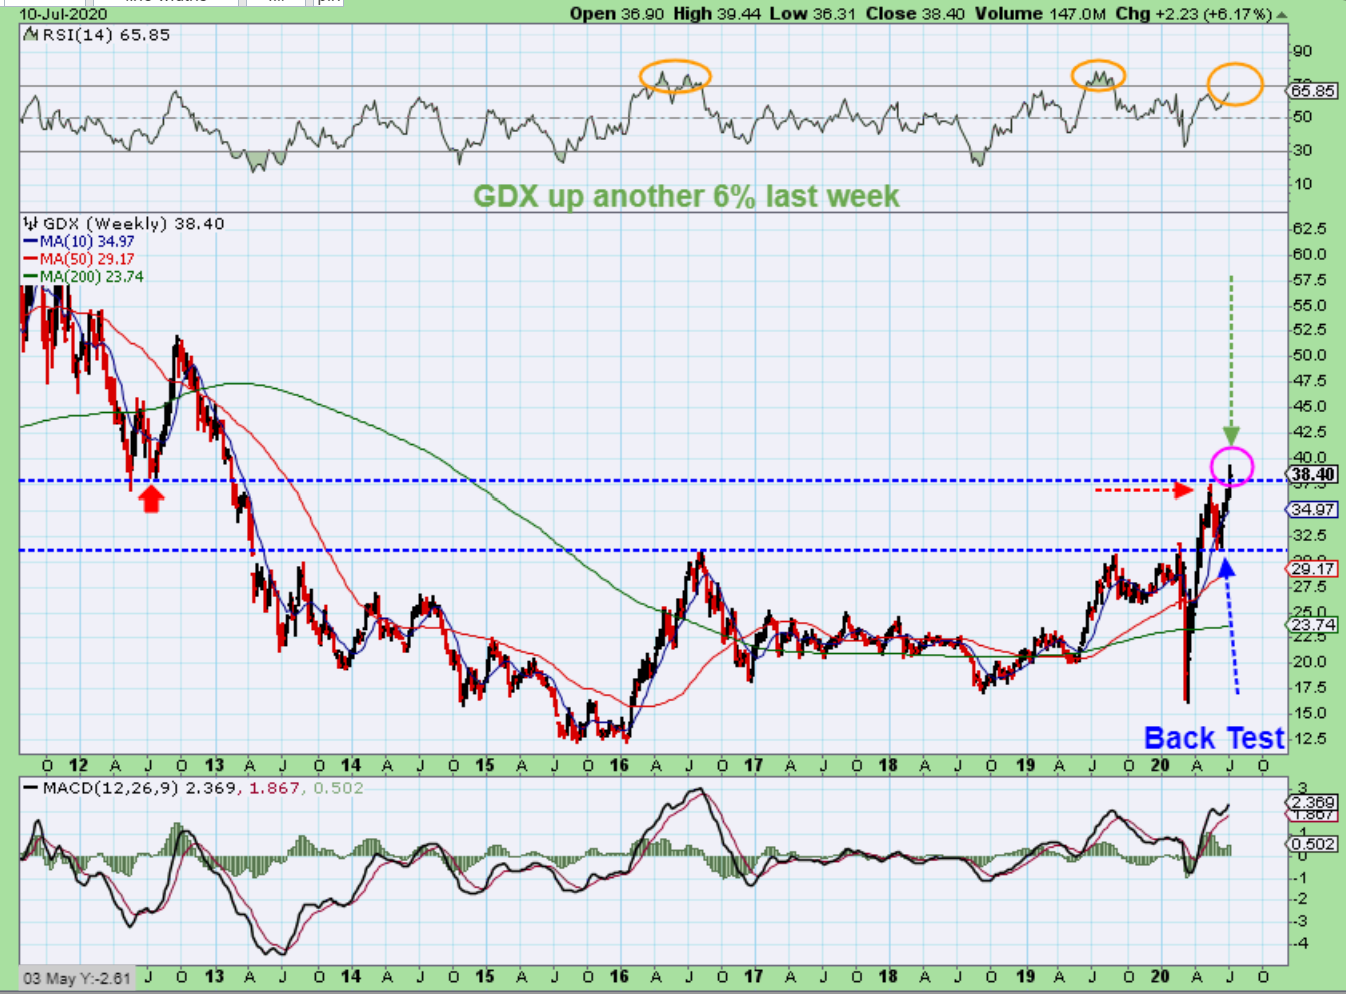
Did you know that GDX started to BREAK OUT AND GDX WAS UP ANOTHER 6.17%? It is up for the 4th straight week and has moved 12% in the last 2 weeks. THAT is part of what I thought might surprise you, but it gets even better….
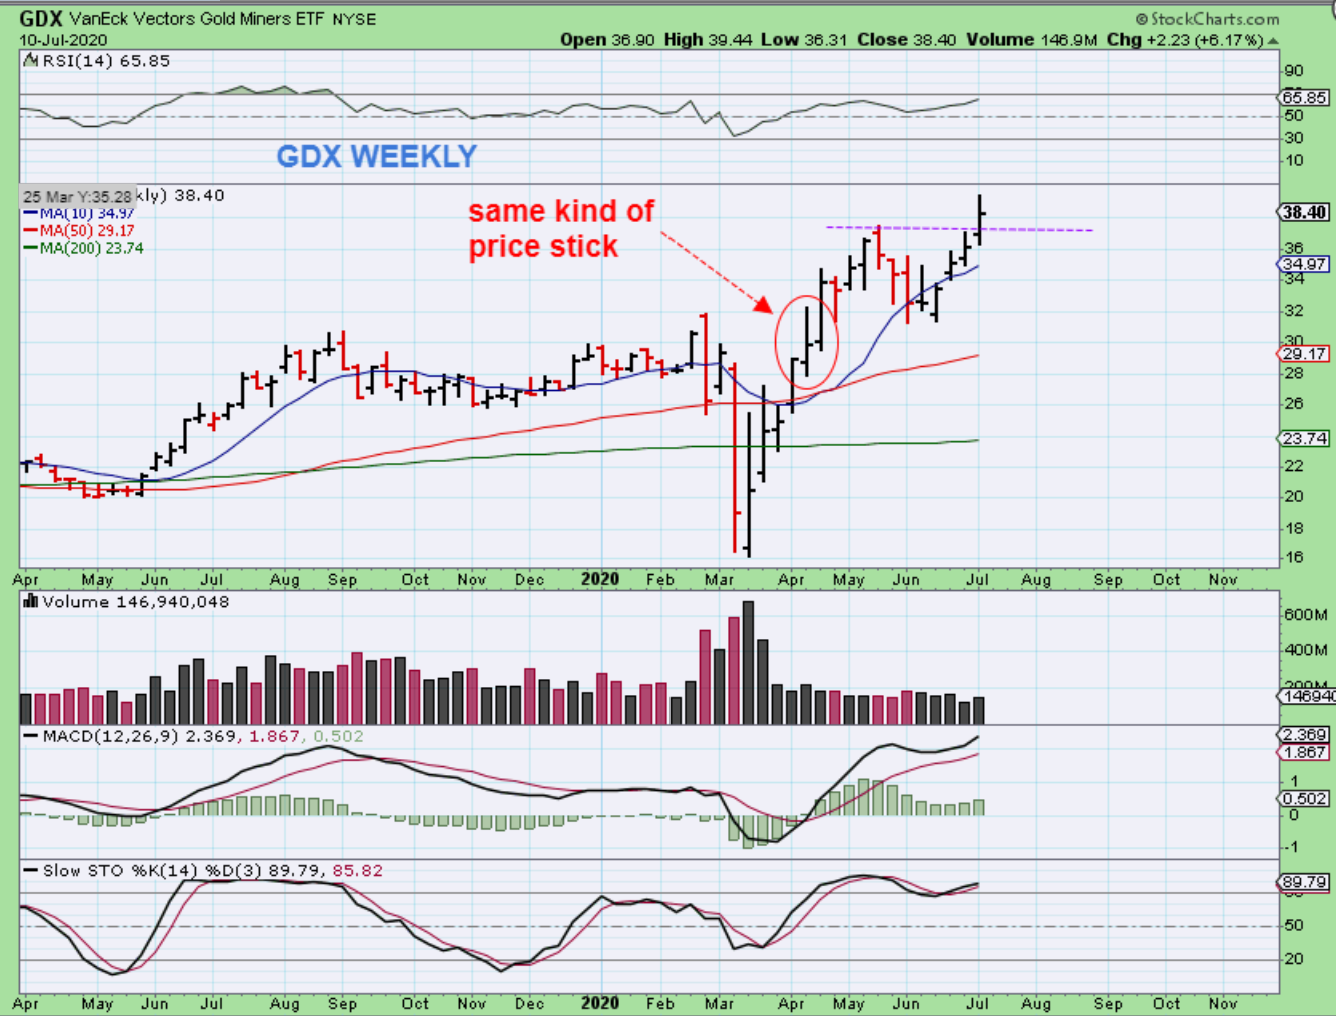
GDX started to break into that resistance zone after completing the back test that I pointed out a few weeks ago. This is nice progress as Miners simply continue higher.
.
THIS IS REALLY THE PART THAT I THOUGHT MIGHT SURPRISE YOU: Last week I said that I was not selling, but I would just use stops and let the price take me out of the trade if it broke down. Last week I did a LOT of research and pointed out that several CYCLES lasted for many weeks beyond what we currently had, so selling might not be the best thing to do. Well look at this…
.
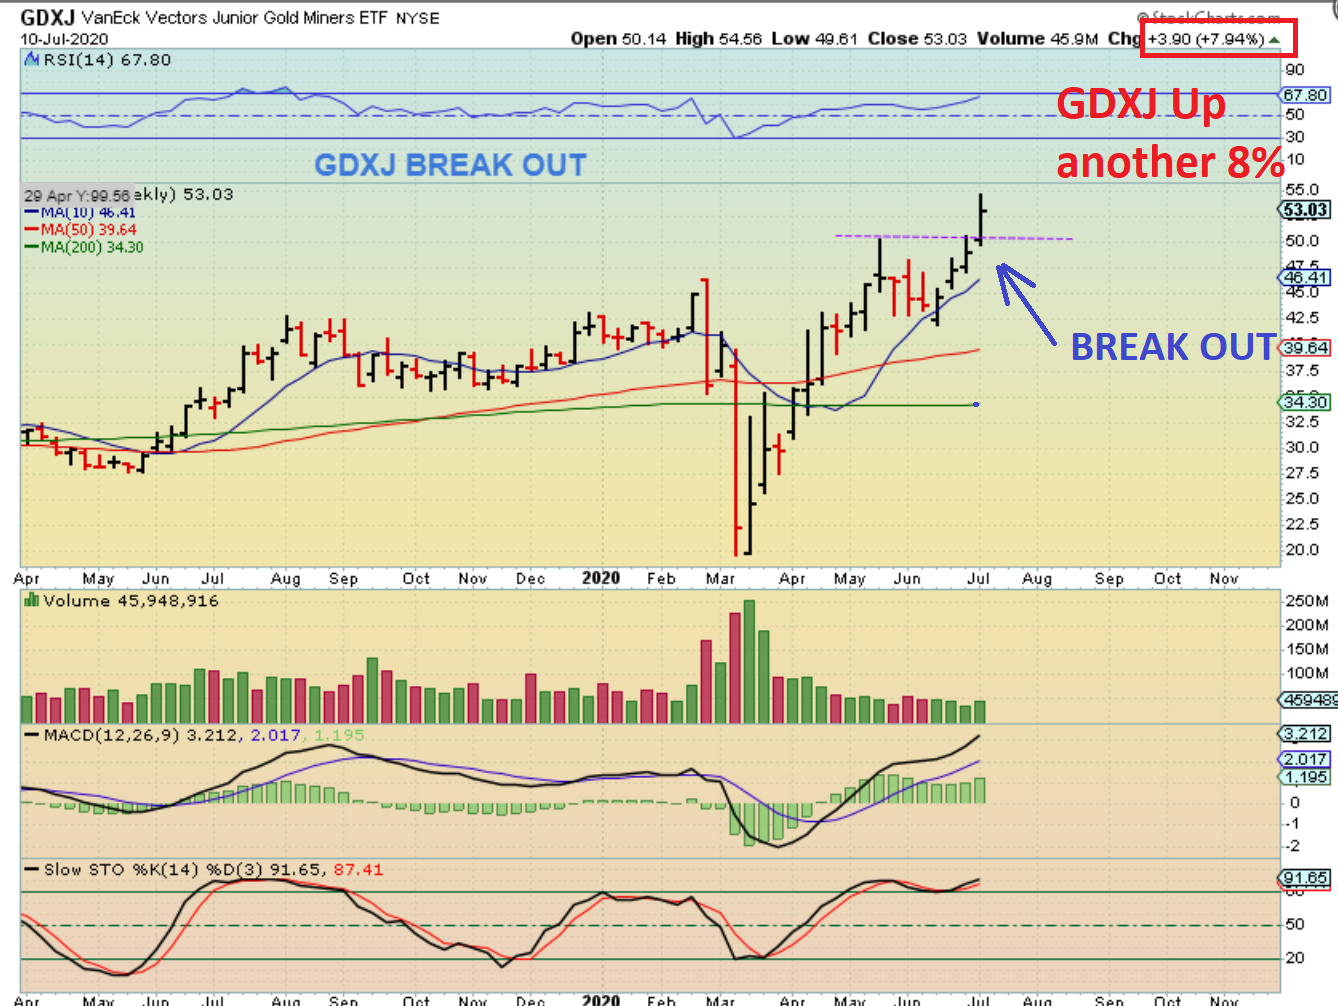
GDXJ WEEKLY – GDXJ closed up another 8%, that was over 16% for JNUG. This also shows that GDXJ broke out to new highs and held those gains. That can be Very Bullish…Is that surprising to you?
.
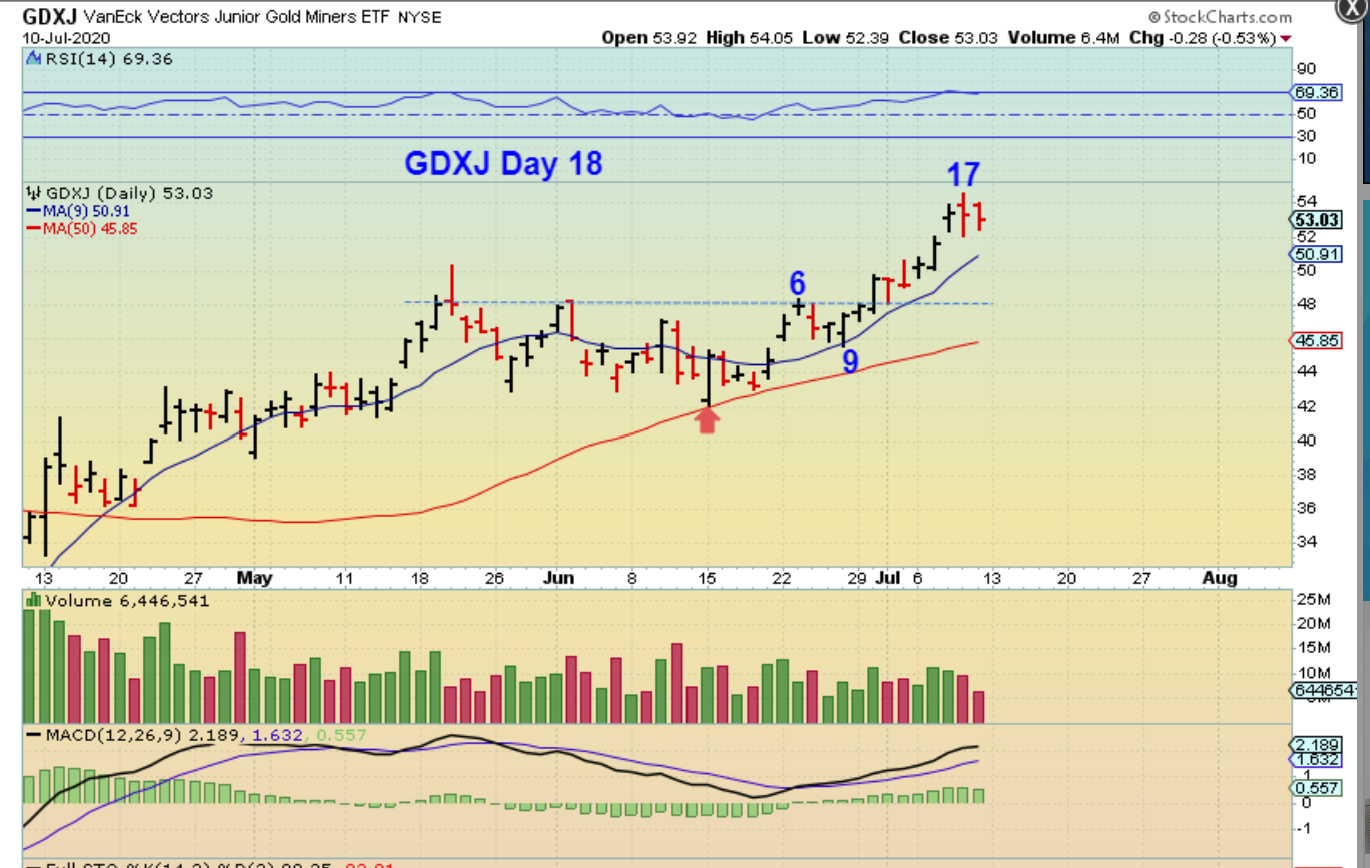
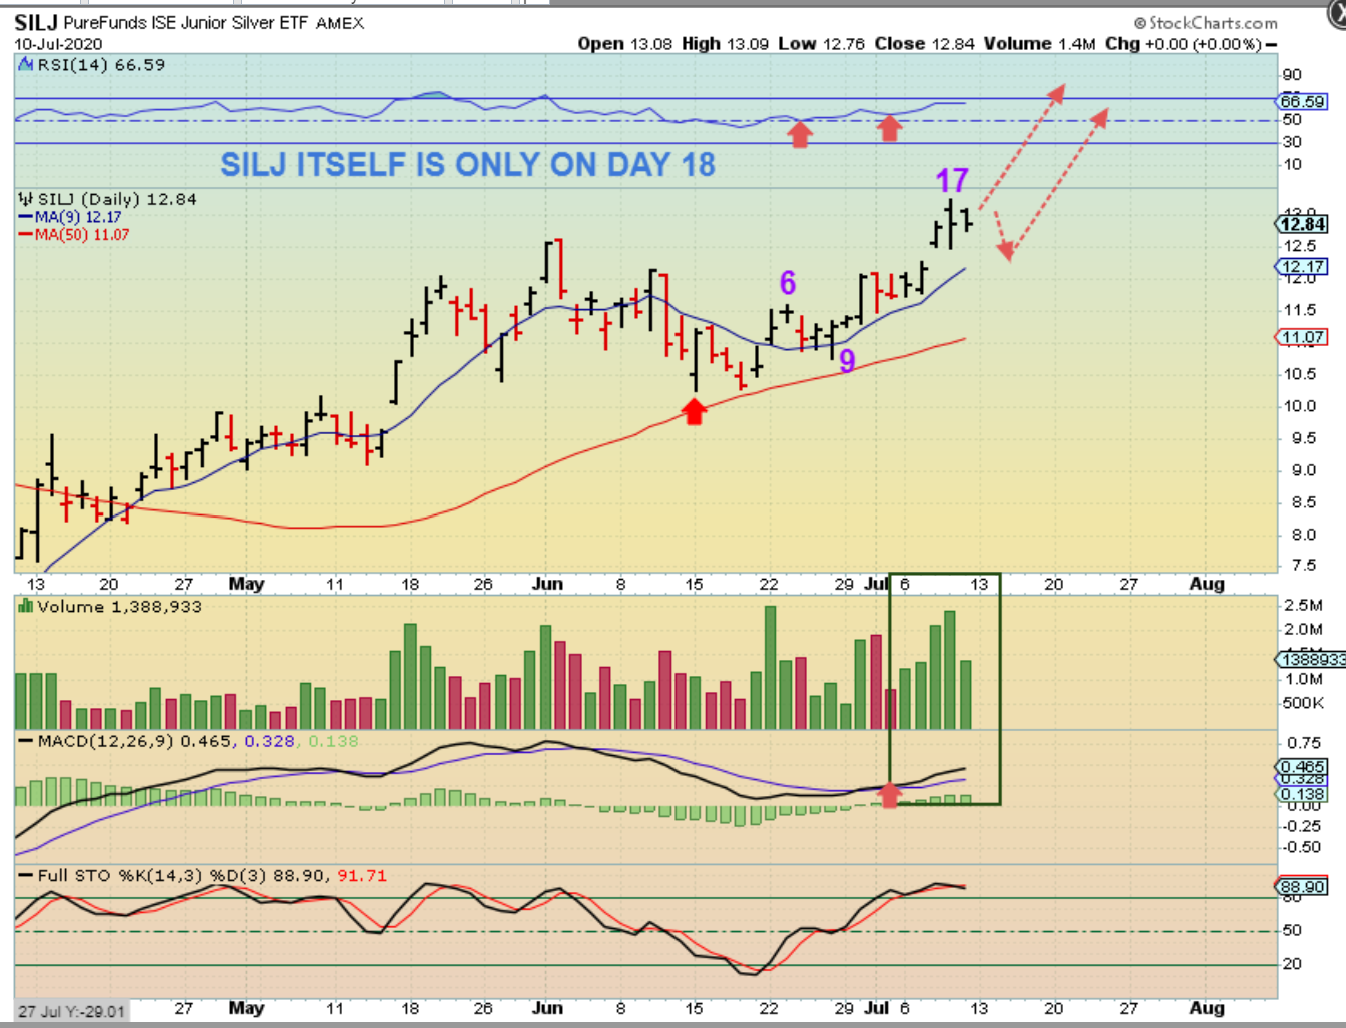
GDXJ DAILY – Counting the days off of the lows for GDXJ, we see that we are only at day 18, and the avg run can be 32 days long. This could be a bull flag…
.
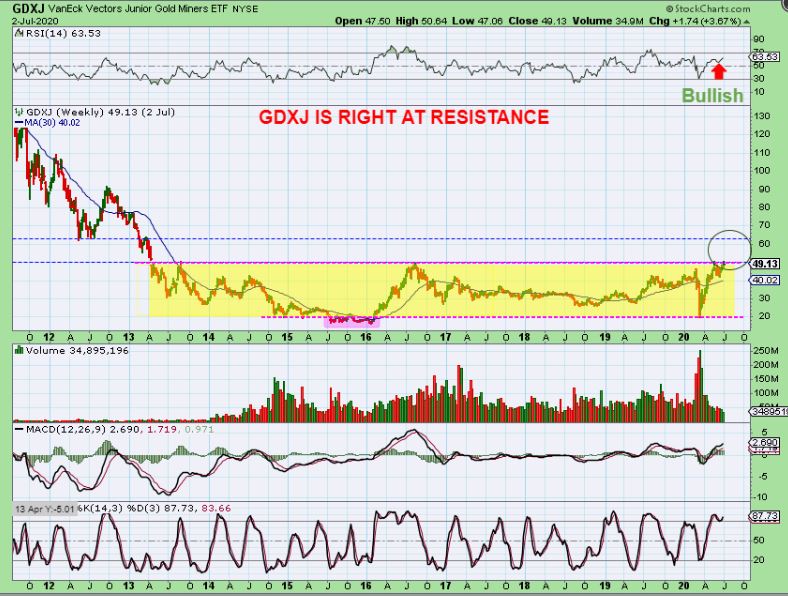
GDXJ WEEKLY FROM LAST WEEKEND REPORT- I Said that this is a bullish set up, at the point that we could see a break out.
.
GDXJ WEEKLY – We did have a break out. I think that THAT might surprise many people. I have pointed out the base in all of my past reports and now we have a break out into the open space between roughly $50 & $63.
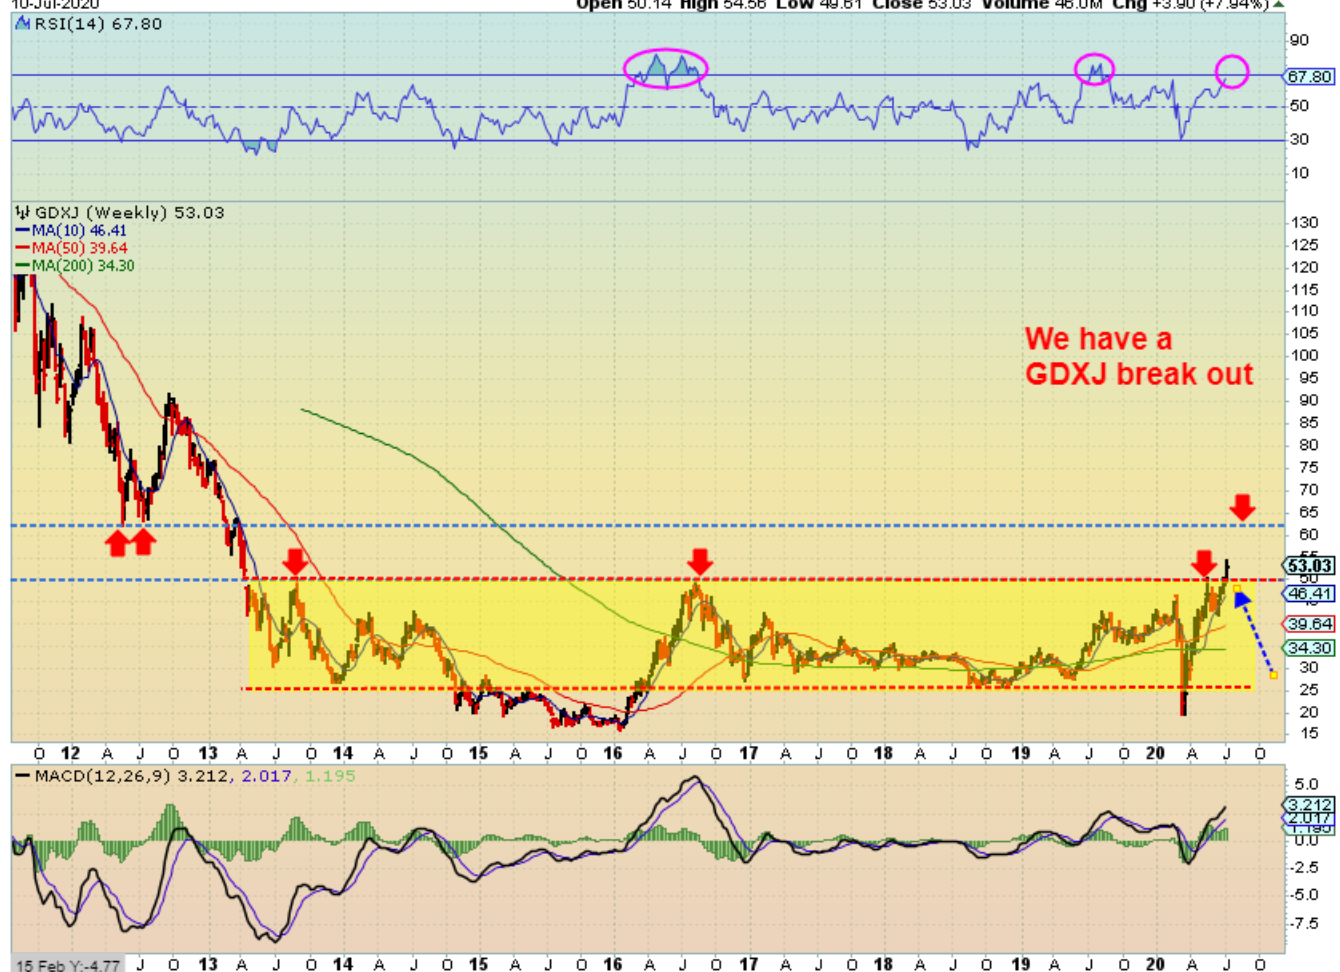
GDXJ WEEKLY SAME CHART – In the past I said that a break out here should lead price from $50 & $63.
1. We COULD get a dcl that back tests this break out, and then the next daily cycle can run right to the next resistance area. Or…
2. We COULD see this melt up to $63 and then do a back test dcl.
.
I THINK THAT THIS WILL SURPRISE MANY TOO
.
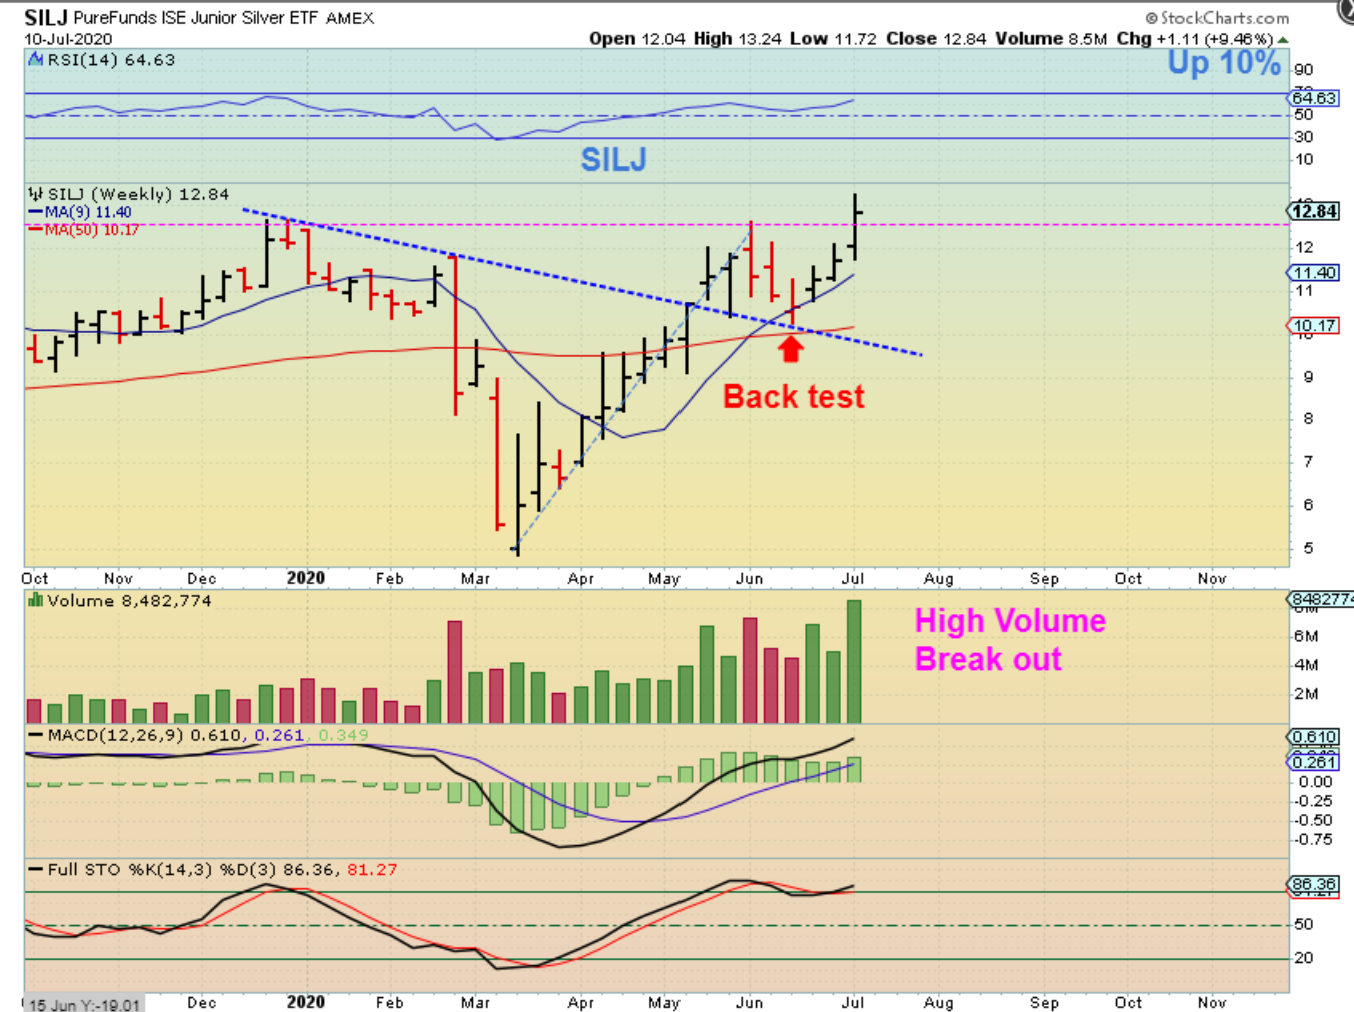
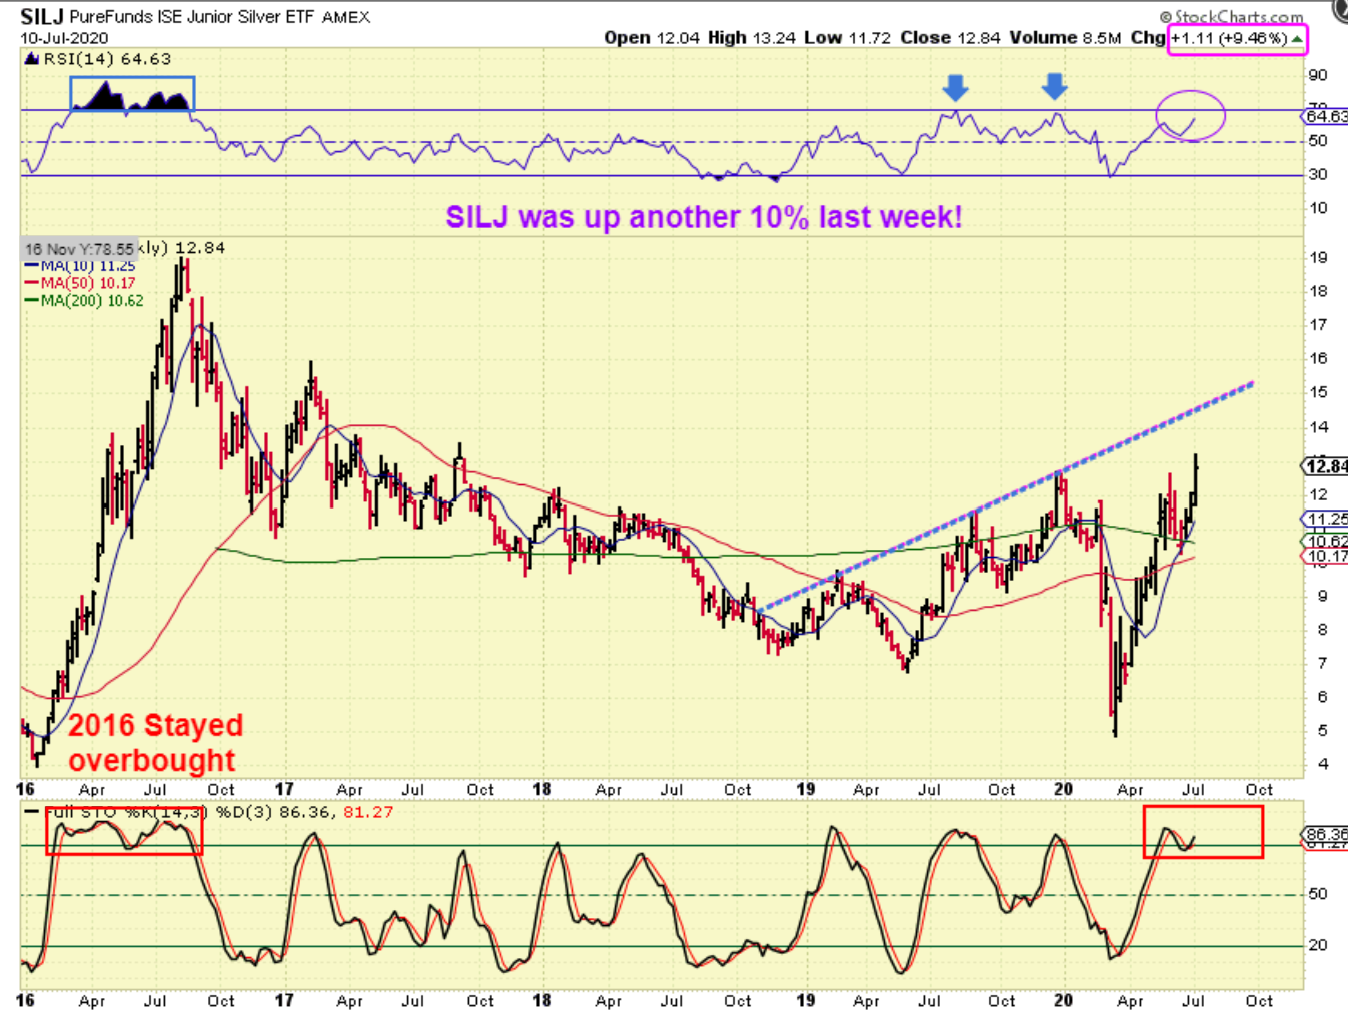
SILJ WEEKLY – Did you know that SILJ Broke out too, and SILJ was up 10% last week? WOW, another 10%. Volume was Big and that was very Bullish. And then I noticed that…
.
SILJ DAILY – SILJ itself is a higher volume break out that is only on day 18 also , so couldn’t it run higher until ( Let’s say) Day 27? It can. That is 10 more days or 2 weeks of trading. And…
.
SILJ WEEKLY -Look at the stochastics and the upper trend line. The stochastics can stay overbought like in 2016 as this runs to the upper trend line. 2 more 10% weeks would put SILJ at the upper trend line. This may continue the melt up.
.
**THIS WAS IN LAST WEEKENDS REPORT: Lengths of ICL to ICL
.
POST 2008 CRASH –
1. The 1st Intermediate Cycle peaked week 17 & bottomed on week 24.
2. The 2nd IC peaked week 34, bottom on week 43. (We are on week 15).
3. The 3rd IC Peaked 20 of 25
4. Next a Peak 22 of 26
5. Peak parabolic week peaked 32 of 35.
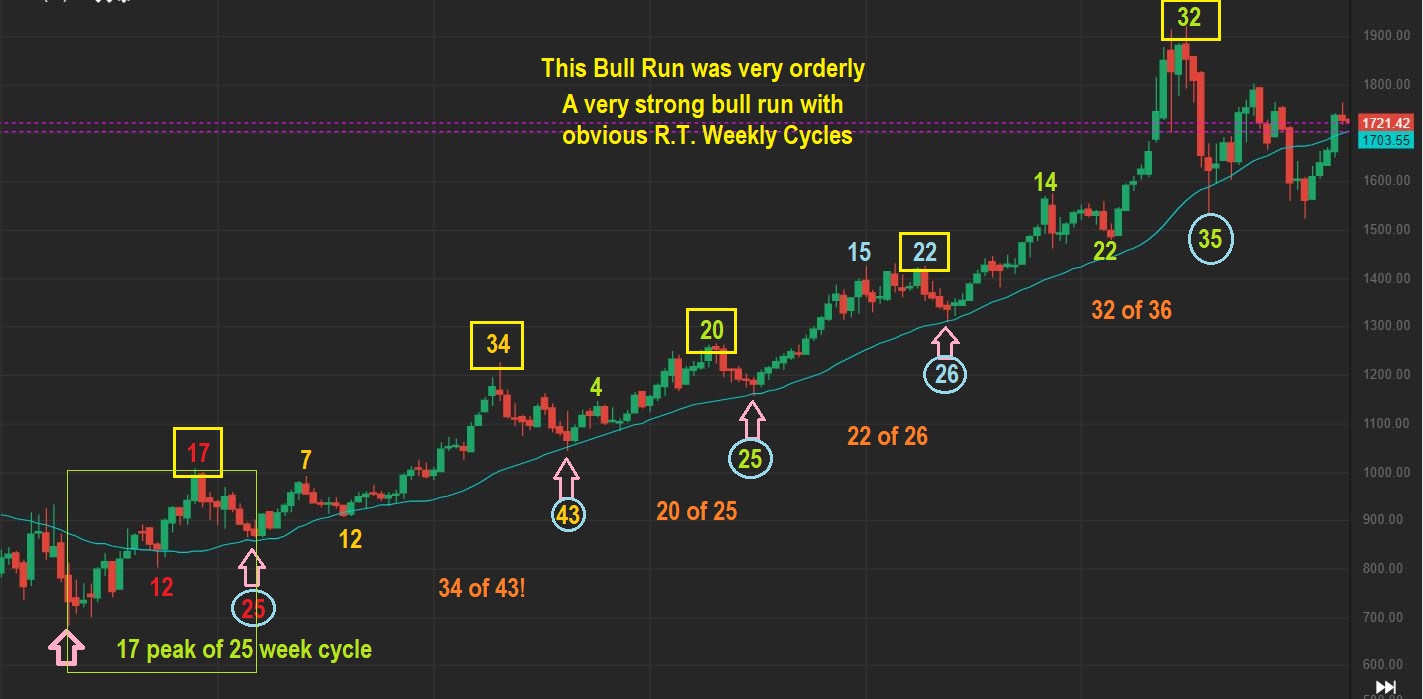
Again, we are on week 15, (EDIT, now week 16) with Gold breaking out from a Box consolidation. Look at that 2008 – 2011 run again. Several of those runs above peaked after week 20. In a Gold Bull using cycles, we could have a few more weeks of upside with an ICL due on avg 6-7 months after March ICL. If we just Stay Frosty and use stops, we should be just fine.
..
So my advice then was to be alert, stay frosty, and use stops just in case we drop. If it continues higher, you are still in the trade making gains. SILJ up another 10% is a win.
After reviewing the charts, seeing last weeks break outs and additional gains was a little surprising , wasn’t it? I knew that GDXJ & SILJ made new highs and did good last week, I had that in mid-weak reports, but until I pulled up those weekly charts? I didn’t realize just how bullish the action was and how Bullish the Big Picture charts appear to still be. Both GDXJ & SILJ broke out to new highs, had increasing volume, and can continue higher with or without a dcl in between. The count off of the lows for GDXJ & SILJ seems to be about 1/2 way through the average length of a daily cycle, but Gold itself could be due for a dcl soon. So far the 10sma has held price. I look forward to next weeks price action.
.
Enjoy your weekend, and I really do appreciate you all being here at Chartfreak with me!
.
~ALEX
.
Progress report / Update:
.
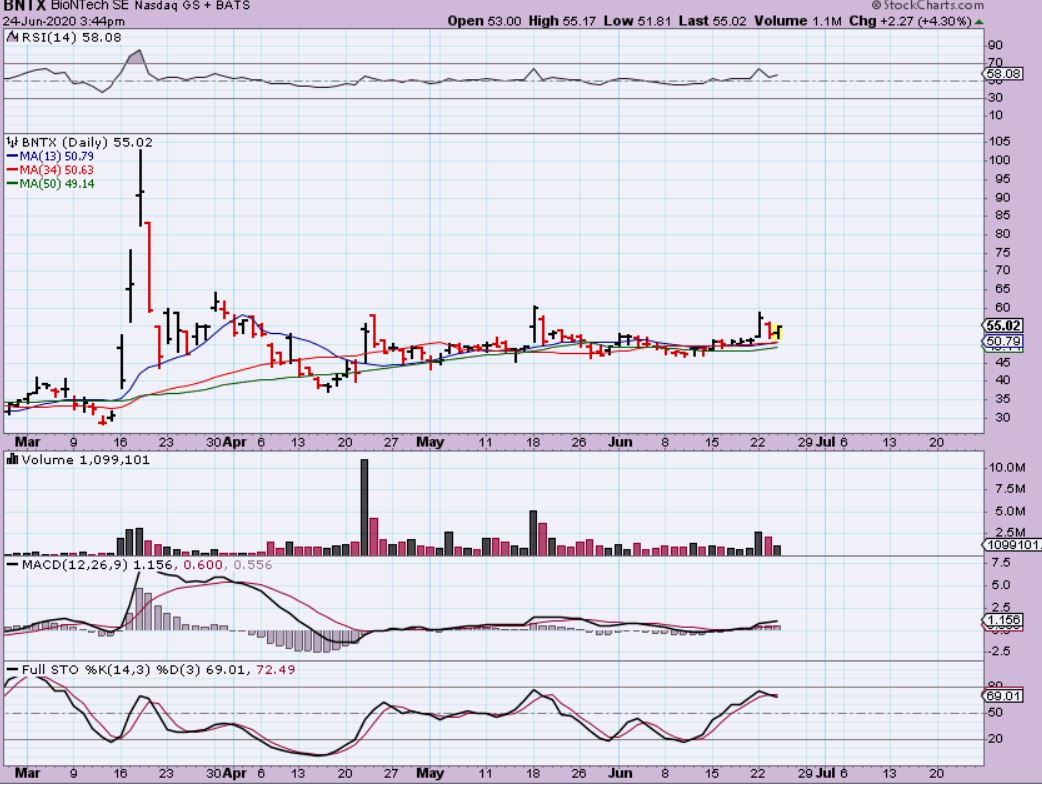
BNTX JUNE 24 – I mentioned that this is a buy and that I bought it. This sector has been hot and even heating up more and more. This was on Support in the $50 area and could run to $100 (Former highs) .
.
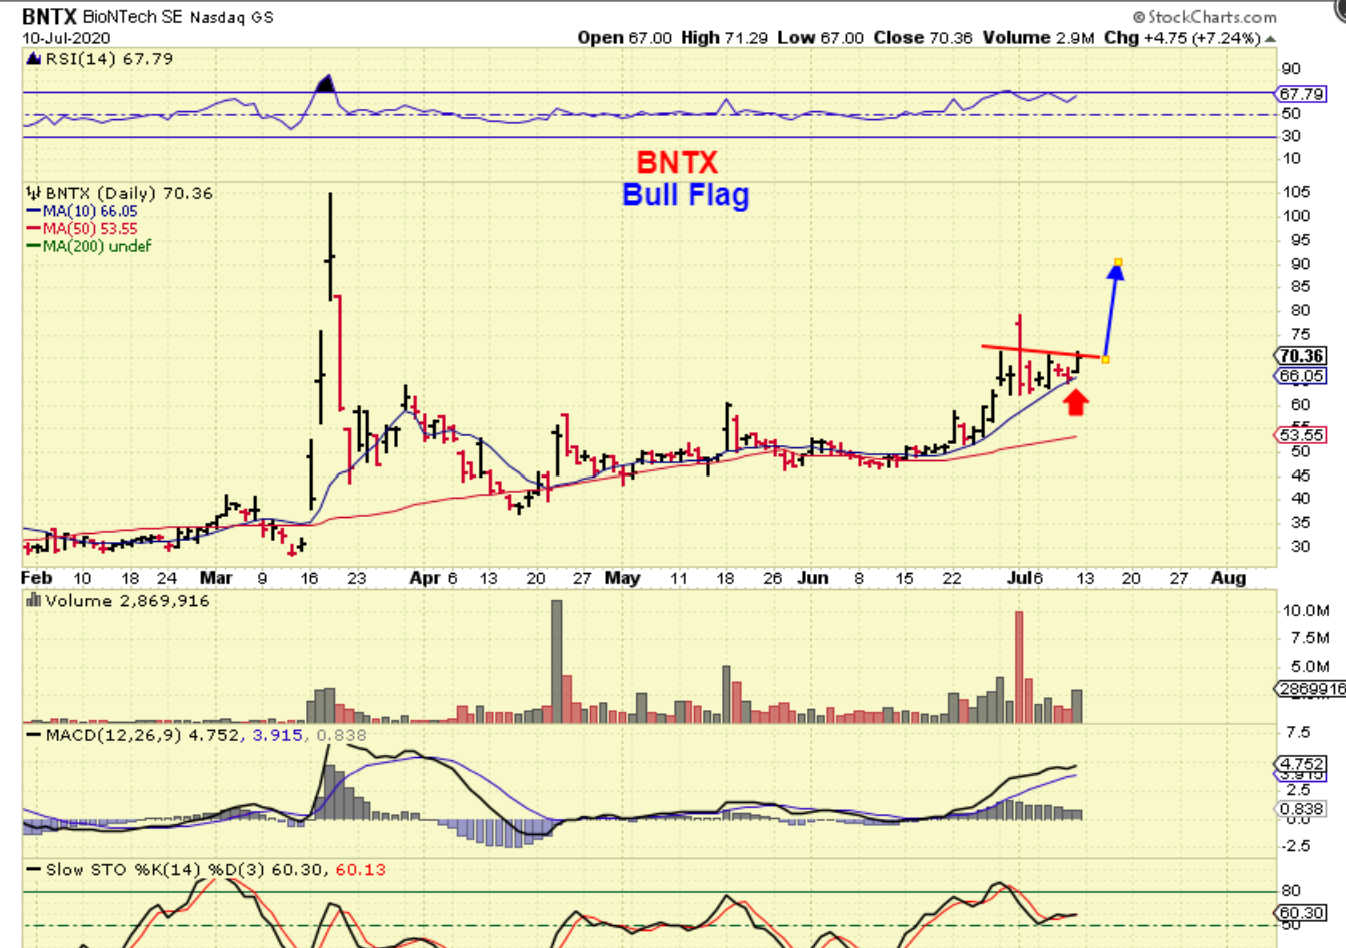
BNTX – ran higher and has Bull flagged over to the 10sma. I think that this was a buy or a good place to add. And guess what?…
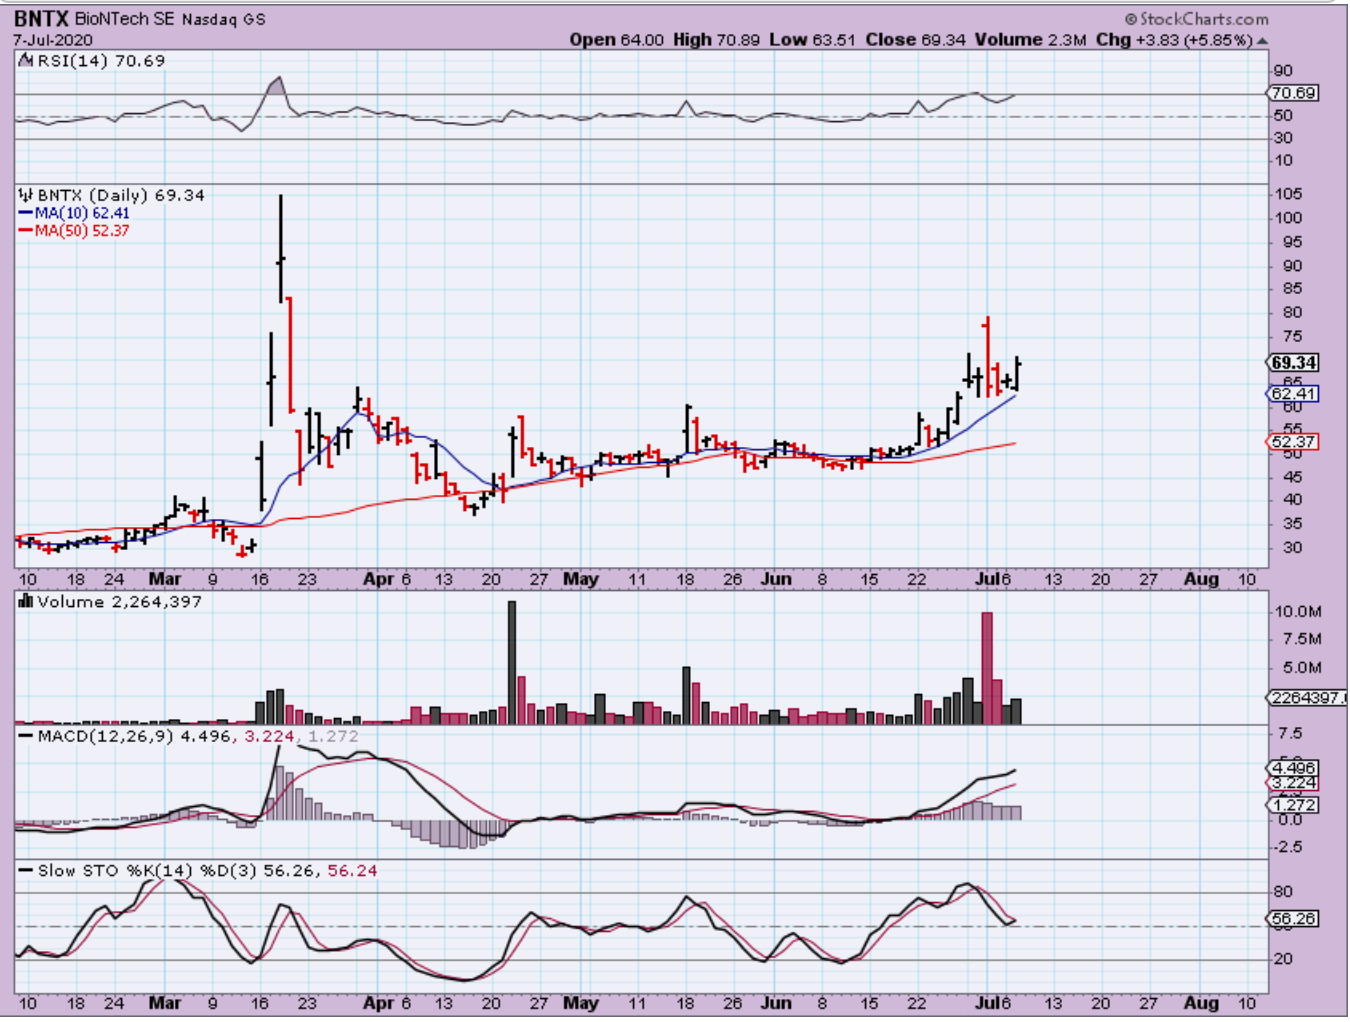
BNTX – it churned sideways for 2 more days and THIS IS STILL a Buy or a good place to add. I added.
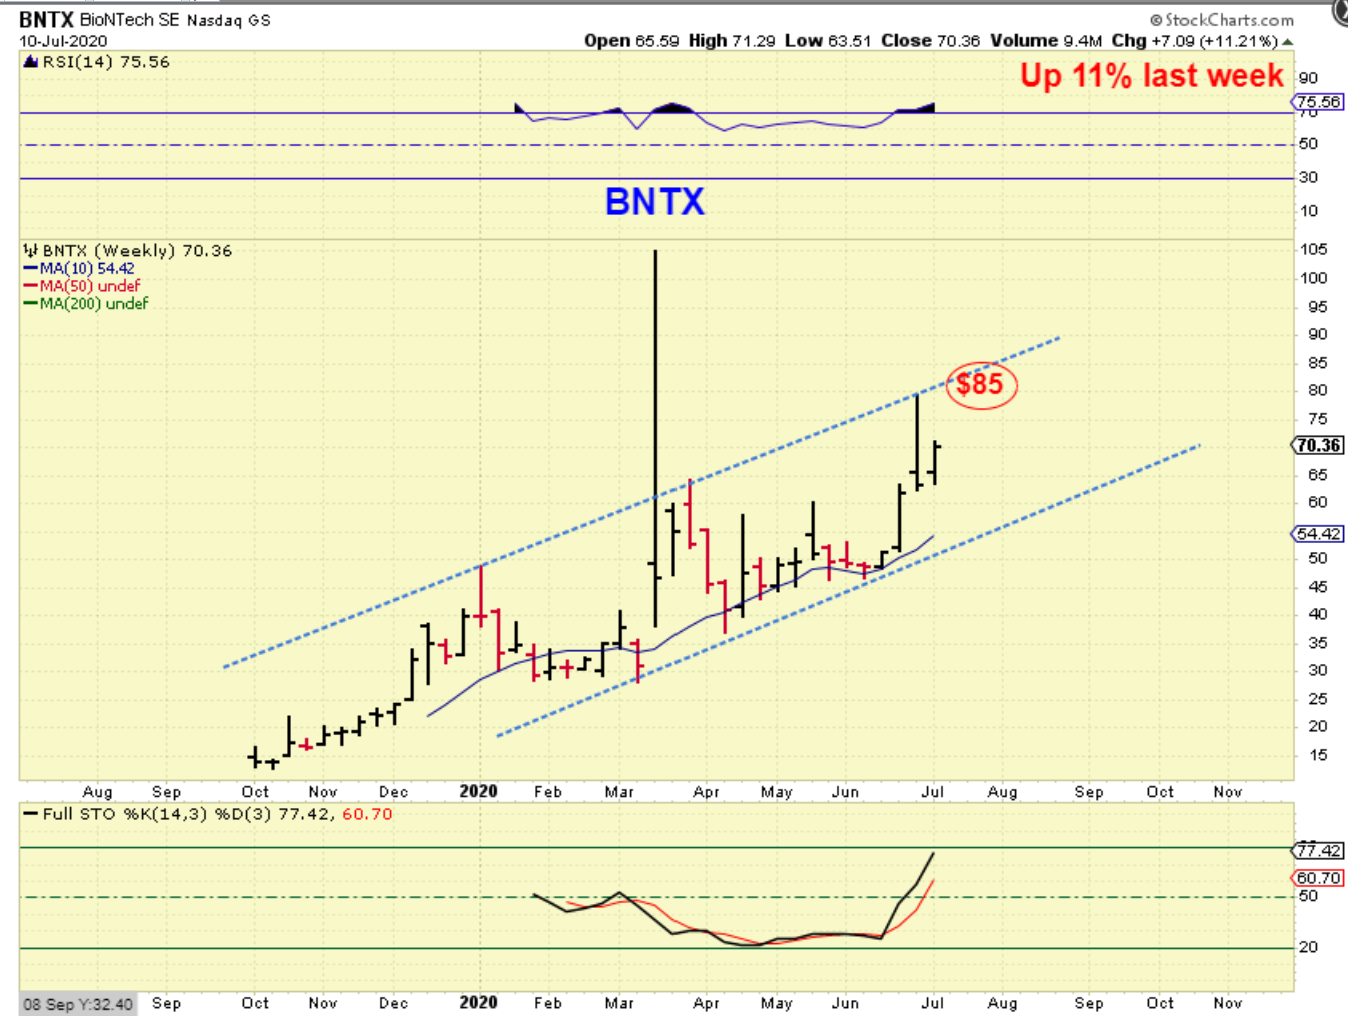
BNTX WKLY – Using an upper trend line we see a target around $85, but price can also get there and climb up along that area or just break right through too.
.
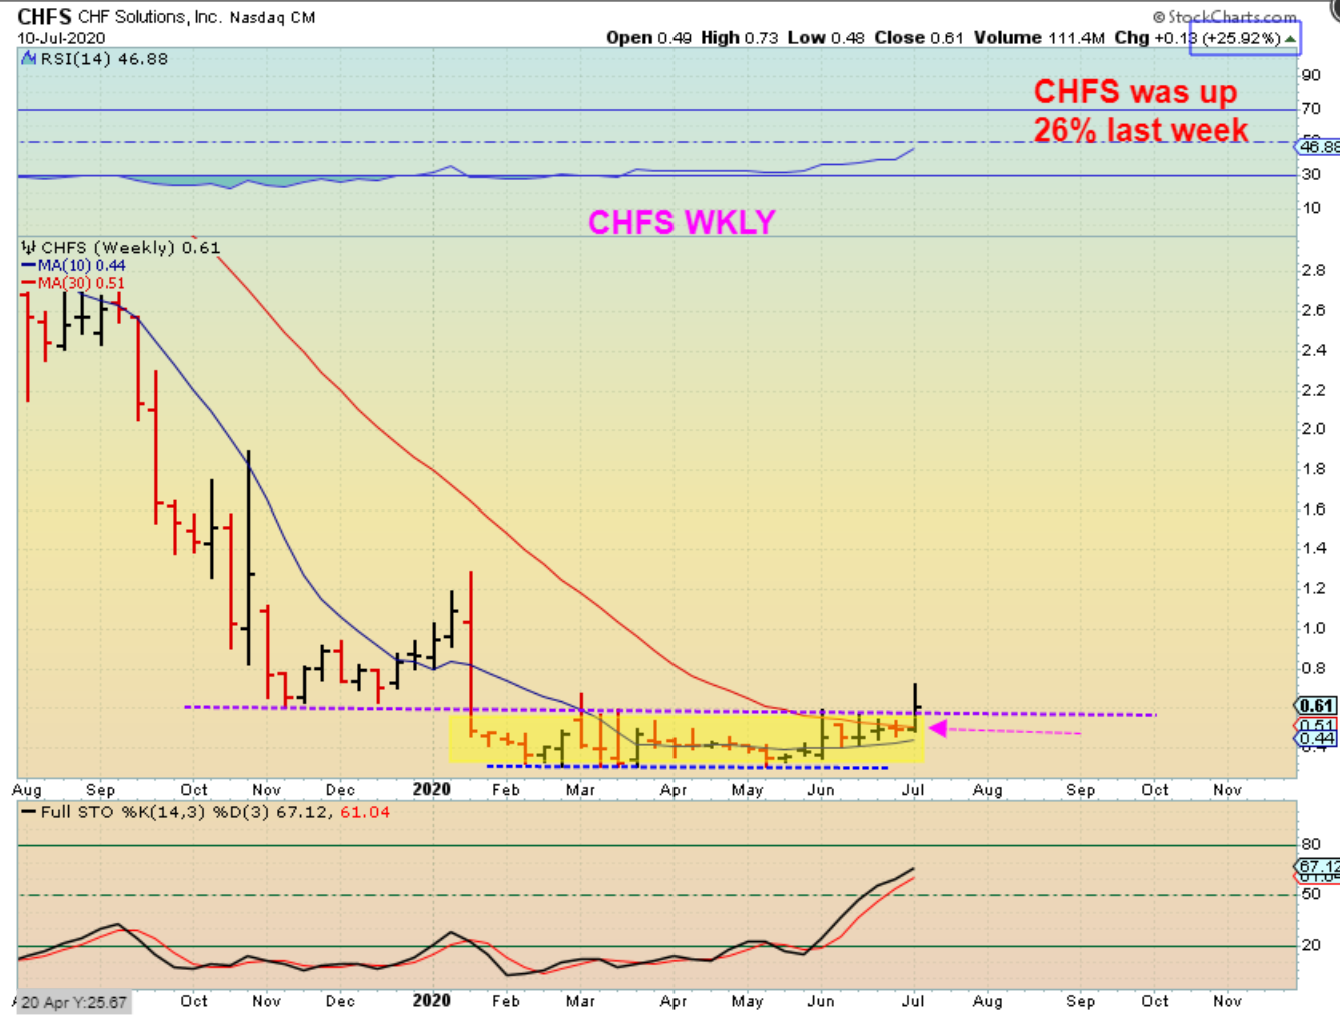
FROM LAST WEEKENDS REPORT: CHFS BASE – A very tight base and volume pops here too, with news of COVID patient care.

LAST WEEKKEND I SAID ABOUT THE CHFS BASE – A very tight base and volume pops here too, so I simply put 5% of my account in it and wait. It worked on VISL, NAKD, BNED, and others. This and CHEK are by far the best looking bases . I think that any positive news release will pop this , because it looks to be under accumulation to me, NO GUARANTEE, but I like the investment.
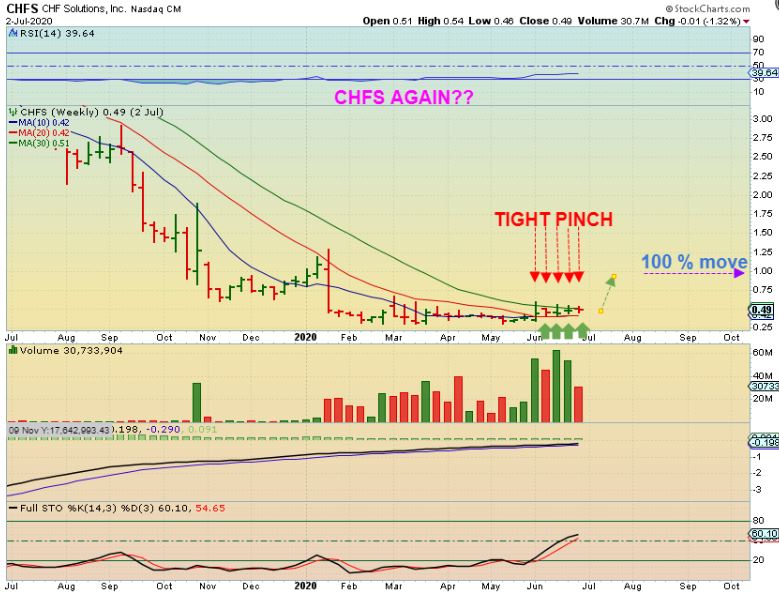
CHFS WEEKLY – CHFS was up 26% this week and we did FINALLY get out break out. You can just use this as buy & Hold now, or sell the next pop. Sell 1/2 & ride the rest? It’s up to you, but we are up 25% last week alone, and many of us bought this even lower than last week.
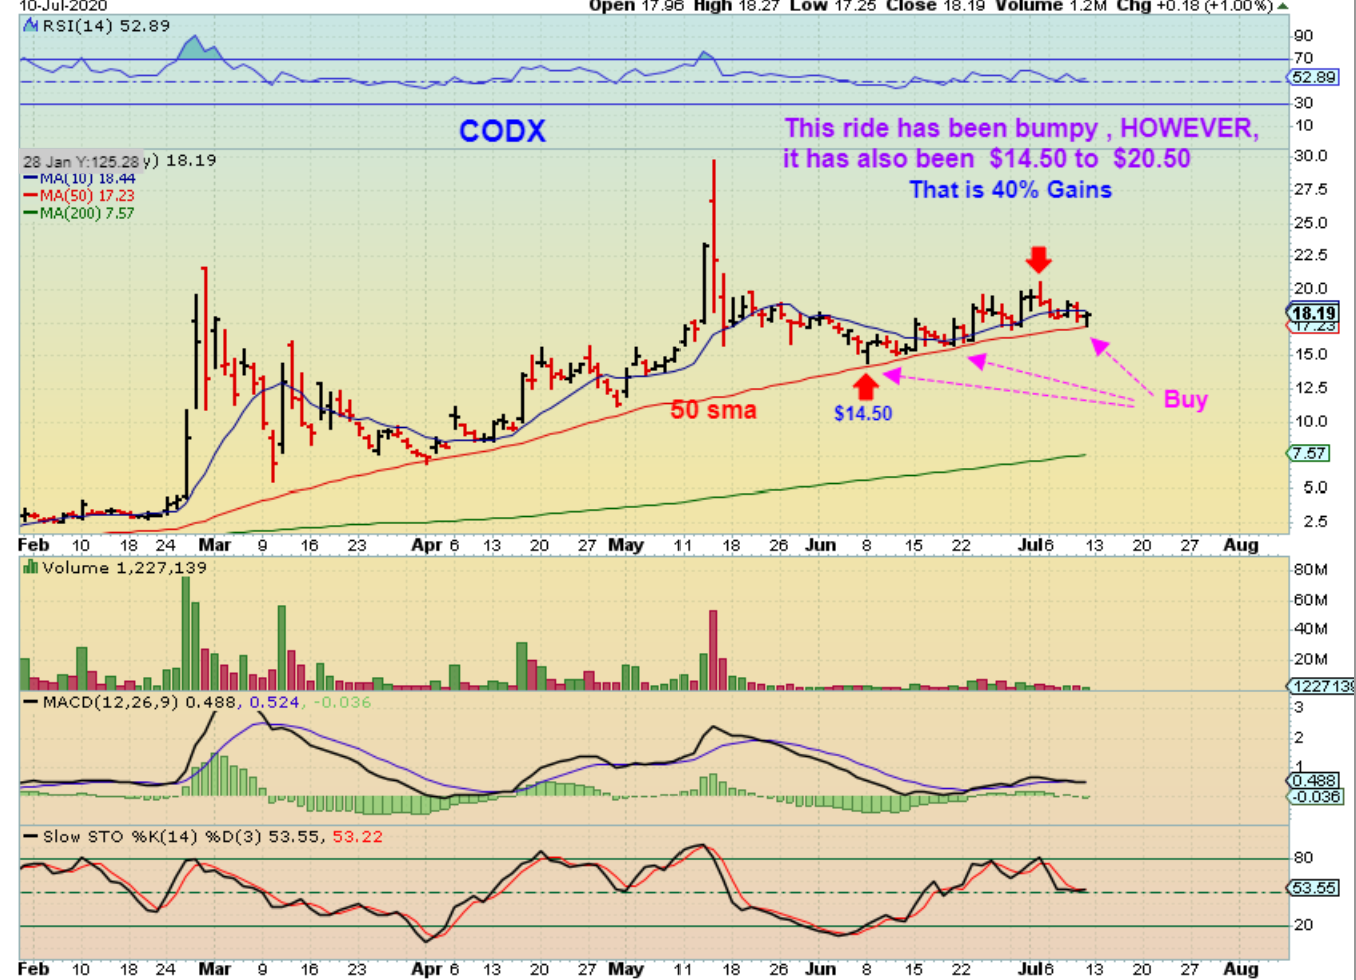
CODX was a buy at $17 as it climbed the 50sma. I want to show you something about CODX…
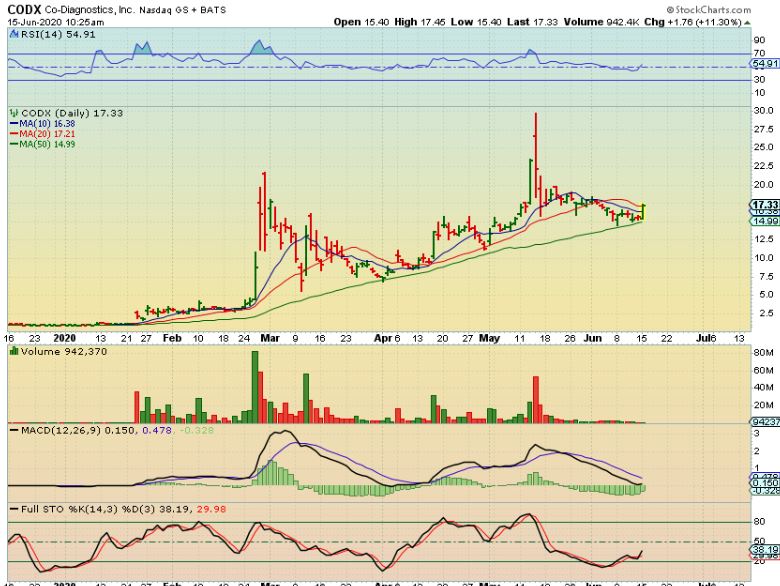
CODX has Popped, drifted to the 50sma. Popped & drifted to the 50 sma. Popped & drifted to the 50sma. It looks like a rough rie buy & Hold, but so far it went from that $14.50 to $20.50. It is now a buy again as it reverses off of that 50sma. Sell the pops or let it ride, that is up to you.
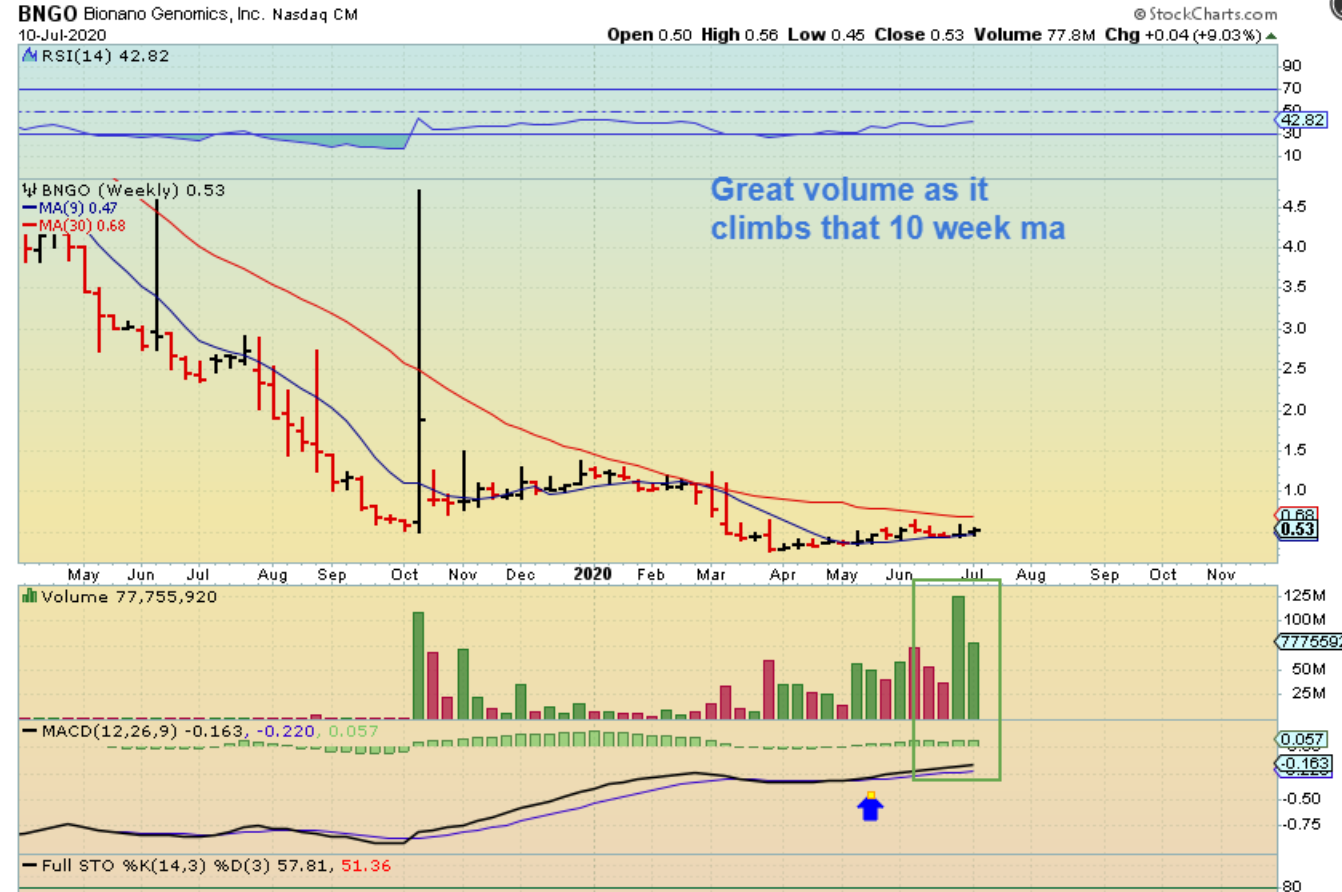
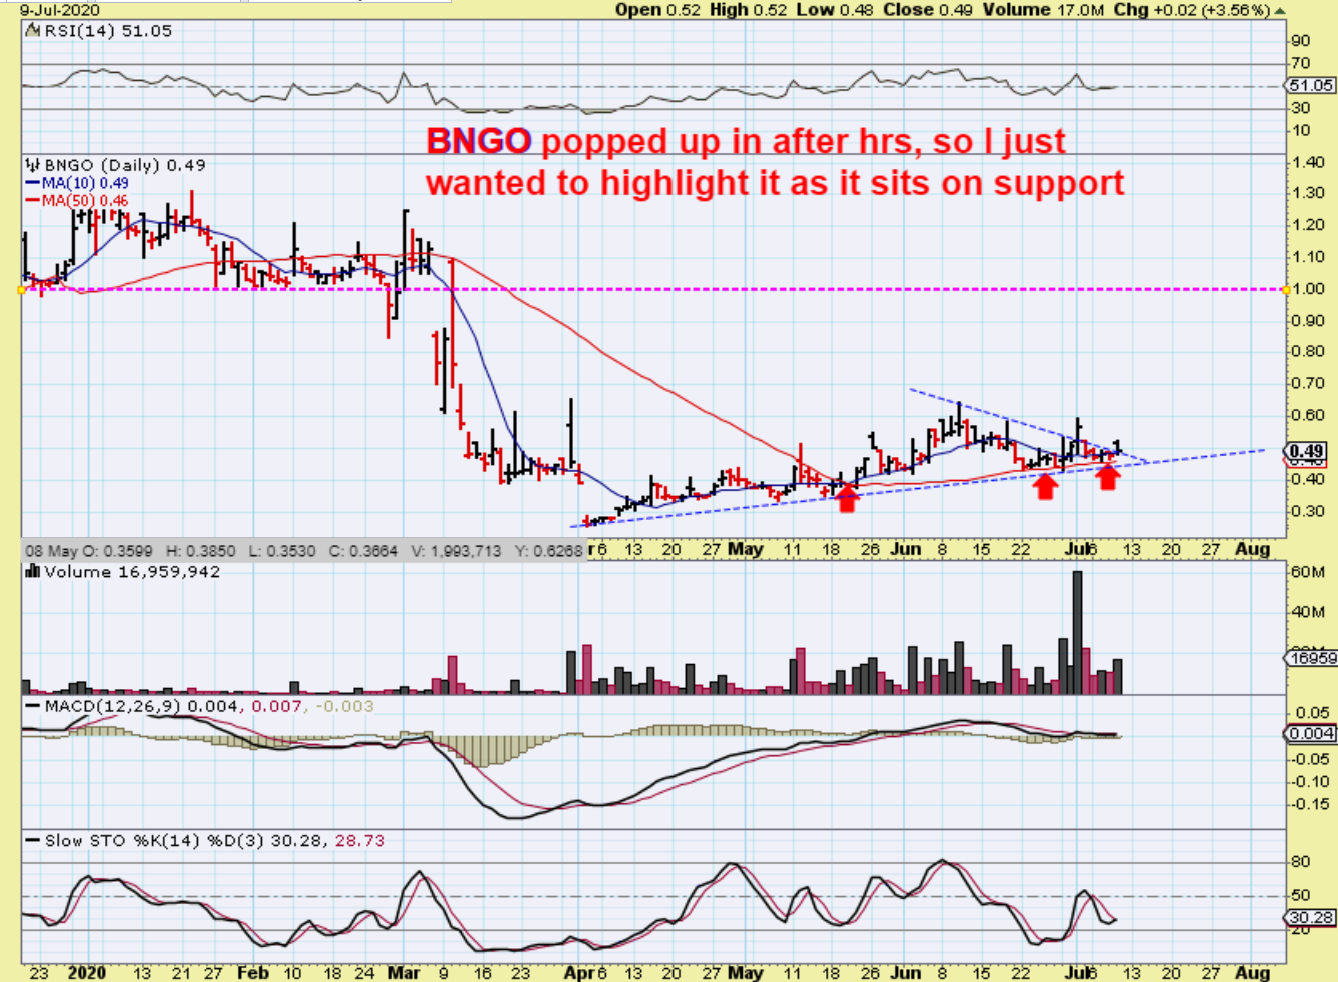
RECENTLY I POSTED ABOUT BNGO’s BASE. It popped and dropped but still closed up from here. What did that do to BNGOs weekly chart?
.
BNGO WEEKLY : Just like CHFS, I see HIGH VOLUME in a tight base. These usually POP , but this base is 15 weeks long.
-Could it Pop on week 16, next week? Yes.
– Could it Pop on week 17? Yes.
– Could it Pop on week 20? Yes,
My point is that I don’t know exactly when it’ll POP, or even if it really will, but the bullish signs are there, so I own it. My advice is that you probably shouldn’t buy it unless you can hold on inside of a base for a while & you may even have to possibly endure a few more ups and downs. I buy these as ‘SWING TRADES’, which means I own them for a while and wait for a price increase. I sell if it stops acting correctly .