Friday July 10th – The Garden
Today is Friday, the last trading day of the week. If you think about the last few weeks of trading, we have had many many stock picks from various sectors. Much of the trading has been very fruitful.
Todays report will still have a few bullish set ups as stock picks, but also it will be more of a review of the markets, so that we can tend to the garden that we have already planted. At times we need to weed out some areas and just let the other areas continue to grow. This report can help us to tend to The Garden.
.
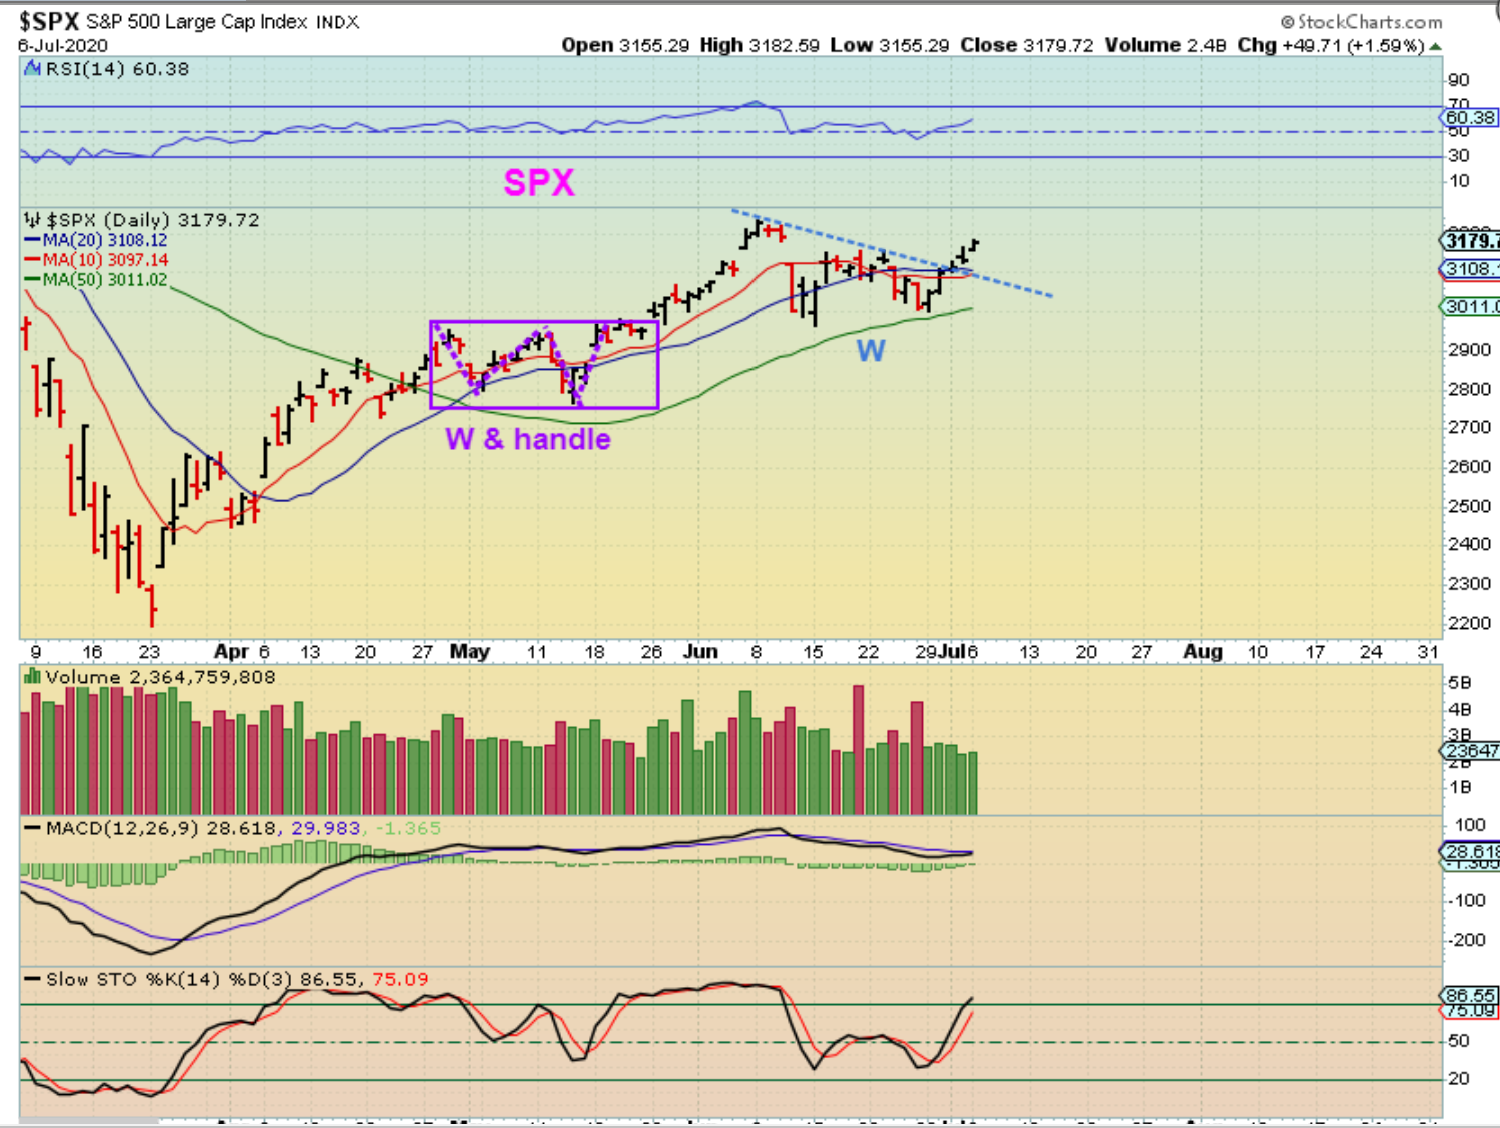
The SPX broke out and on July 6 we had this small run in place. Just like any break out, that break out could get back tested.
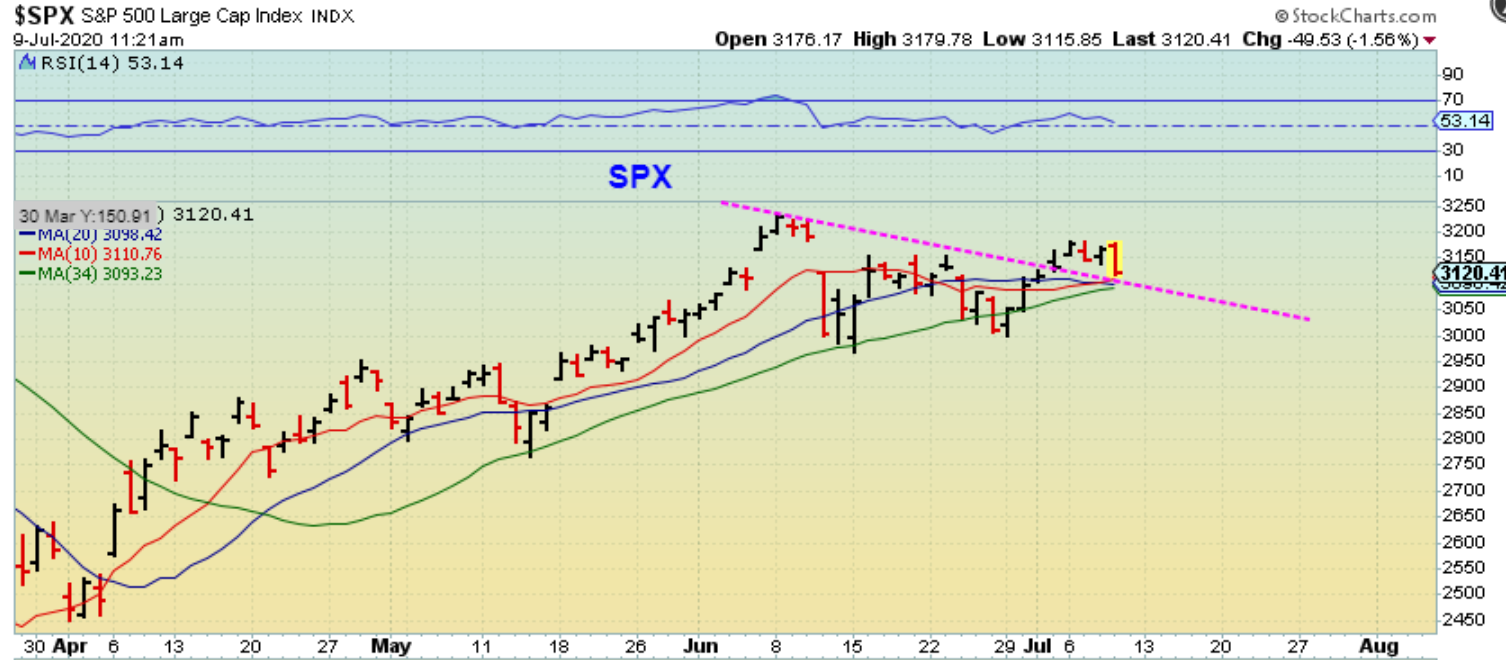
The SPX started to pull back this week and I mentioned that a test of the 10sma was possible. I grabbed this chart 2 hrs into trading Thursday to show that we were at support. We would look for a reversal here.
The SPX did a perfect back test & reversal, and …
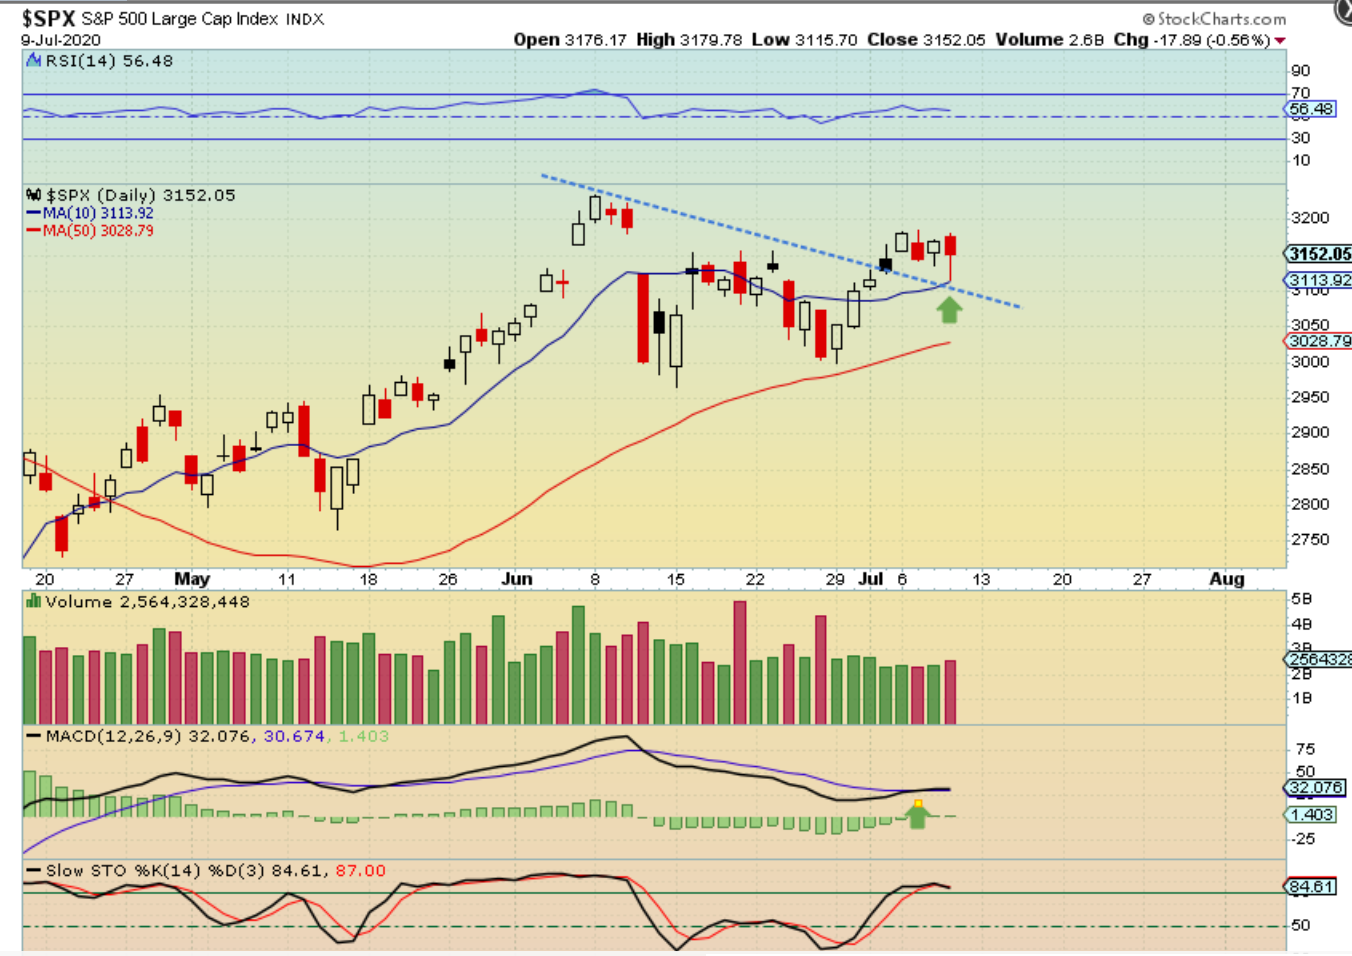
AT THE END OF THIS REPORT YOU WILL SEE WHY I THINK THE MARKETS ARE GOING TO CONTINUE HIGHER FOR NOW.
.
WTIC has been squeezing in a tight range and I have said that I think we’ll see a quick drop into a DCL. Well at this point, it has to go 1 way or the other, so I would say that we should know by Fridays close which way this wants to go. I think a drop will be short lived if we get one. 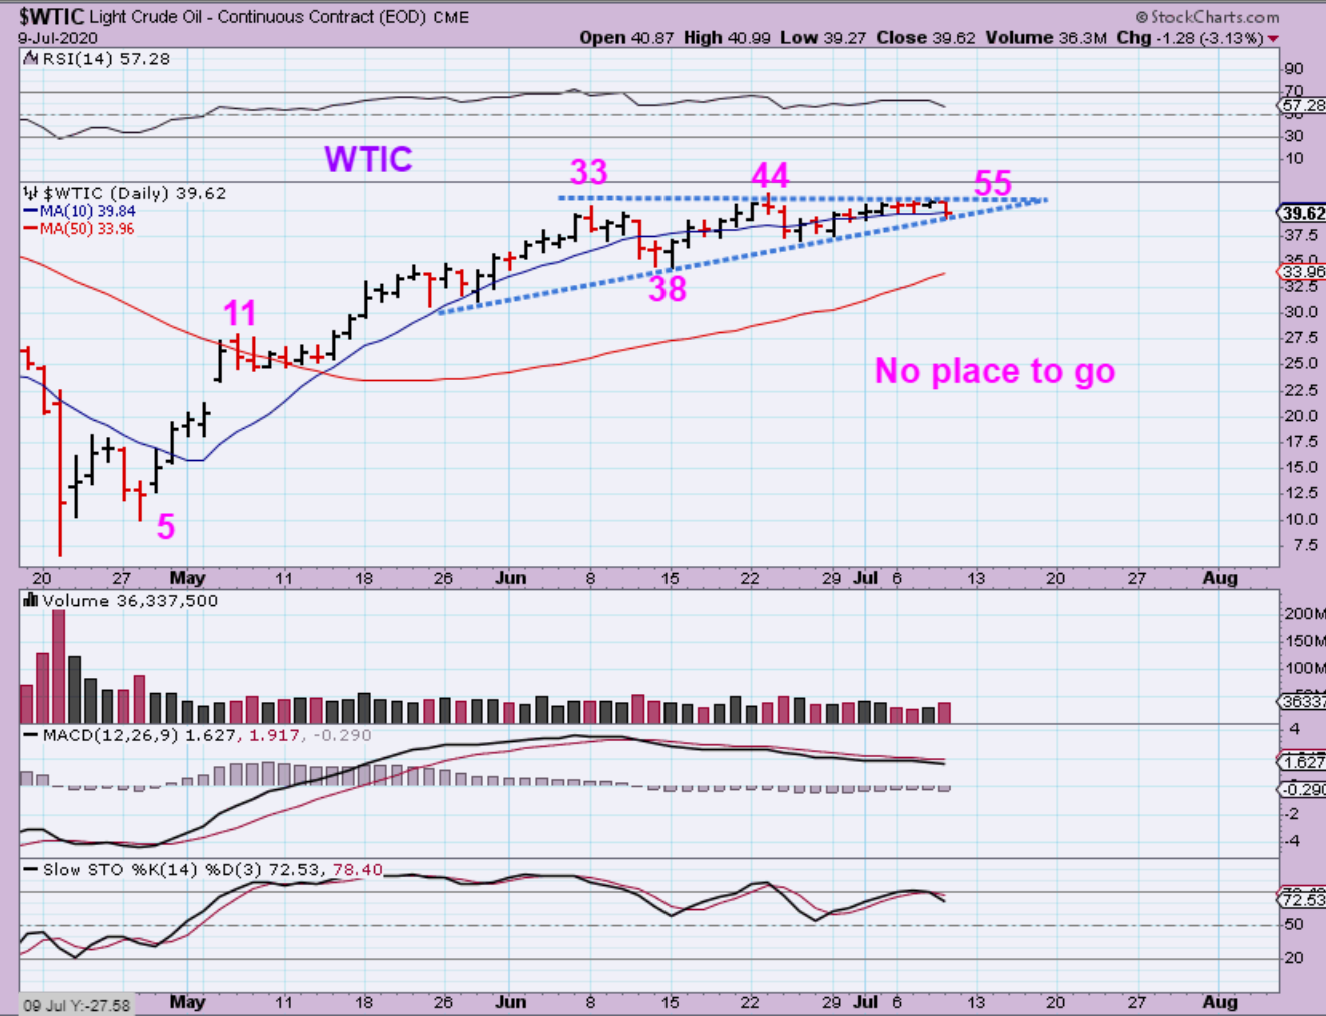
.
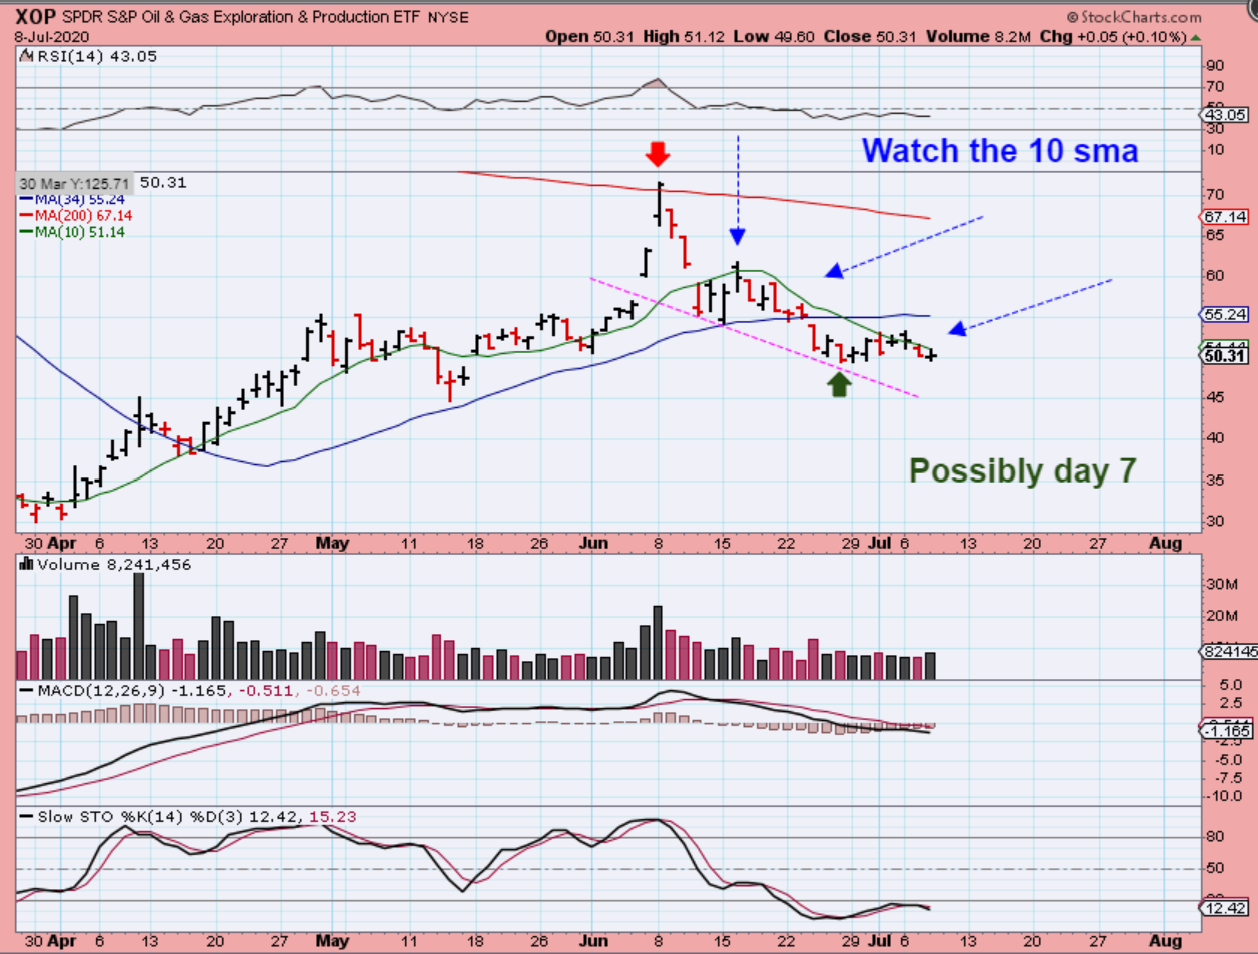
I used this chart yesterday to mention that The XOP/ Energy stocks are not ready until they get above their 10 sma. It looked like a 1-2-3-4-5 down to me. XOP dropped yesterday.
.
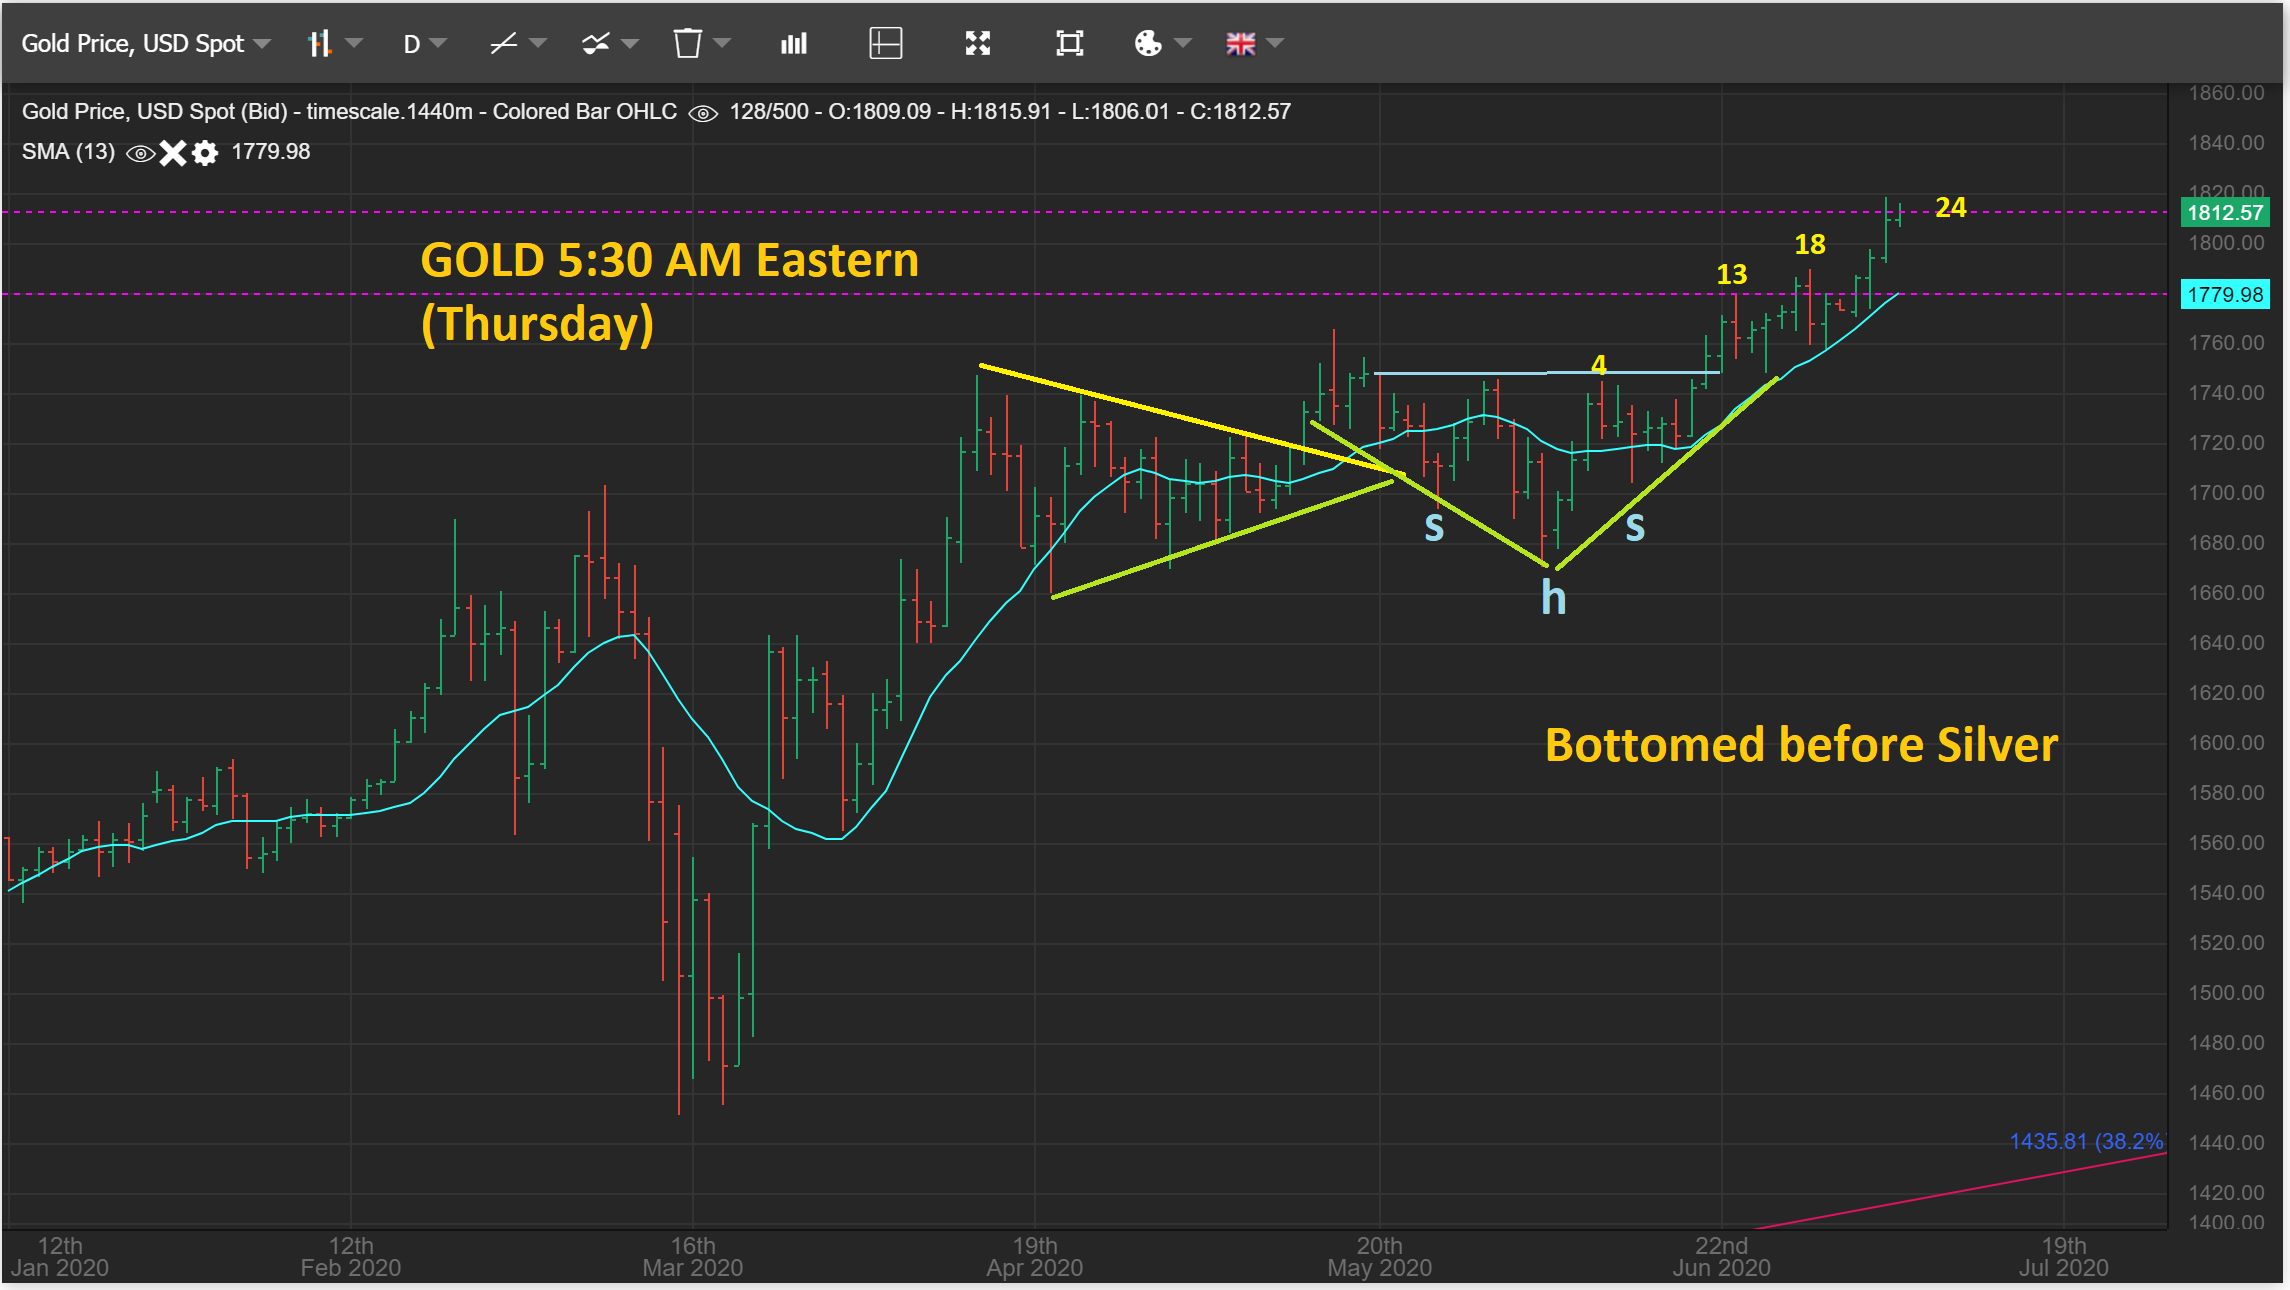
GOLD from yesterdays report as Gold was starting to move higher early at 5:30 a.m.
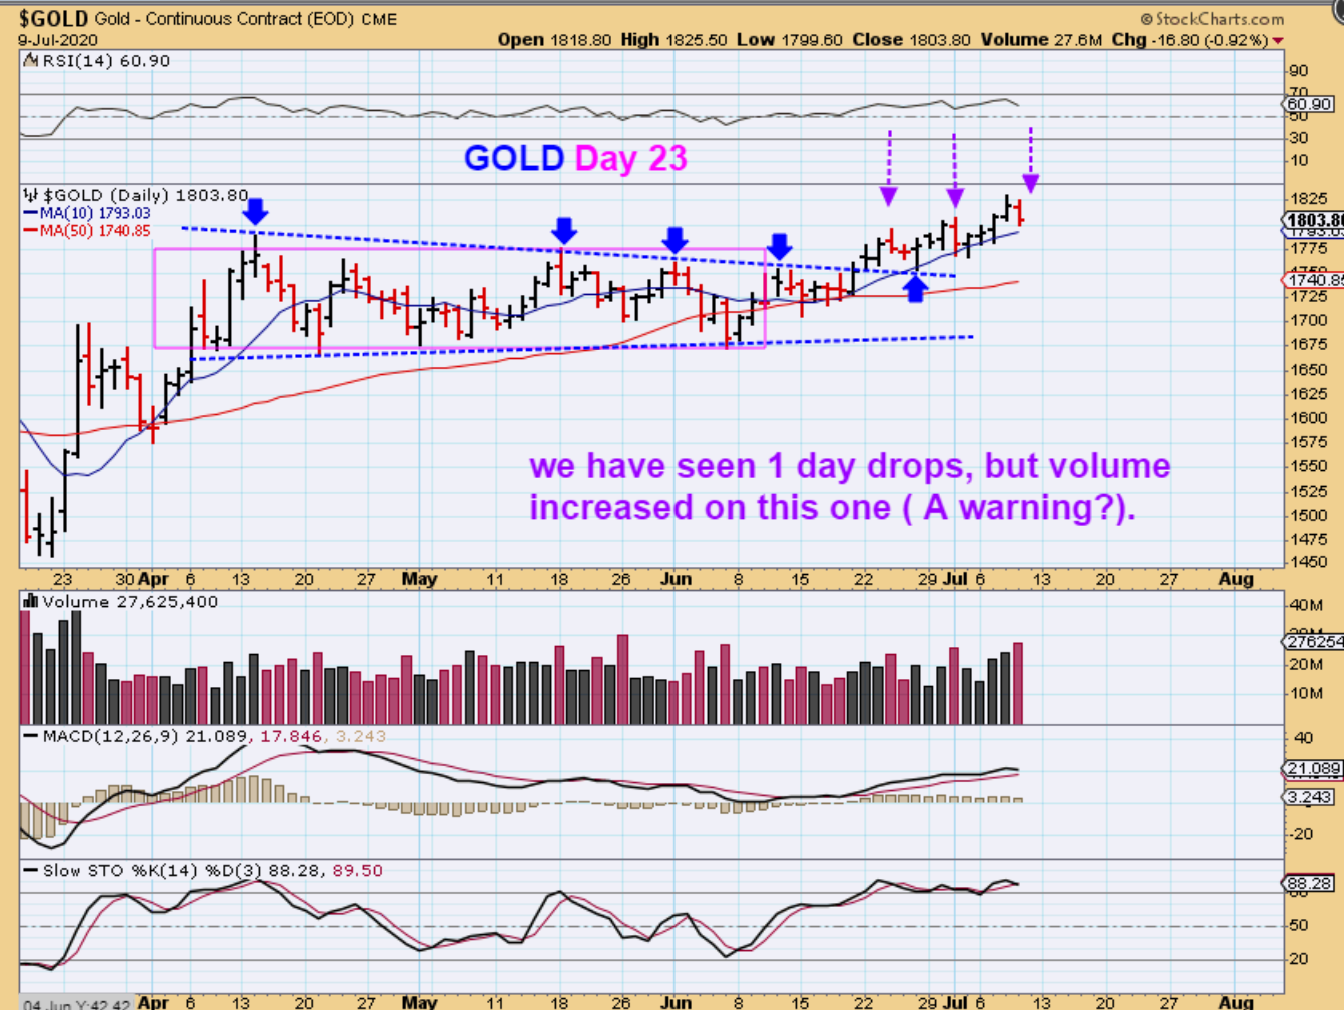
GOLD – And then it dropped. IS THIS THE TOP of our daily cycle? It is too early to know for sure, but the timing is within the range where we should expect one to develop soon, so…
1. We do see an unconfirmed swing high, but
2. Support has been at the 10sma on recent dips.
3. I do see increased volume, so we stay alert.
4. As a break out from a long consolidation, this can still go higher.
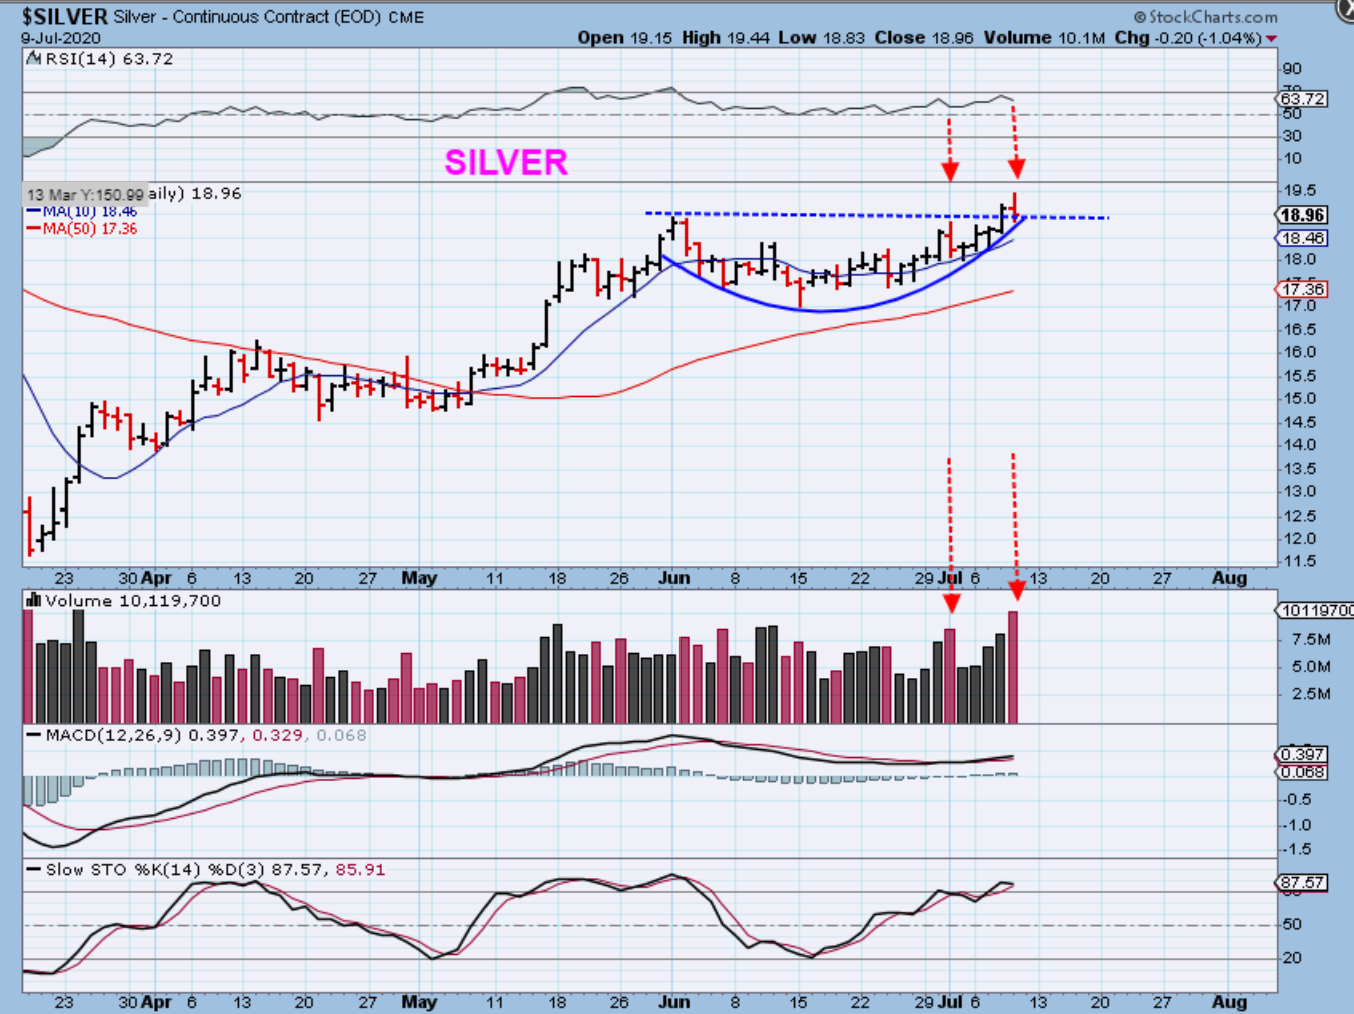
SILVER on Stockcharts looks like a break out that is falling back inside of the cup, however, Stockcharts often shows incorrect price action, so…
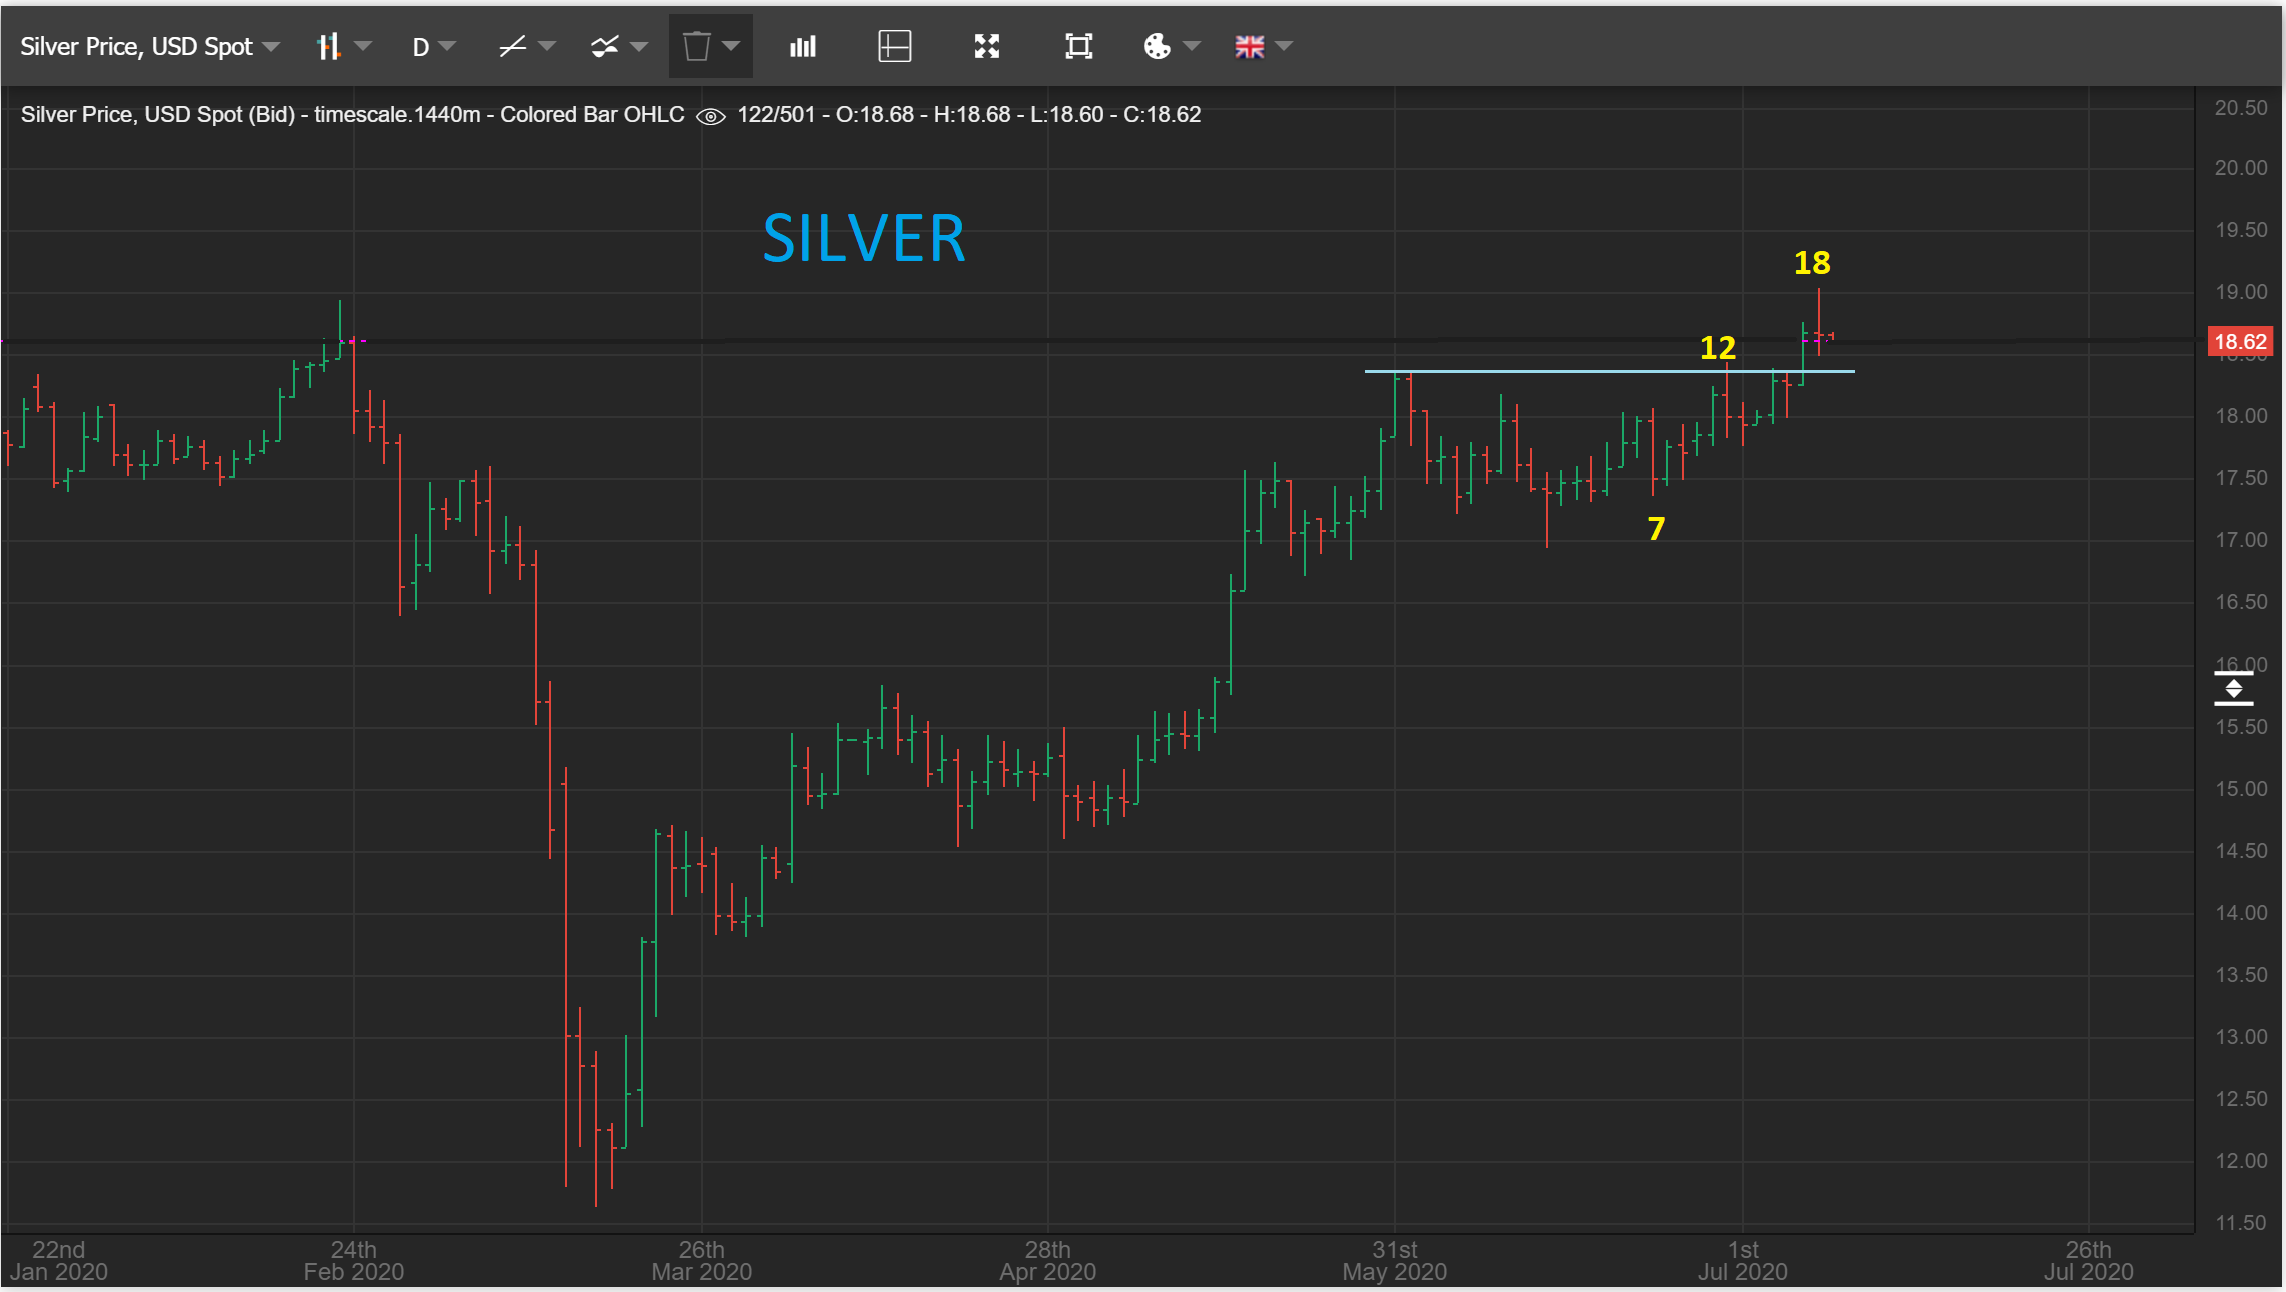
SILVER futures show Silver well above the break out, and it looks more like a back test. If it is it should not drop much further. Silver is earlier in its daily cycle than Gold.
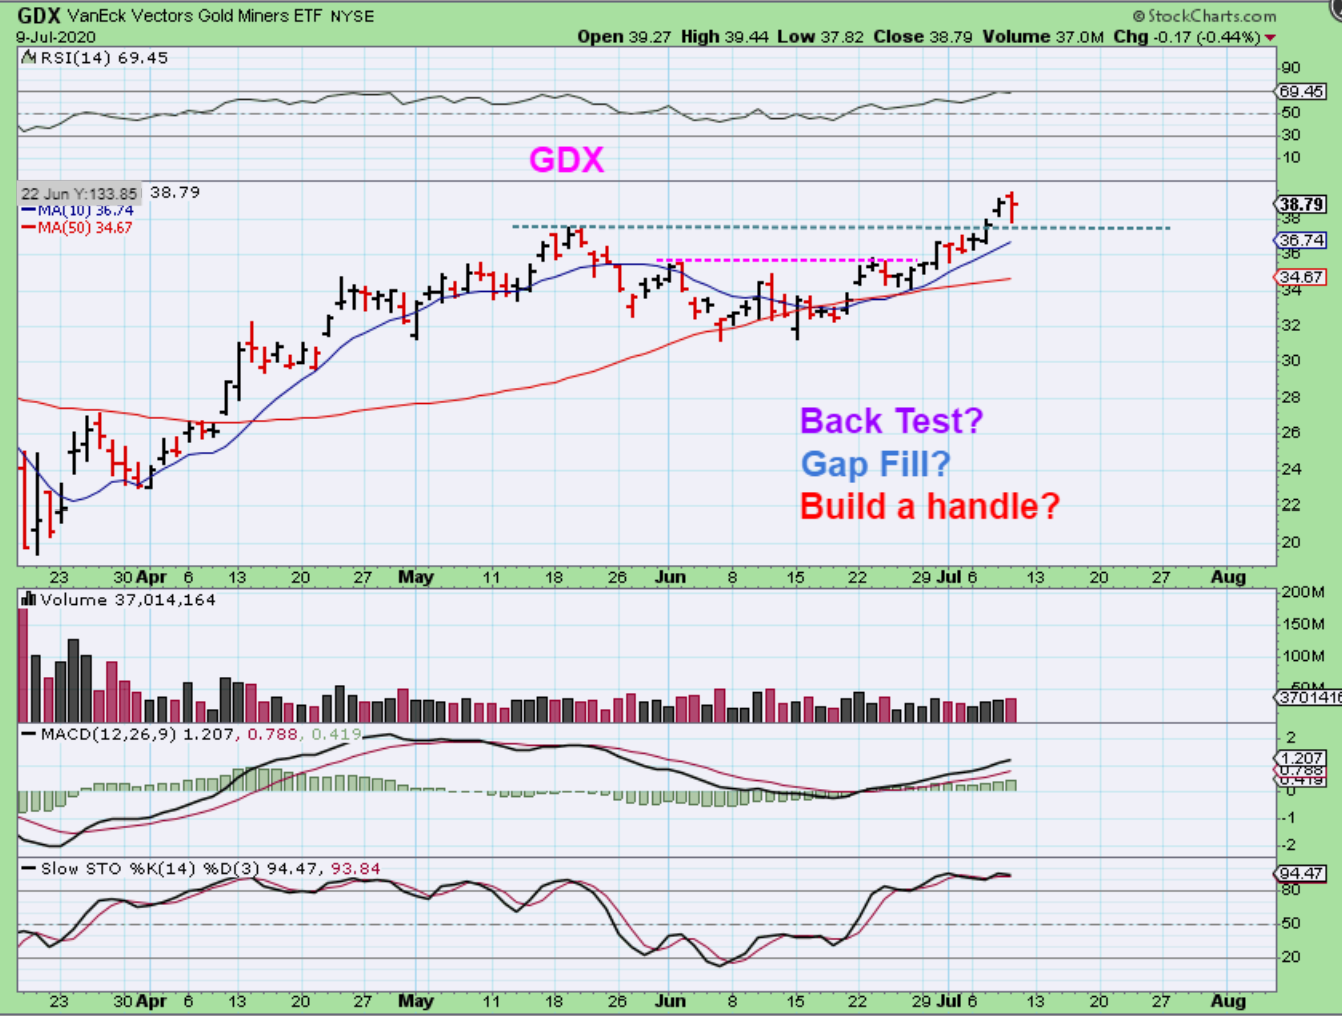
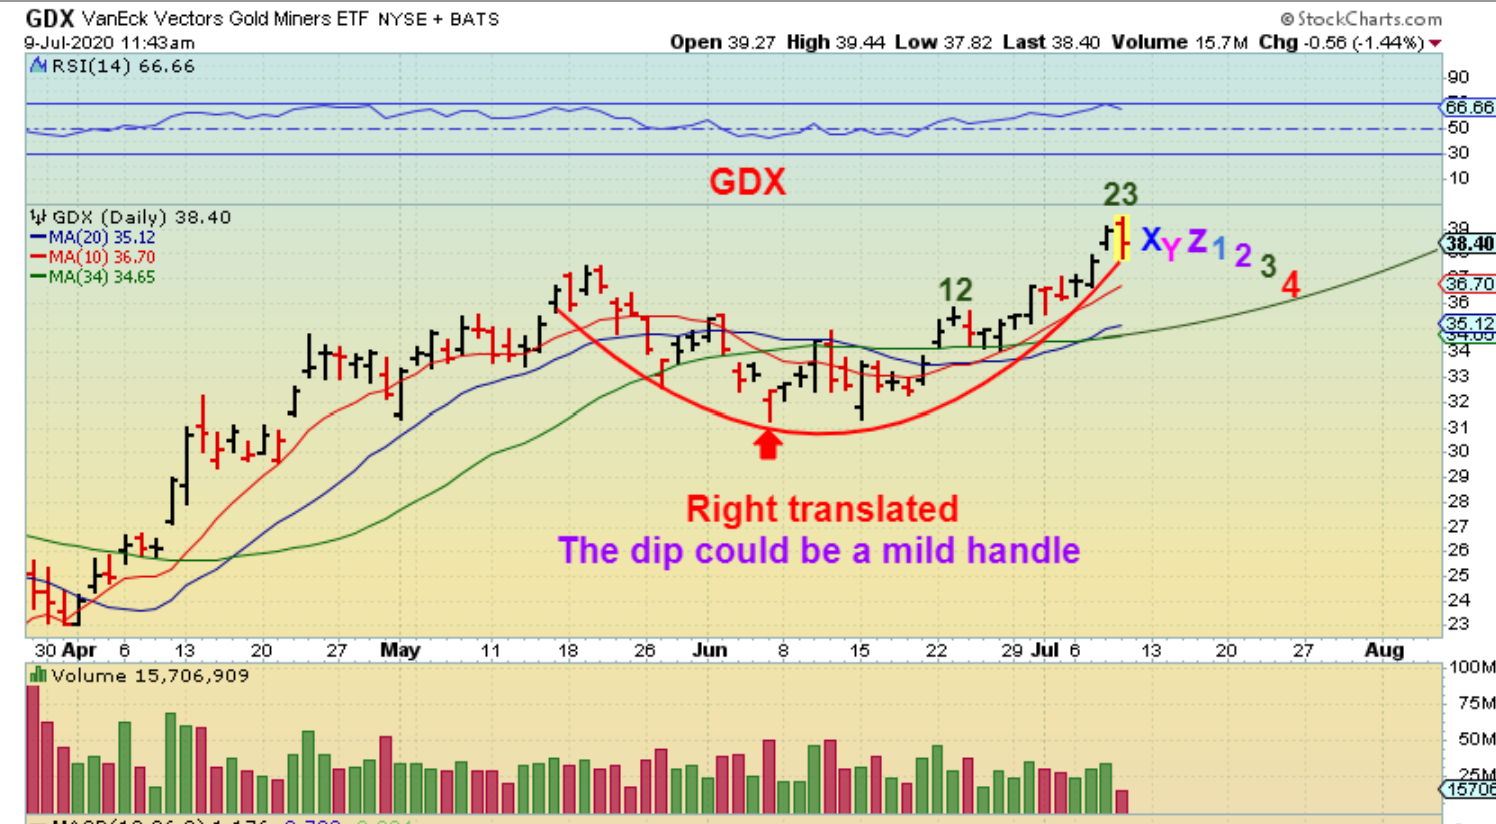
GDX – This is also a swing high, but it may or may not be the ‘peak’, we need more time. Please read the chart.
,
WHAT I SAID HERE YESTERDAY IS STILL VALID :
.
THIS WAS IN YESTERDAYS REPORT: This was forming a cup, and has now broken out. On day 23 we can run to day 28-30, or we can back test at anytime too, so the risk has increased. That said, Yes: You CAN buy this as a break out & take your chances for a few days of gains, maybe you’ll even get 5 more days higher, but you also may only see 1 or 2 days up and then 3 days down to a back test too. This late in a cycle, we just don’t know for sure. Buy and Stay Frosty? 🙂
.
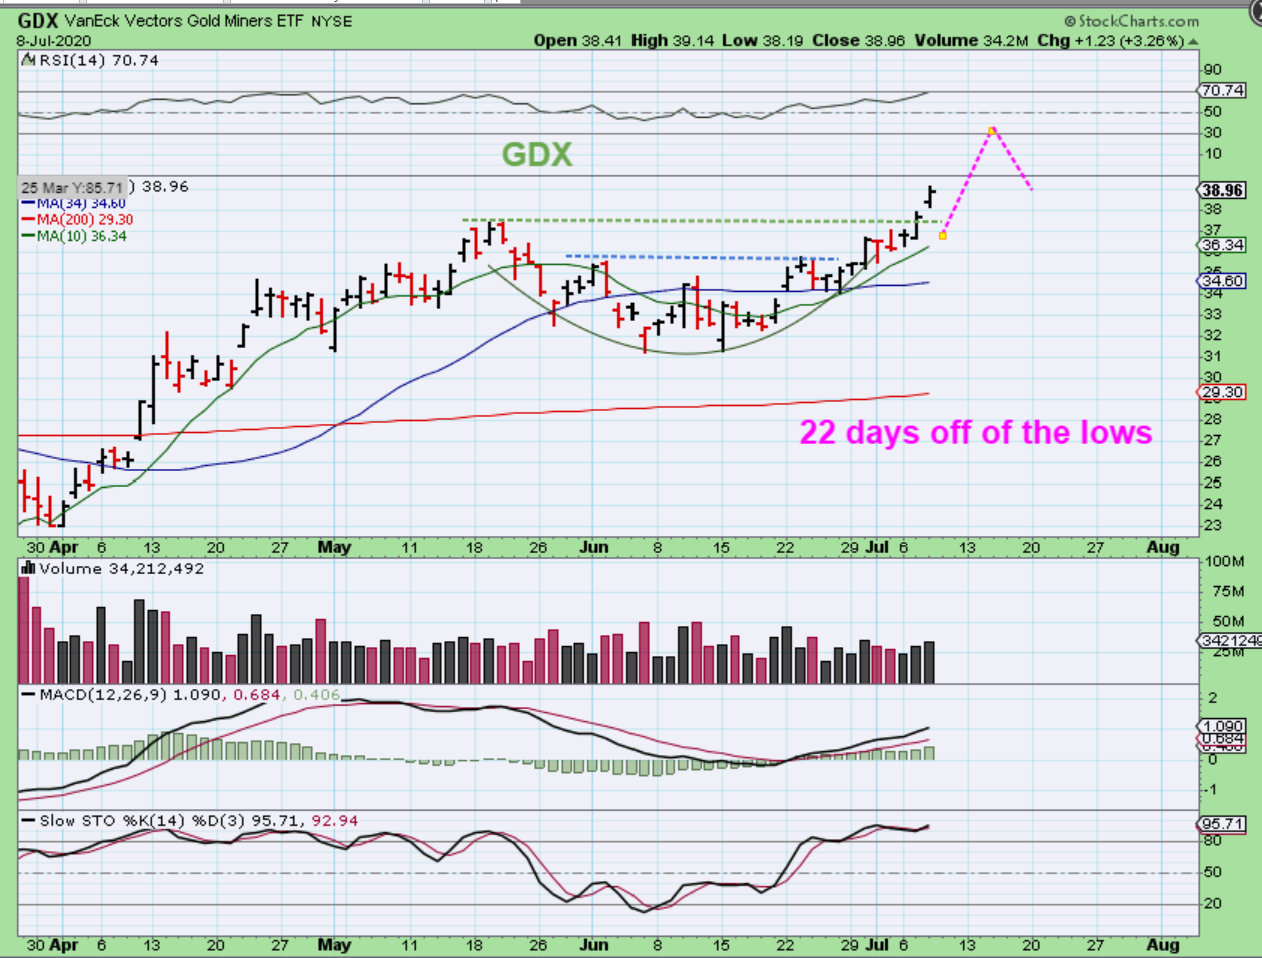
How deep will a drop into a dcl be? We could dip to the 34 or 50sma, or it could actually be mild if this cup just forms a handle. I will draw an example, but obviously this is not an exact prediction- it is a visual example to help you to picture how it possibly could play out with a milder drop.
.
When it starts to get close to the ‘time’ for a peak to present itself, it also may be time to look for extended positions and trim them up a bit. Since this MIGHT still flip and go a little higher, you can just lock in profits on the ones that seem overly stretched or show divergence. You can cut position size, the number of positions you hold, or whatever you see fit to ensure that you lock in some gains. Below I am going to show you below why I actually think that the General Markets still want to go higher, so you may even want to plant a new position or two. Stops under that 10sma on the SPX have once again kept the ‘longs’ in the trade for now.
.
Enjoy your Friday gardening!
.
~ALEX
.
WHY THE GENERAL MARKETS LOOK AS THOUGH THE DIP WAS A NORMAL DIP/ BACK TEST AND CAN CONTINUE HIGHER? SEMICONDUCTORS OFTEN LEAD THE MARKETS HIGHER…
.
AMD popped up 3.5% on good volume for a Midday point, while the markets sold off. So I posted this midday and …
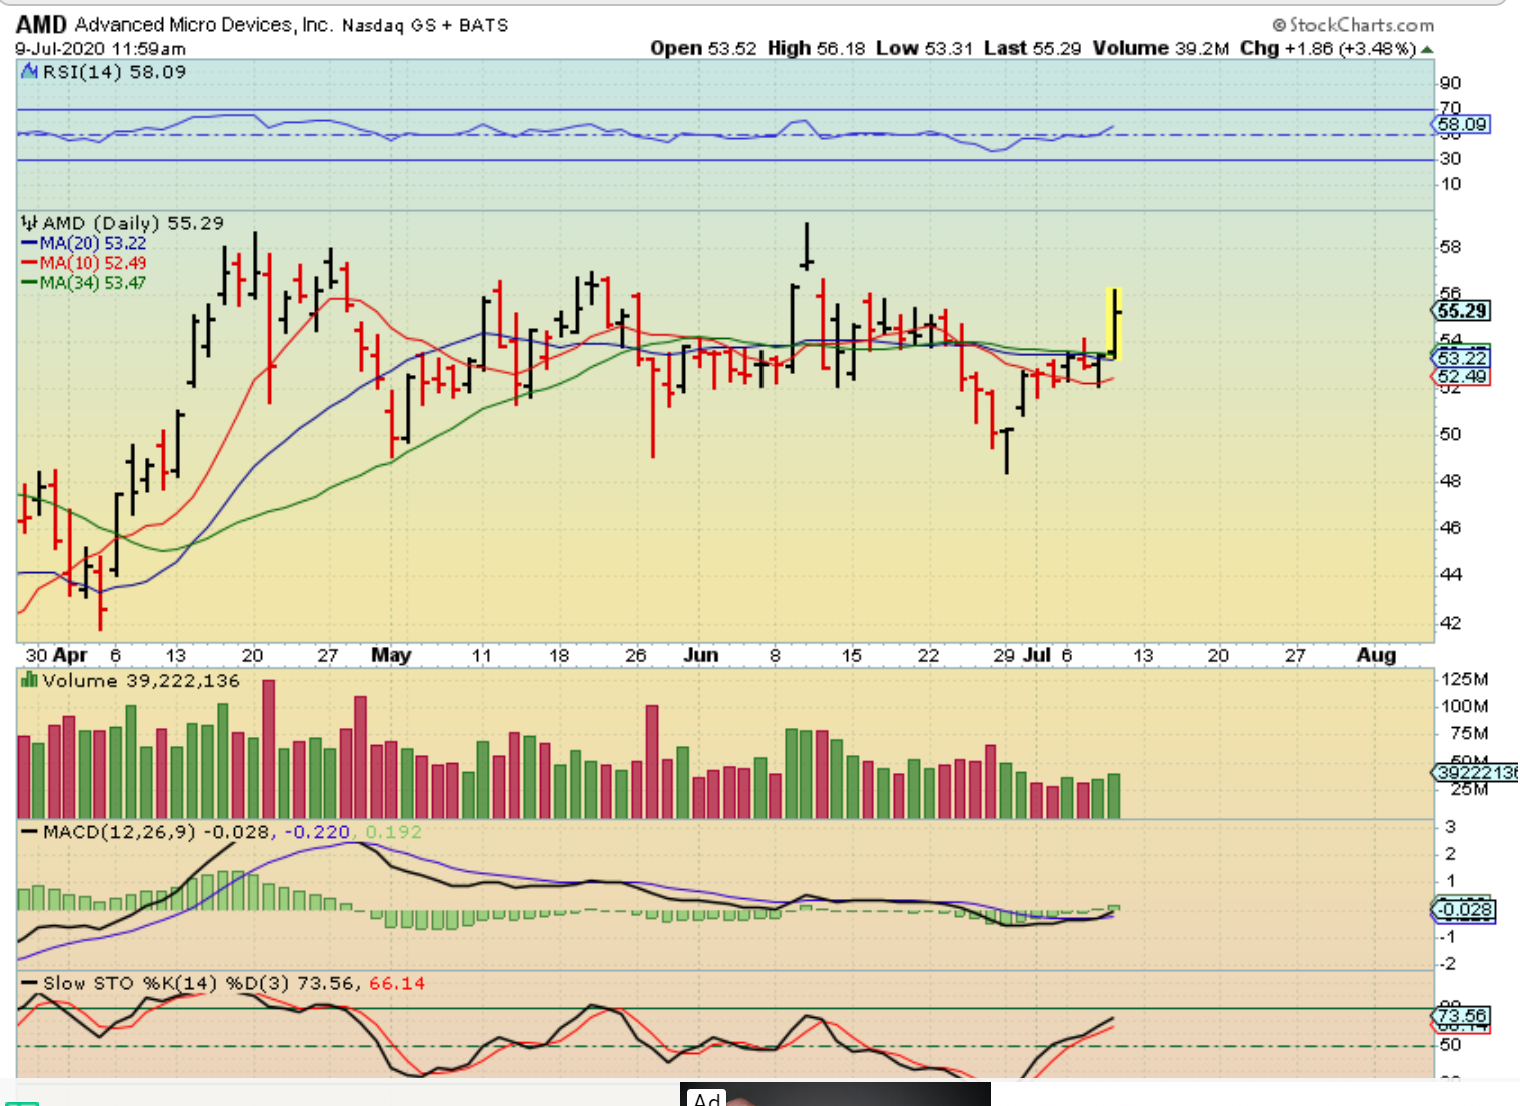
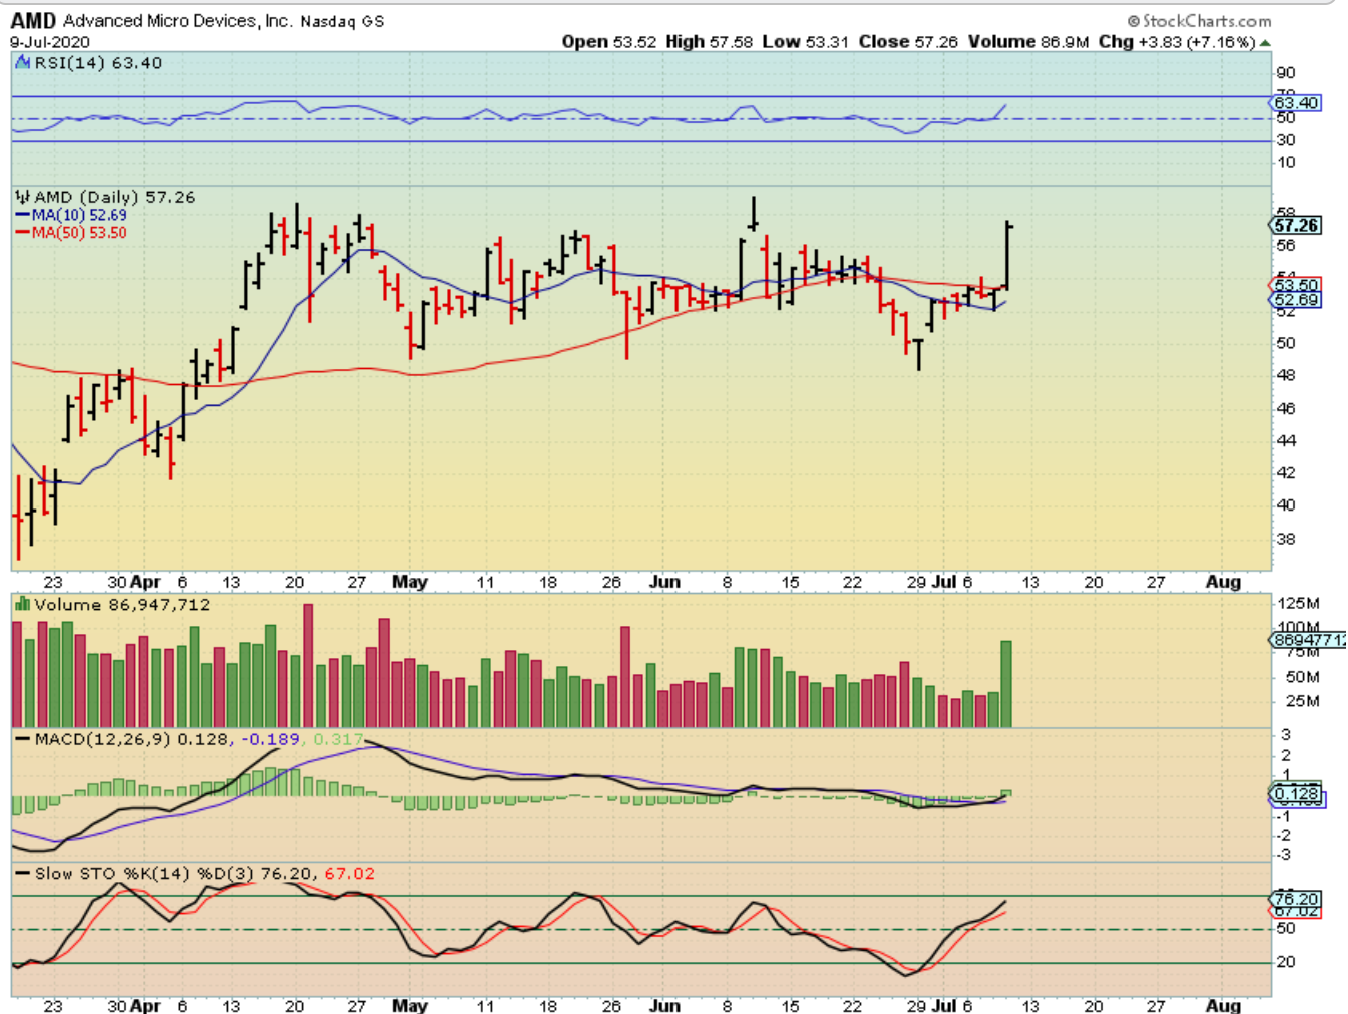
AMD then closed at the highs and that ended up being up 7% with strong volume. This can break free and run strongly. Also …
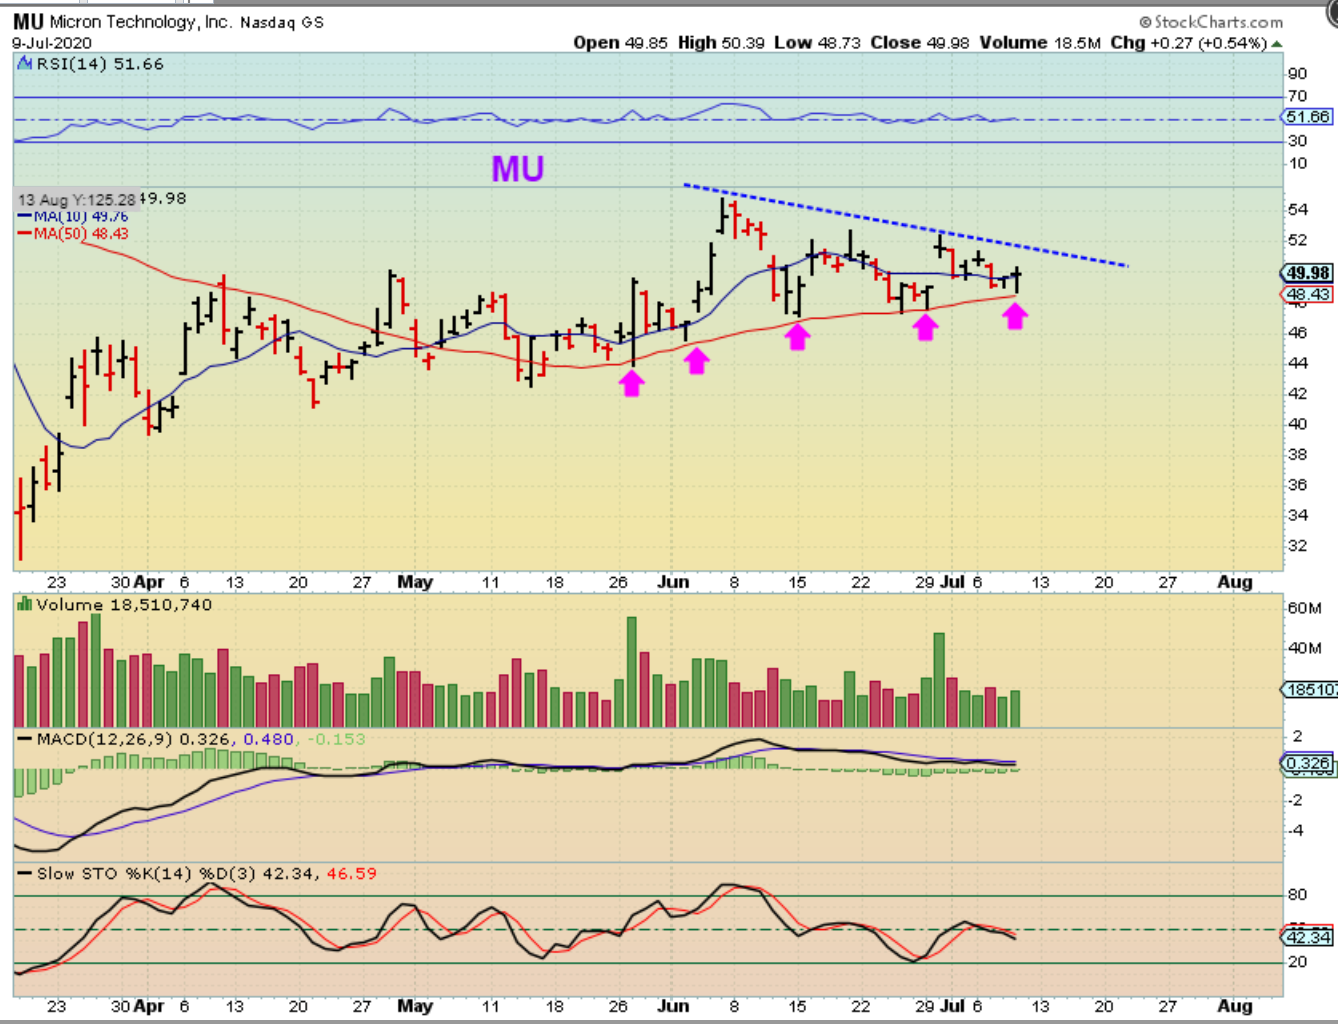
MU remains set up to break higher too. It has been supported at the 50sma for weeks and has consolidated for months. And…
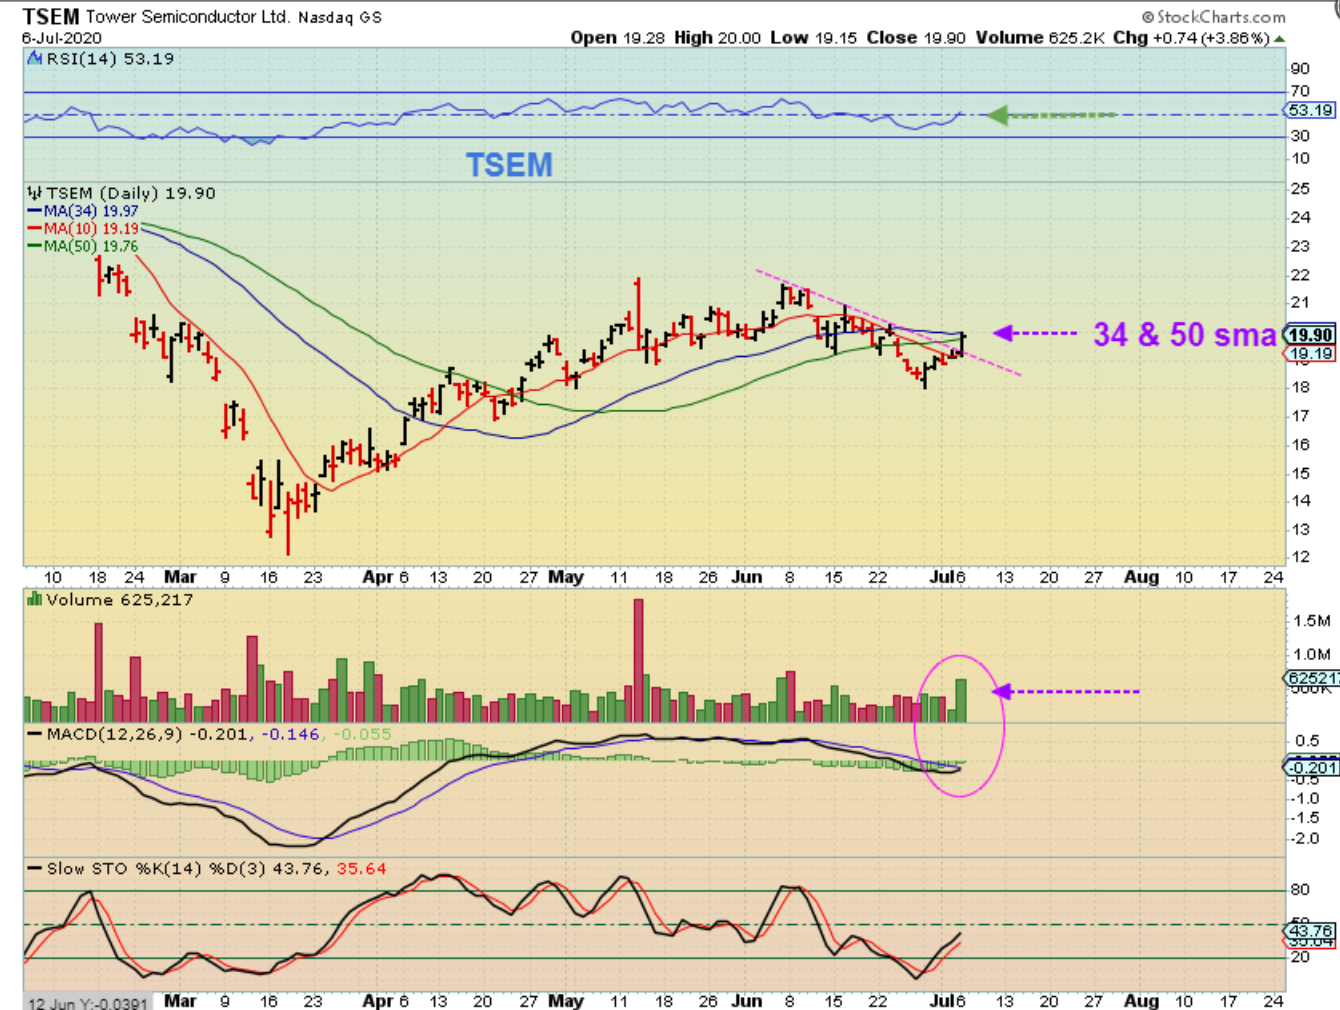
TSEM – Using this chart, I mentioned TSEM 3 days ago as Bullish, especially if it gains those moving averages…
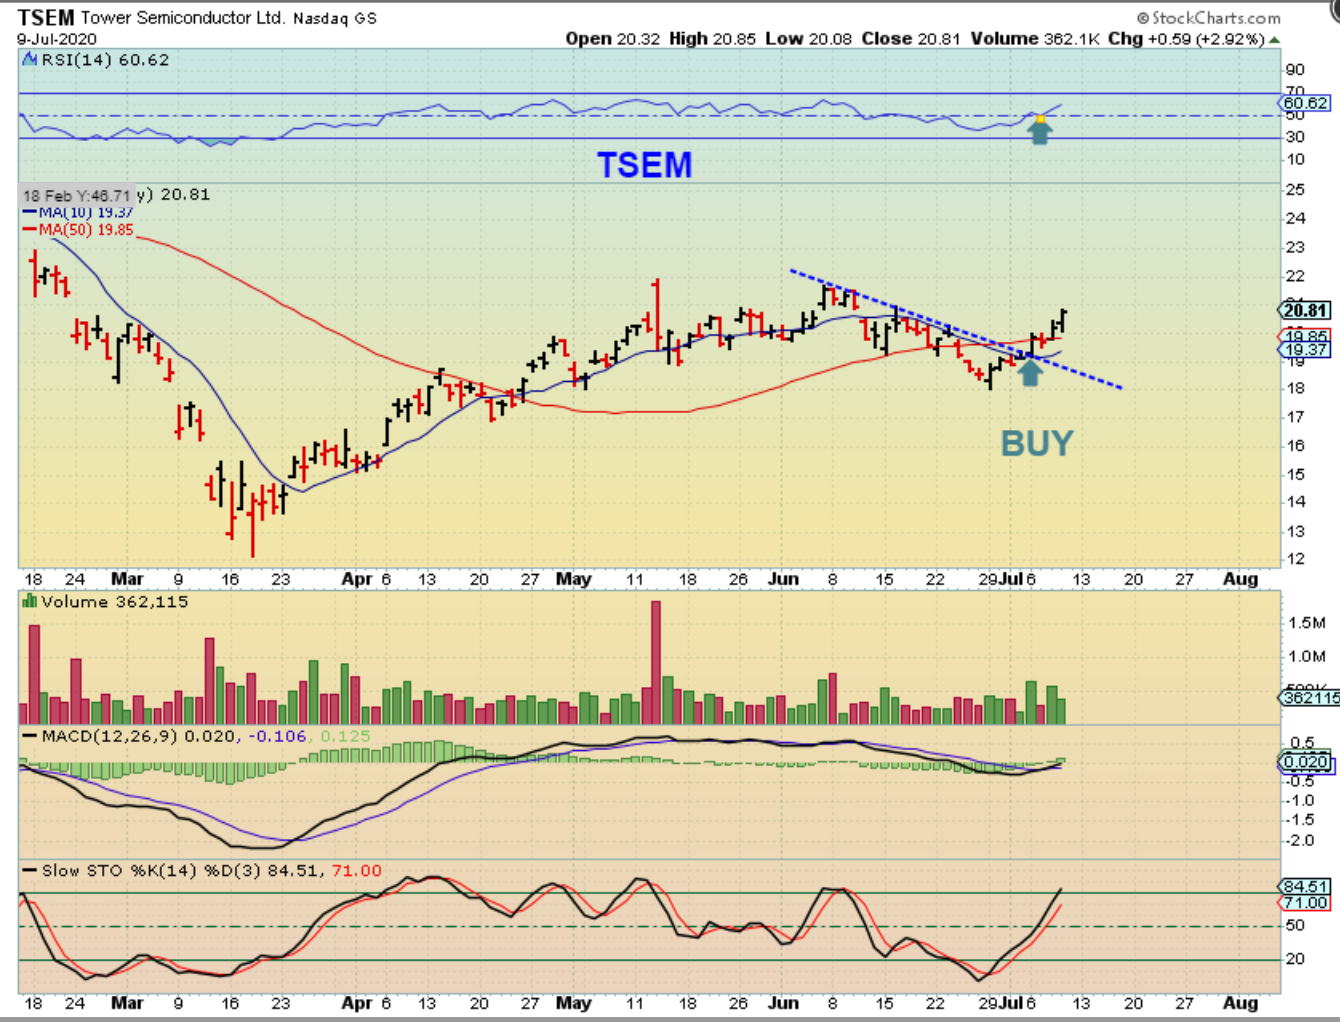
TSEM – It remains a buy and wants to continue higher.
AMAT and a few other stocks also look like good set up, so SEMICONDUCTORS LOOK SET TO MOVE HIGHER and SOX or SOXL may be worth a swing trade too.
.
NOVN, BNGO, CHFS ( up & down) and GRTS were up in after hours. BNGO was up over 10% and had a good amount of volume for A.H. Trading, so watch that one. These and others may be ready to move higher too. Let’s discuss yesterdays bullish action in a few of these.
.
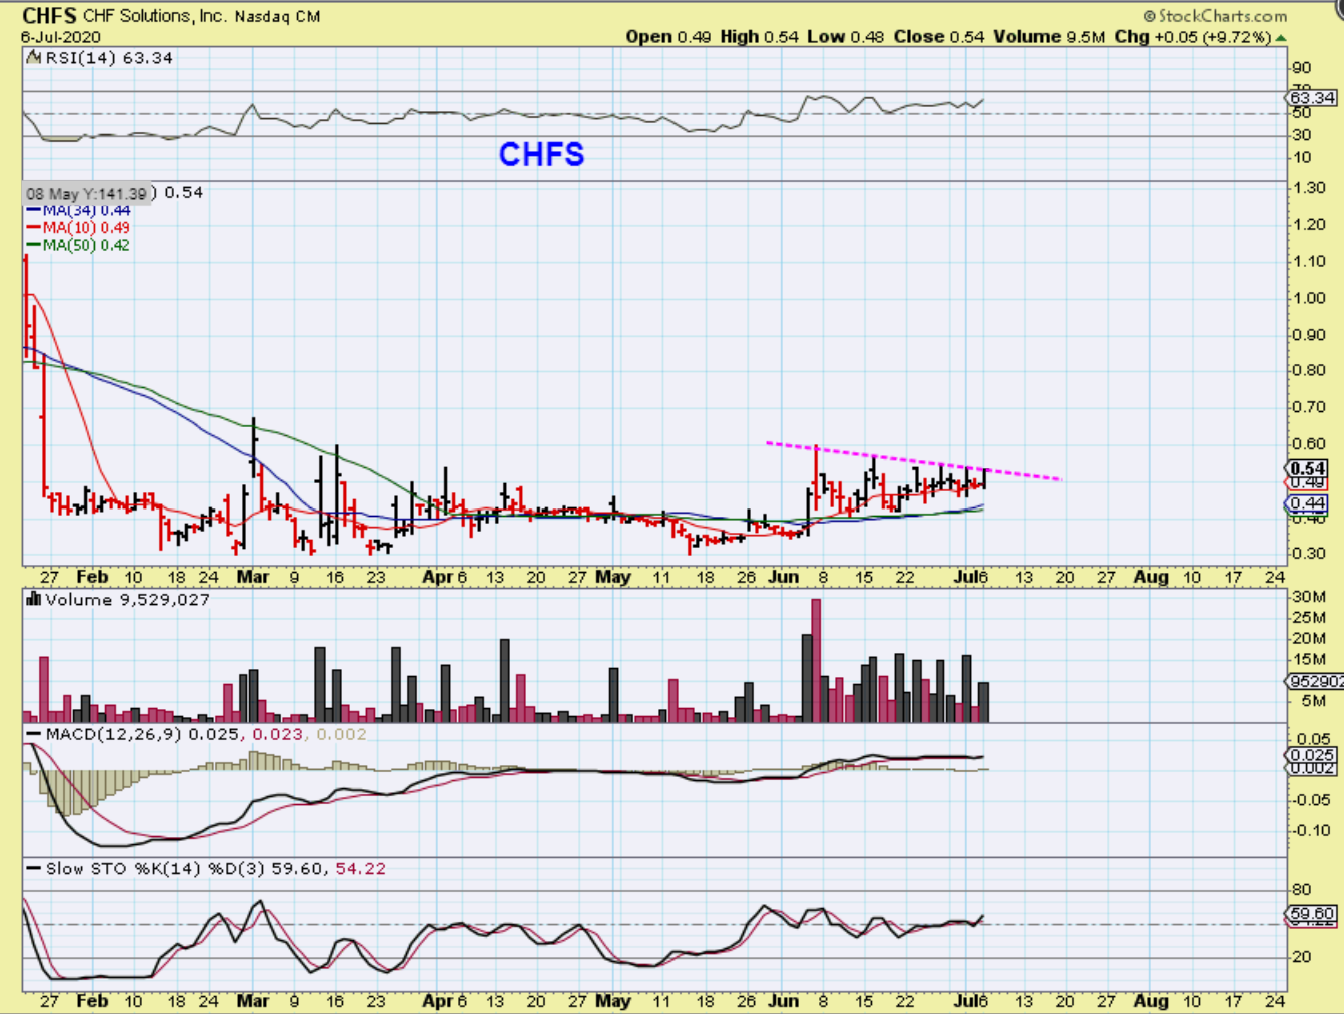
CHFS FINALLY BROKE OUT Tuesday but then dropped back down Wednesday. People hated me again, 🙂 for getting them into this roller coaster ride know and THE CHIEF (CHFS).
.
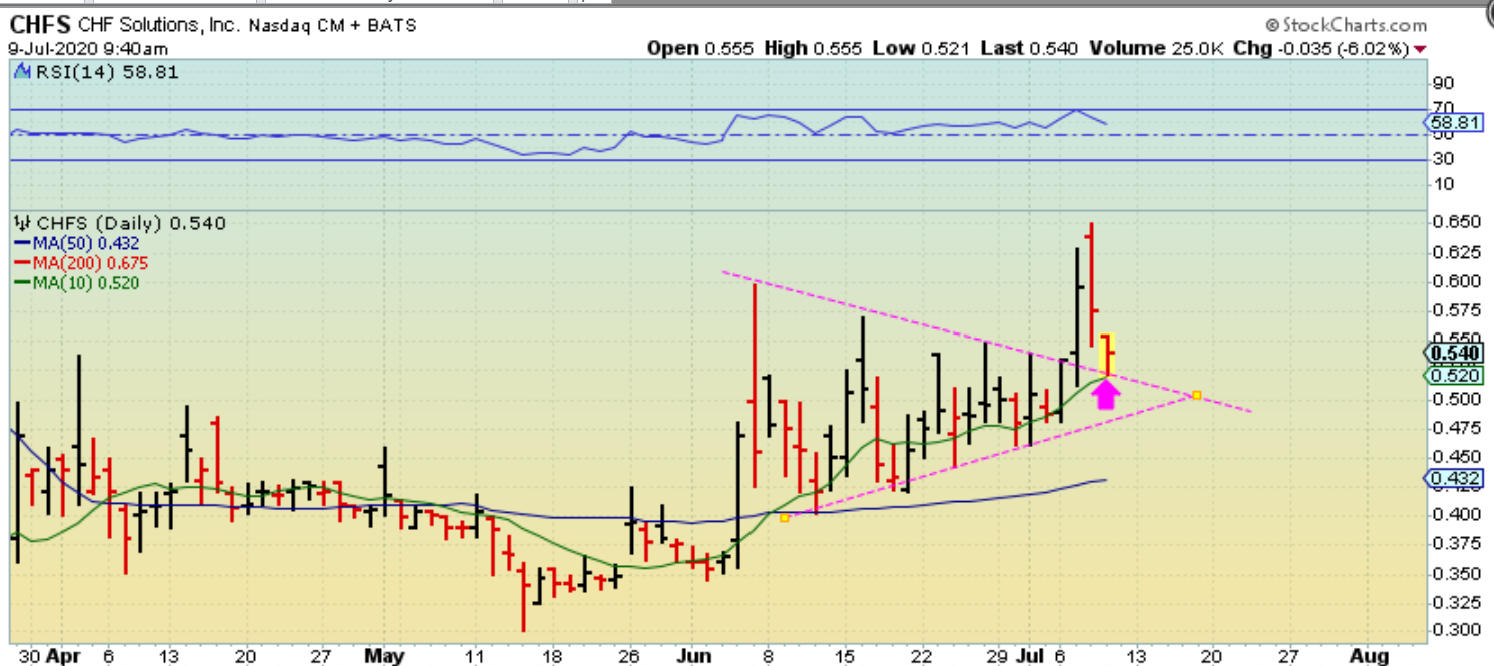
This was CHFS dropping down another 6% at the open Thursday. I called it a back test & drew this up for the live area. So this meant that CHFS dropped further Thursday morning and more people hated me for getting them into THE CHIEF 🙂
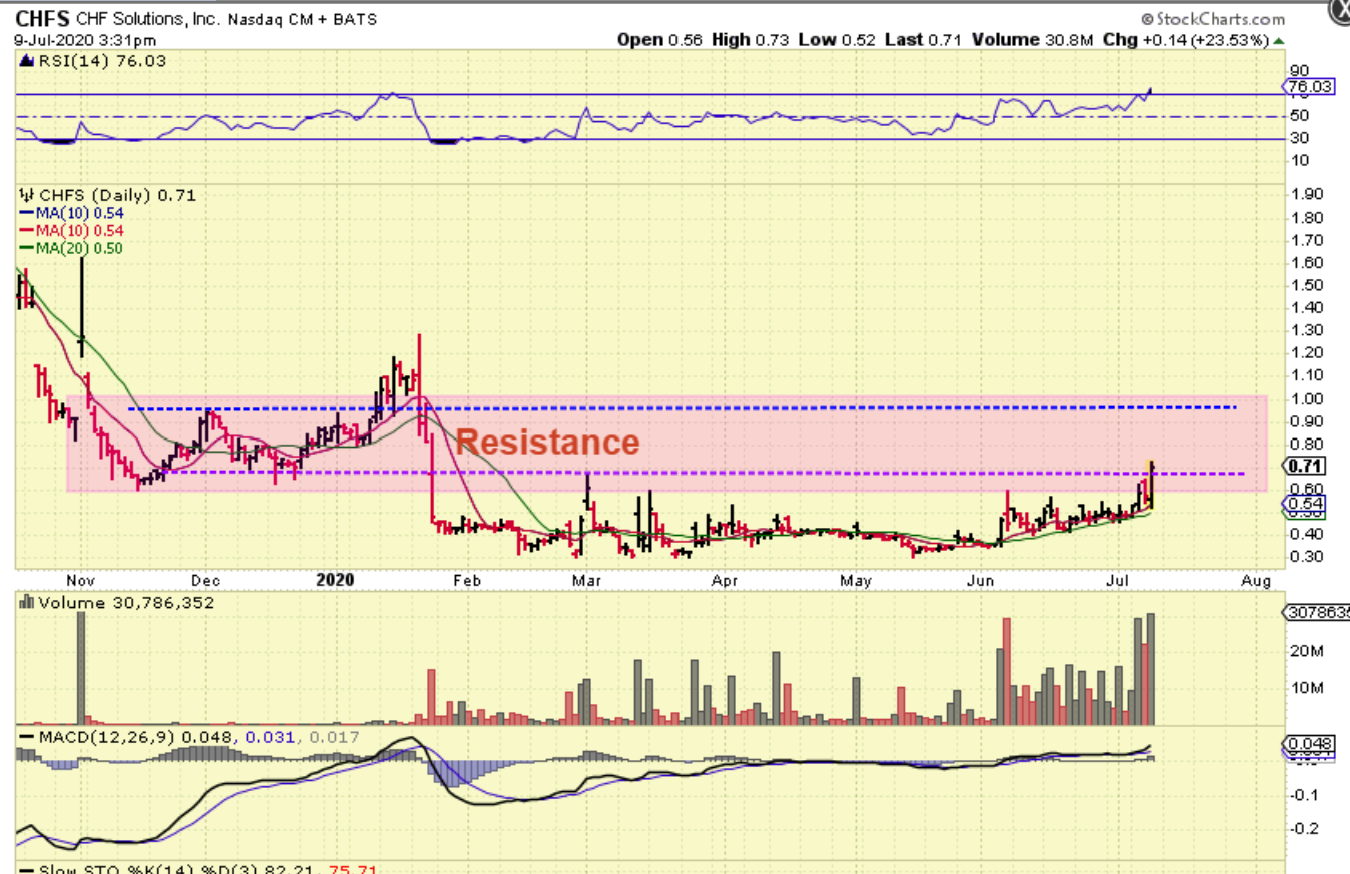
But by the close? We had REDEMPTION!! CHFS shot up 30% from the morning back test and sliced through the 200 sma. Finally shouts of joy and applause.
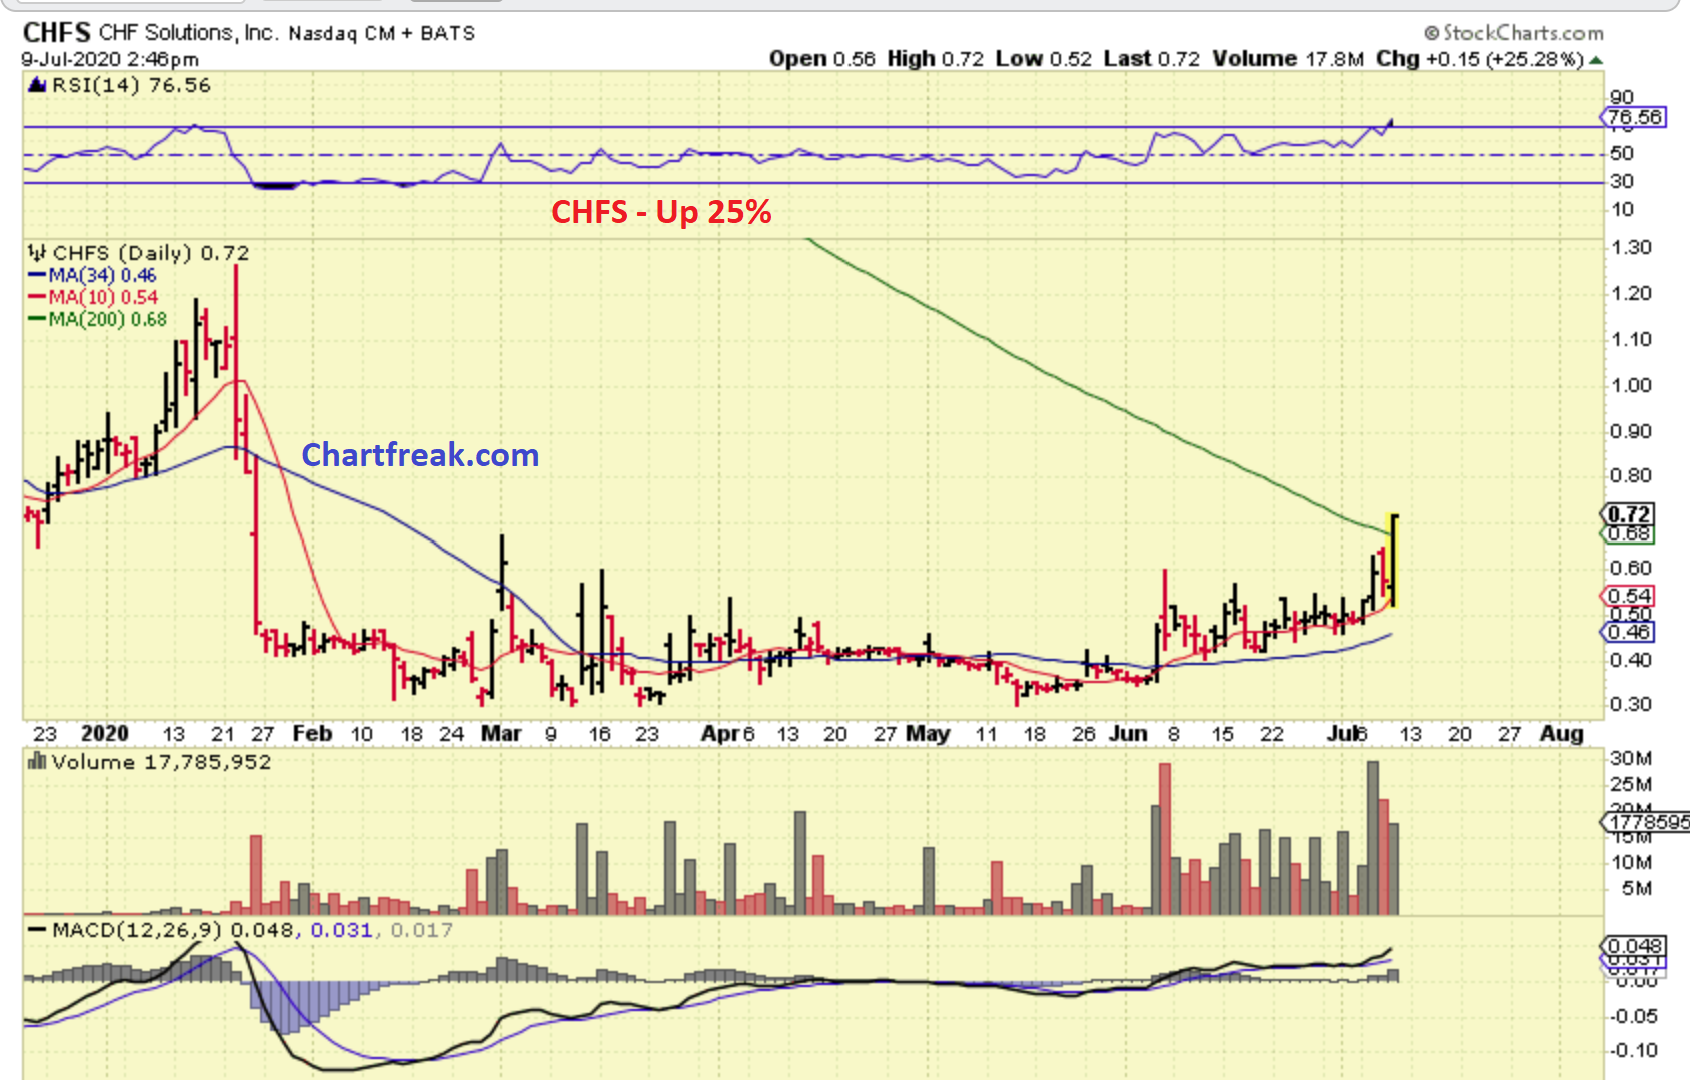
I showed 60 cents as resistance this week, so hopefully 60 cents is now support. There are areas of resistance along the way and this will not be an easy ride for those that want to try to stay invested, but a large base like this can make substantial progress over time. We did get in at the lows.
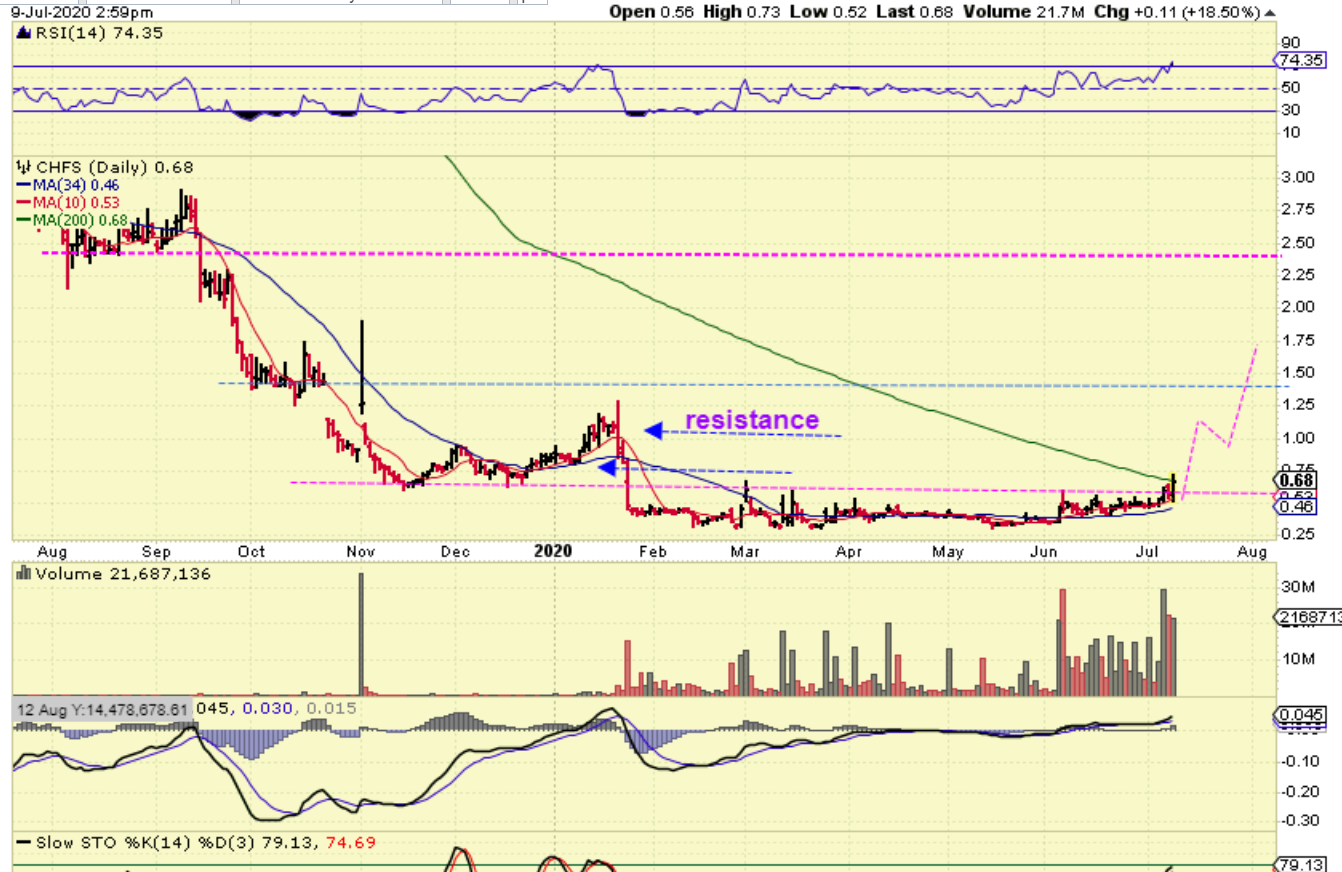
Since CHFS has such strong volume, it could run swiftly to $1 over time, but right now it is pushing through an area of resistance. This can remain slightly choppy at times. All we can do is take it 1 step at a time. YOU MUST DECIDE FOR YOURSELF WHERE YOU WILL SELL. Sell partial on the way up? Dump it and be happy with your gains? Sell 1/2 now, the rest can ride? Make a plan and I wish you the best, no one will play this absolutely perfectly. I do think that over time this can get back over $1.
.
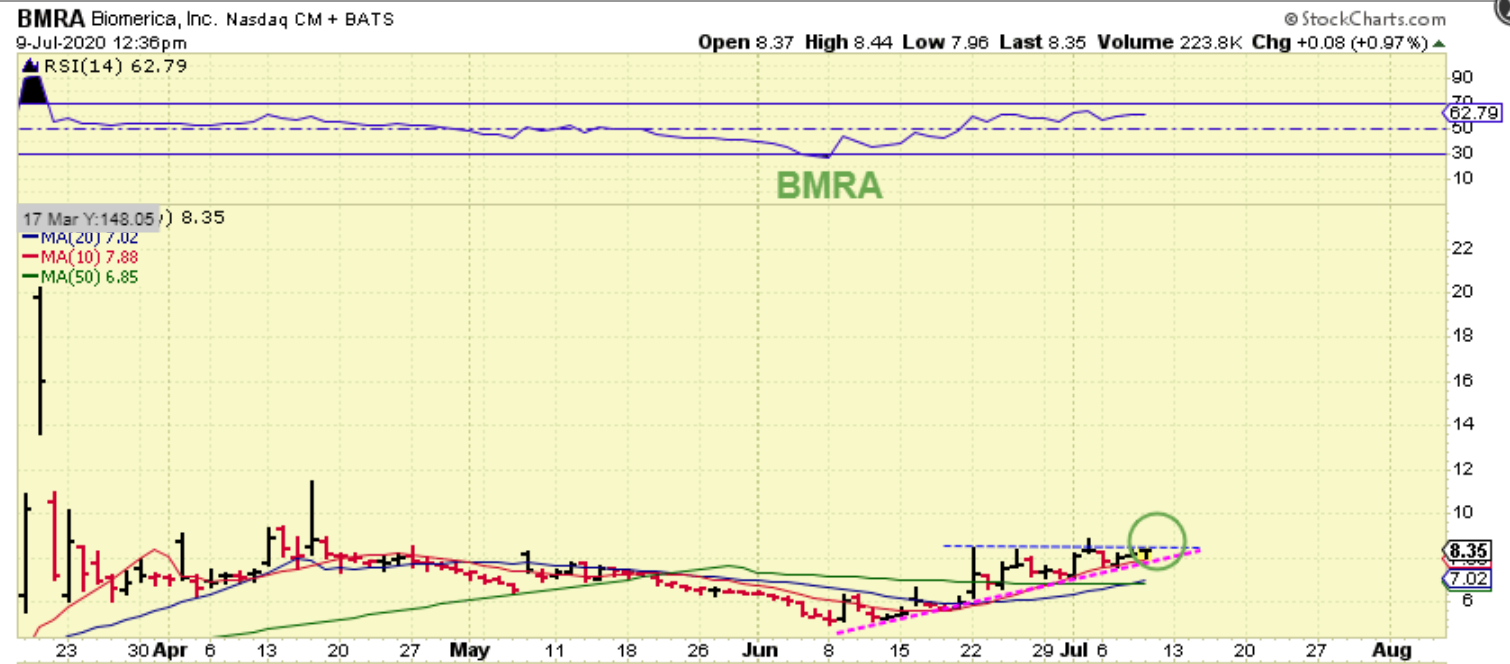
BMRA – I drew this midday. I own it and I like this set up, but I do wish that it had more volume. It actually broke this blue line in the last 1/2 hour of trading, closing up 6%. This MIGHT be ready to run.
.
BMRA: From March 2020 “Some companies are already making Covid-19 serology tests, and and U.K. authorities have purchased more than 3 million. Biomerica (BMRA) began shipping sample serological tests in mid-March .” With that news BMRA shot up to $22, because they already had test kits in stock. It then dropped and consolidated those gains.
.
BMRA WEEKLY – If BMRA gets over $9 to $9.50 again, it can run quickly higher. They have a rapid 10 minute covid test kit the company seems to be in good shape.
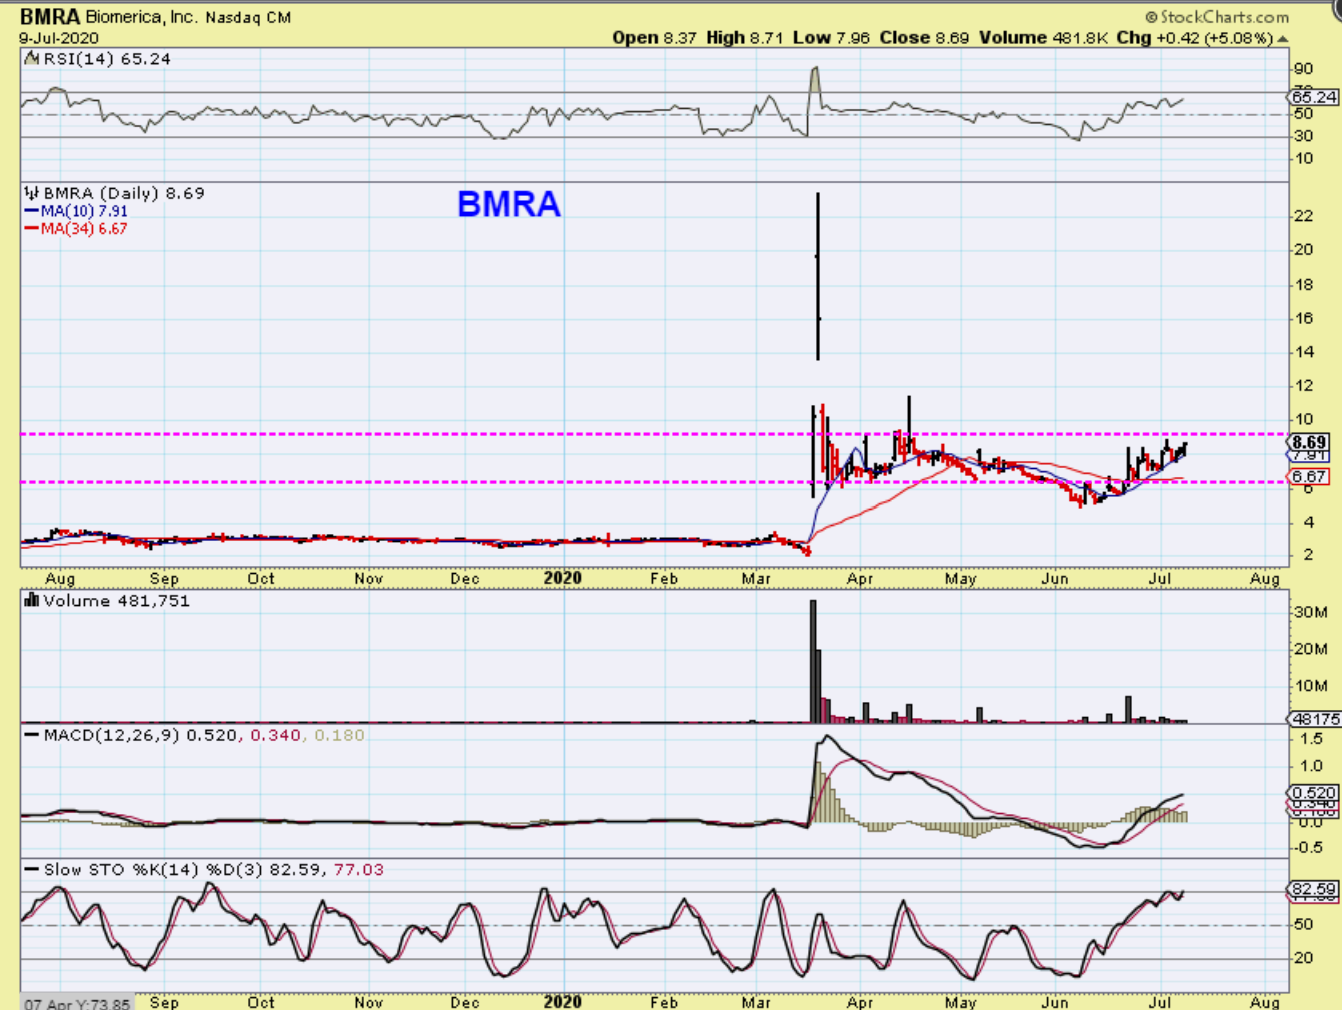
My understanding was that BMRA applied with the FDA to be approved to distribute these test kits in the US. I looked into it again and Now I read that the FDA has said that they do not need approval anymore, they can just supply them to the U.S. ( ?). It was a bit confusing, so I’ll need to do further research , but the chart looks like they are in still in good standing.
.
.
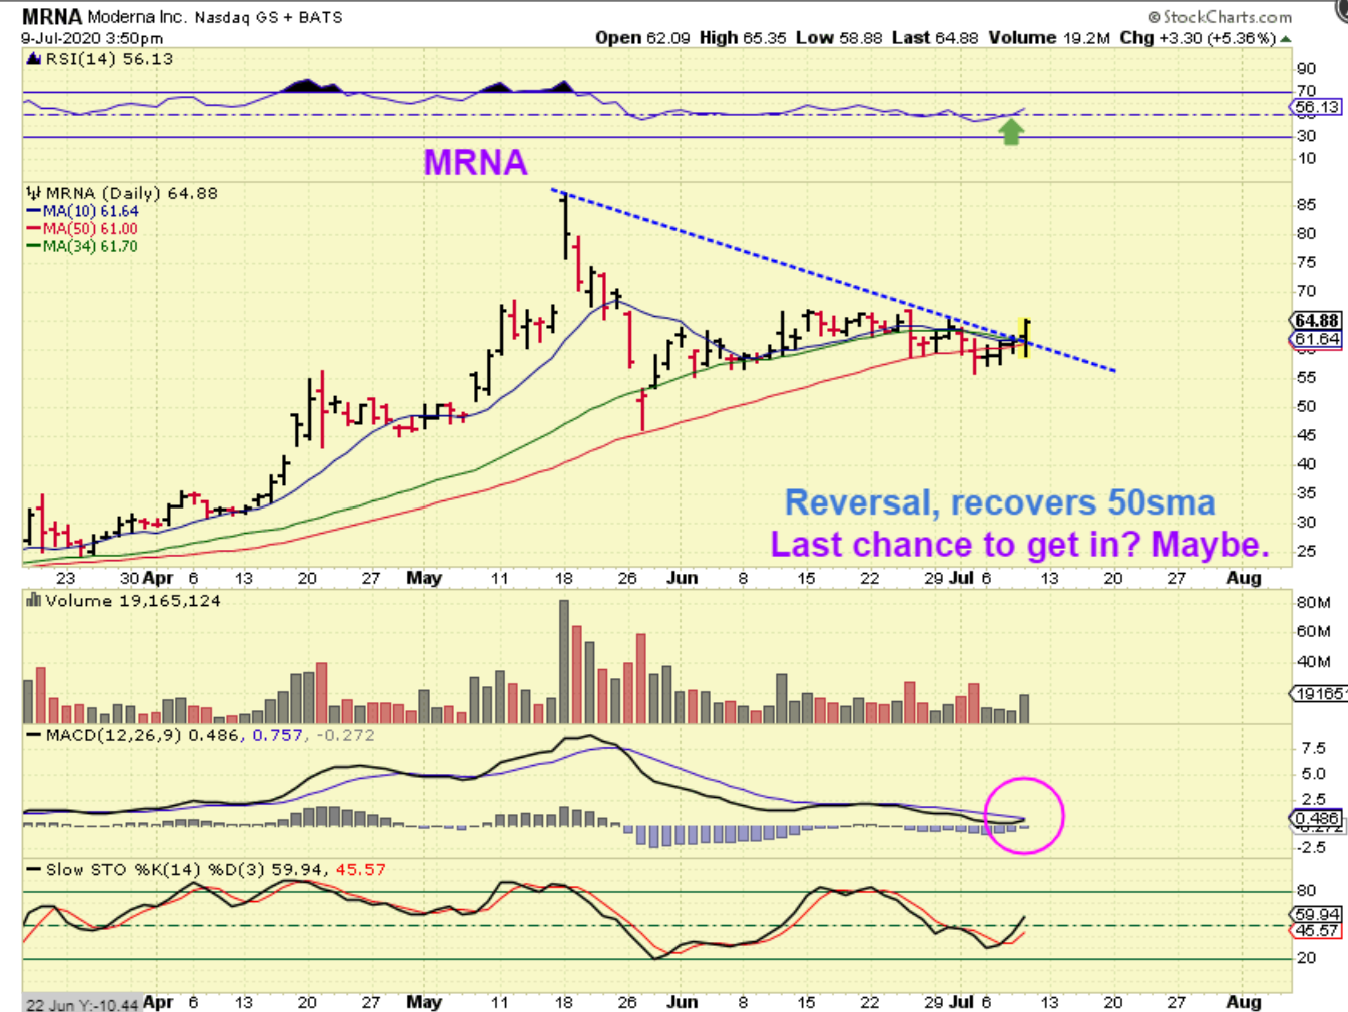
MRNA was posted midday too ( I also tweeted it out) as a Buy opportunity . It was recovering the 10, 20, 34, & 50 sma as a possible shake out. I added to my position.
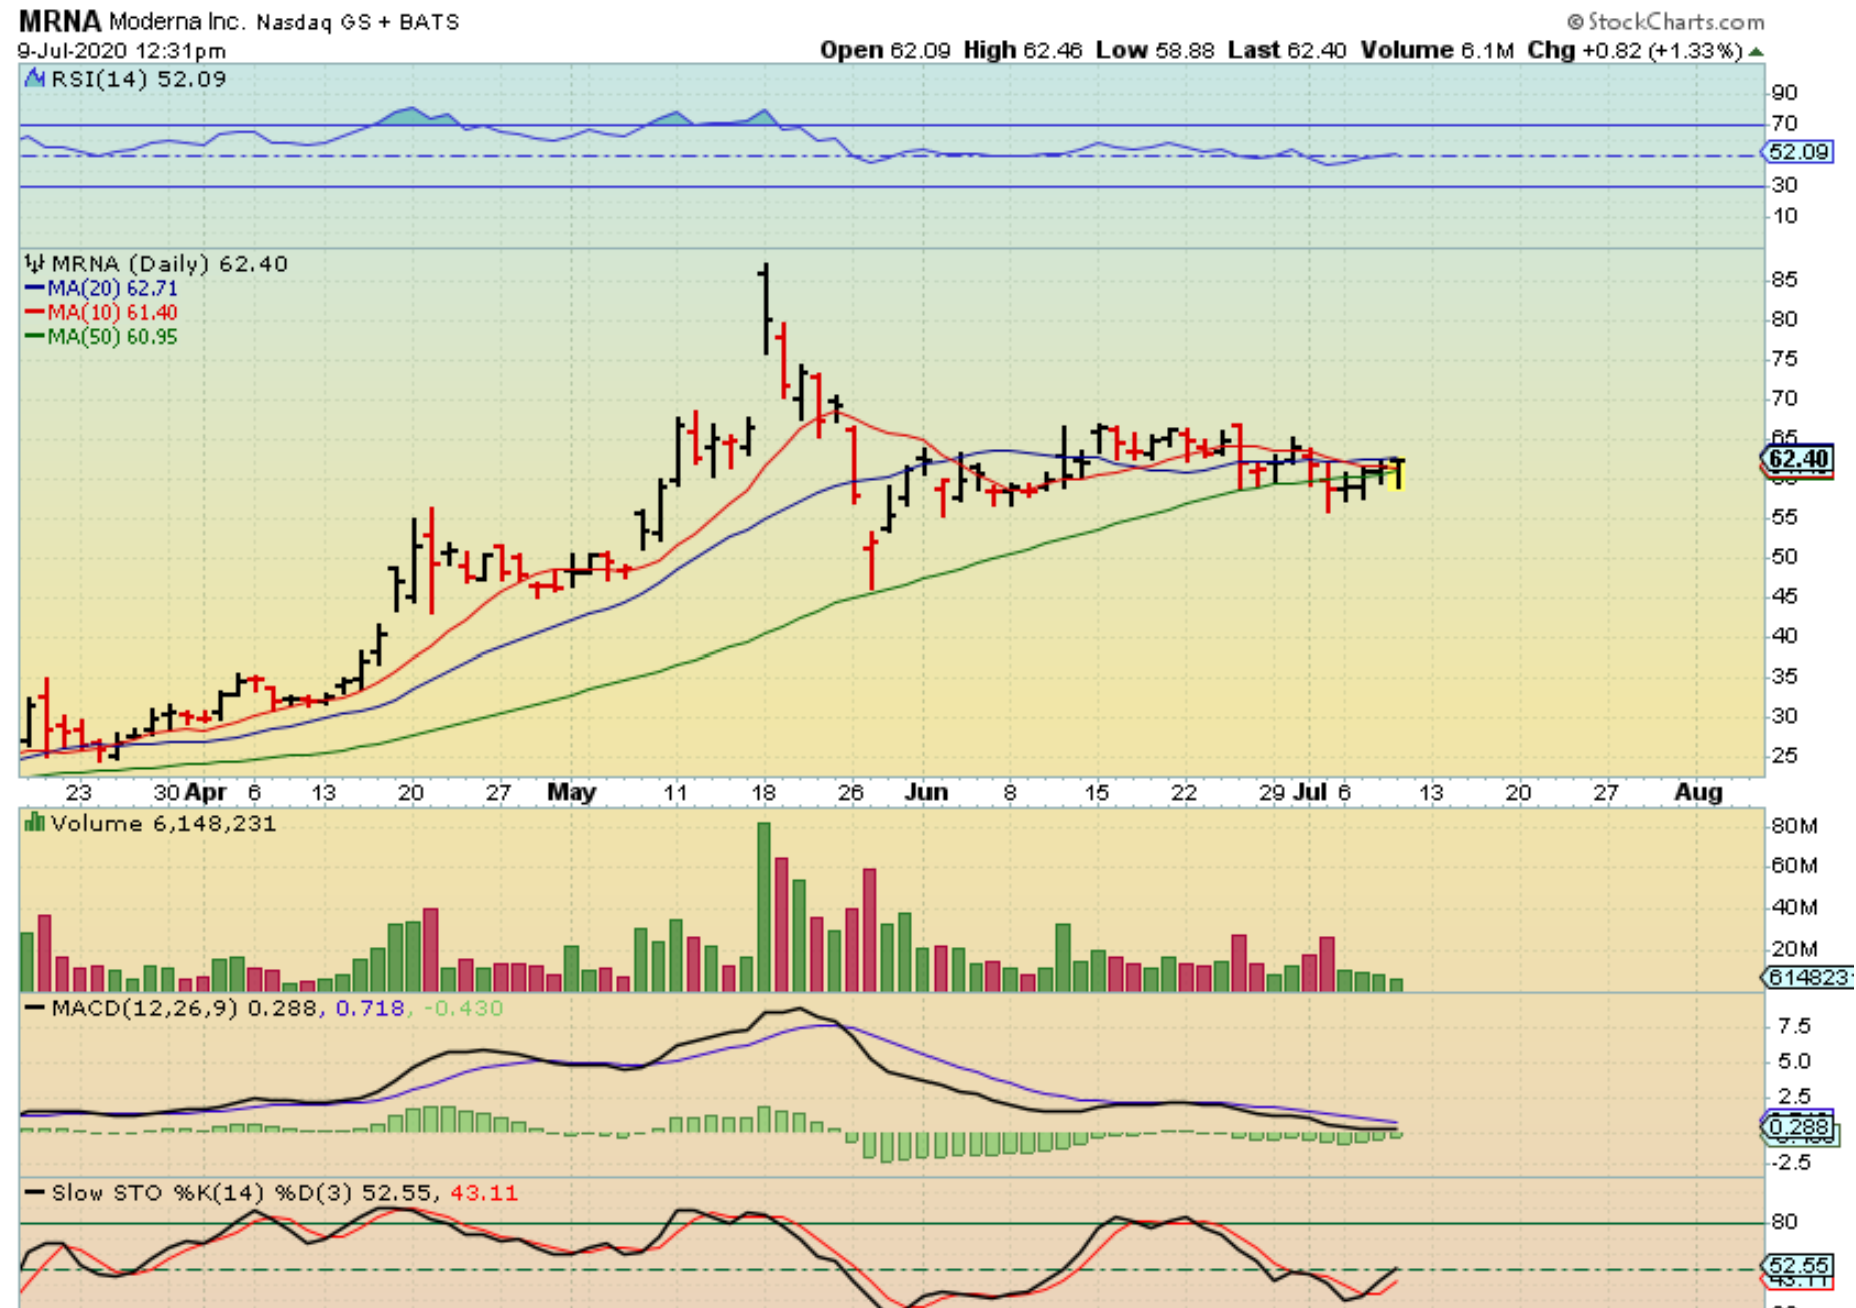
MRNA closed up near $65 and looks even better with a stronger recovery. It was down 15 cents in after hrs, so it may even open lower & become a nice buy Friday. This sector ( Covid-Vaccine) has been ON FIRE. see charts of MRNA ( March to May) NVAX, INO, IBIO, VXRT, etc.
,
Now that THE CHIEF broke out of its base, I want to discuss another one that I have liked.
.
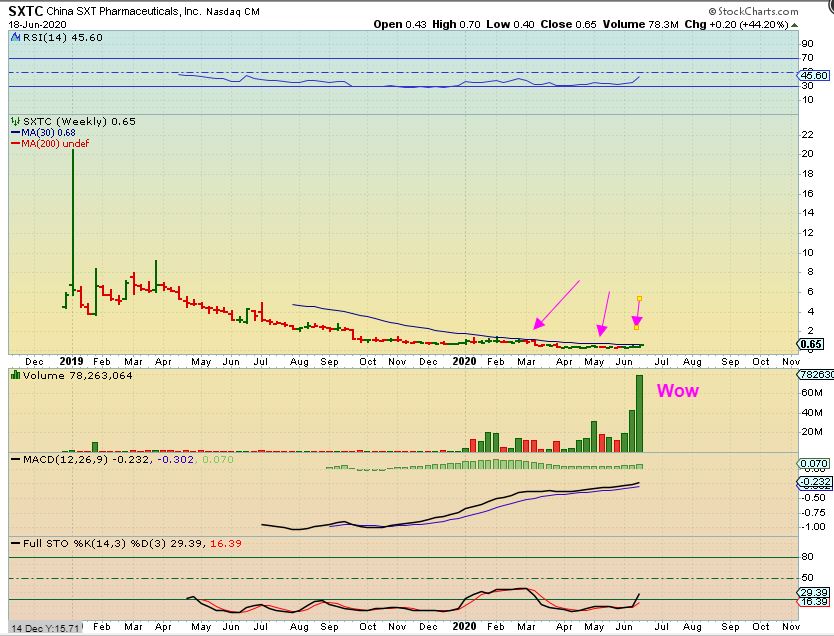
I pointed out the long base set up on SXTC . The volume was eye-catching!
.
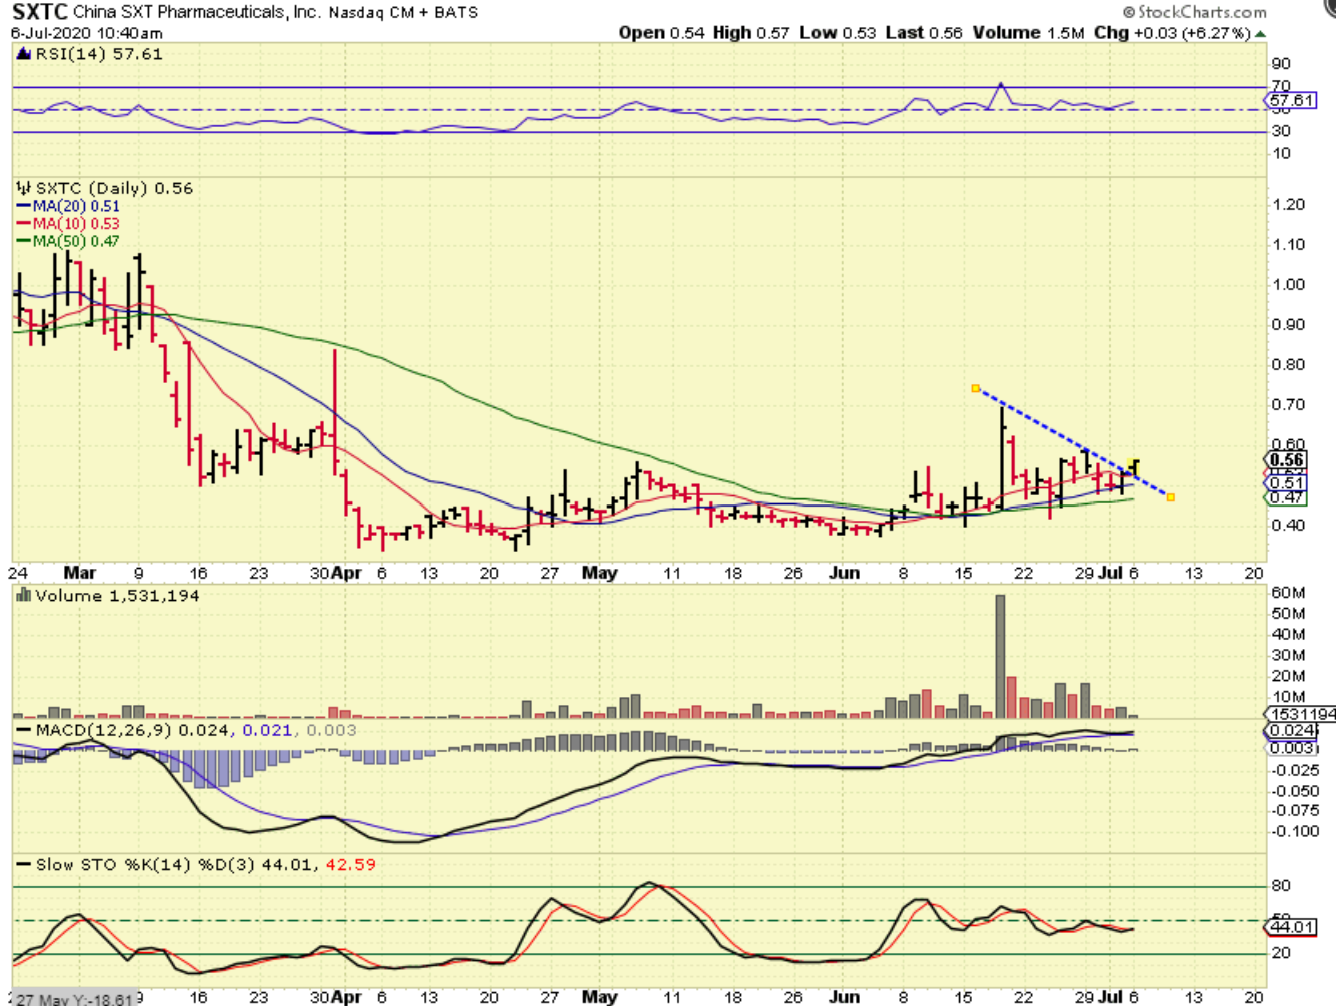
On July 6 – SXTC started to break from a triangle or wedge, so I added to my position thinking that this could be the break out. Well, it wasn’t 🙁 (yet) . Look at the chart, You do see what I was looking at, right? Well…
.
SXTC dropped slightly since then, so now when I look at that last pop, it could be the top of a new larger triangle. THAT IS WHAT THE CHIEF DID before the recent break out!
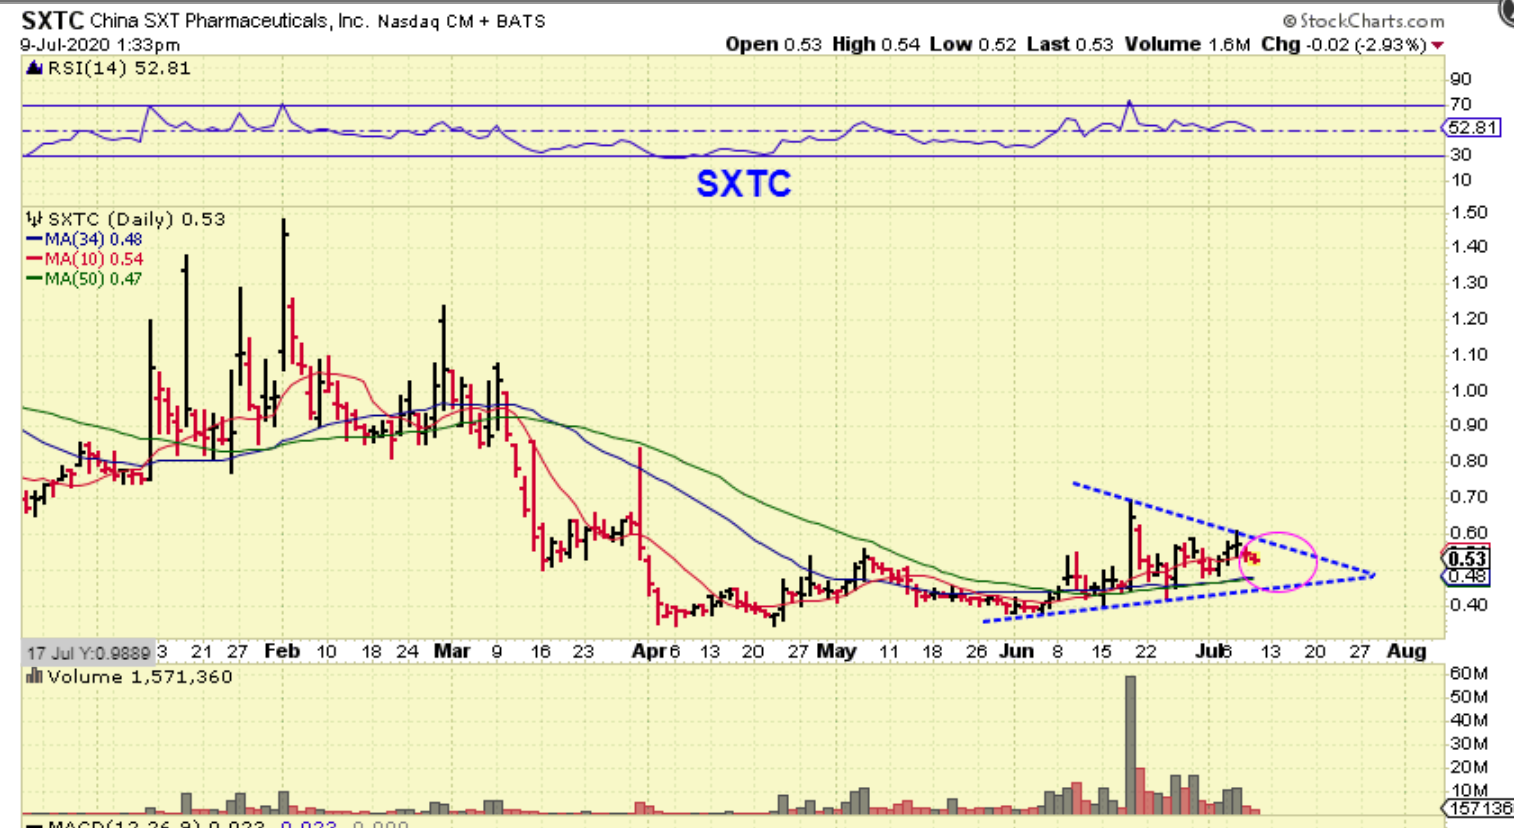
THAT IS WHAT THE CHIEF DID! Remember when every break out simply gave it up. It was a BULL trying to buck us off. It extended the agony & wait period. Well, unfortunately we may be seeing that in the chart above too, with the SXTC chart.
.
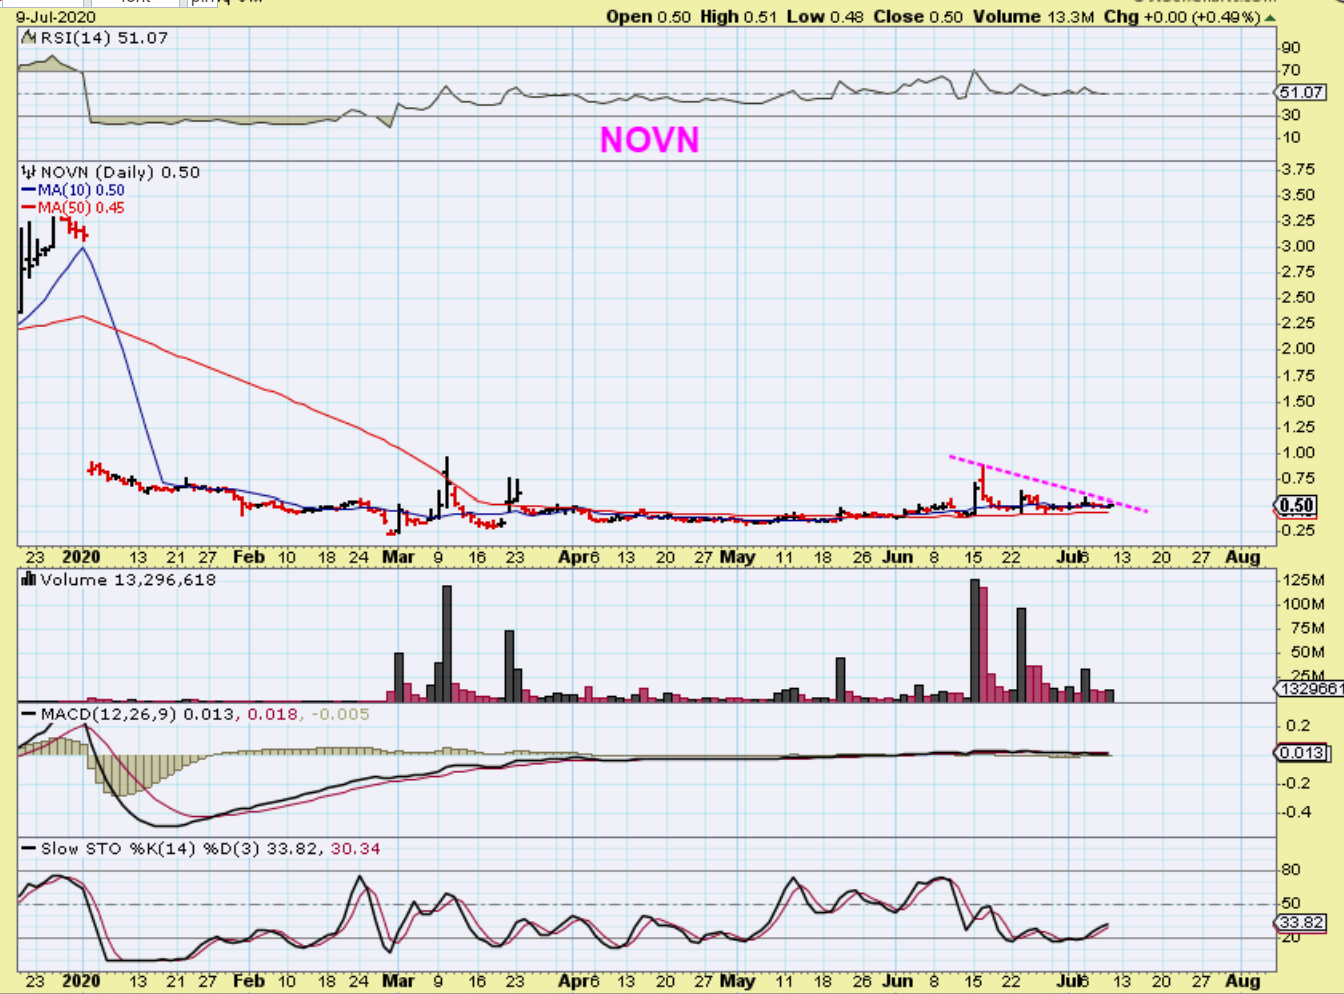
NOVN Is also forming a triangle on a long base, and this is still a swing trade of mine that I am holding.
.
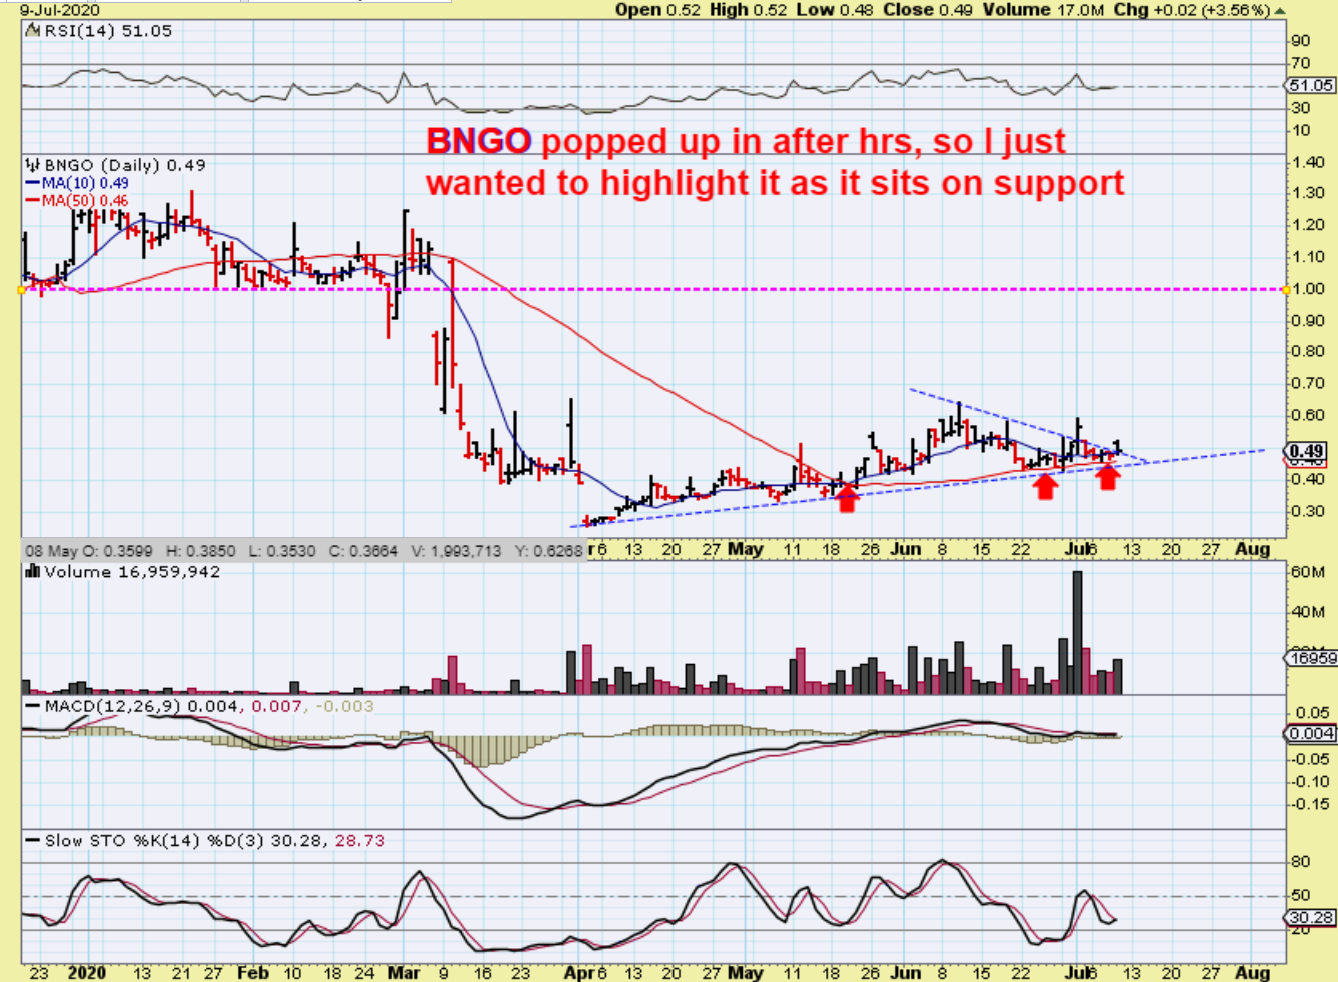
On July 2 BNGO jumped 10% off of support with huge volume, so I posted this chart. Some of us Chartfreaks own BNGO. Did it keep running? Not yet…
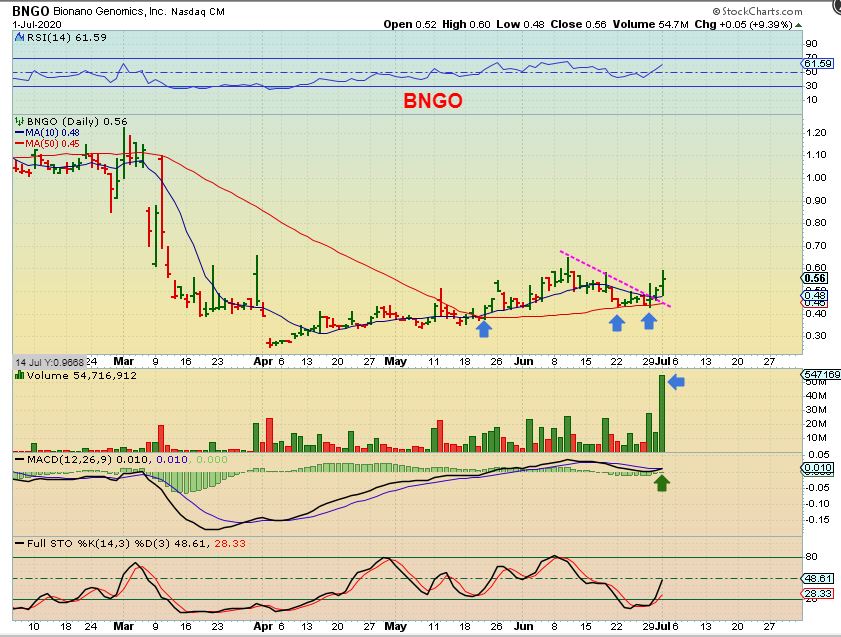
.
BNGO dropped back to support and continued to ride the 50sma. It was up 10% in after hrs, so it may be ready to go? I think that this can double & run back to $1 if it gets going, because there is not a lot of resistance from that sharp drop. I like the volume pattern here too.