July 4th – Long Weekend Report
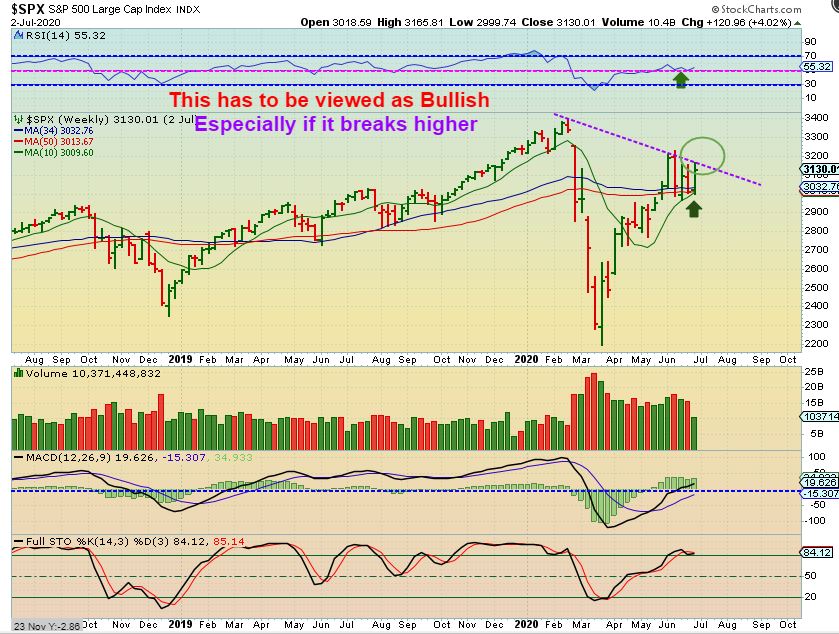
SPX WEEKLY – As mentioned last week, we have a V-Bottom recovery so far and this remains bullish after dipping down into a 1/2 cycle low and finding support on the 10,30, & 50 week ma. The SPX then moved 4% higher for the week. We are at another resistance point.
.
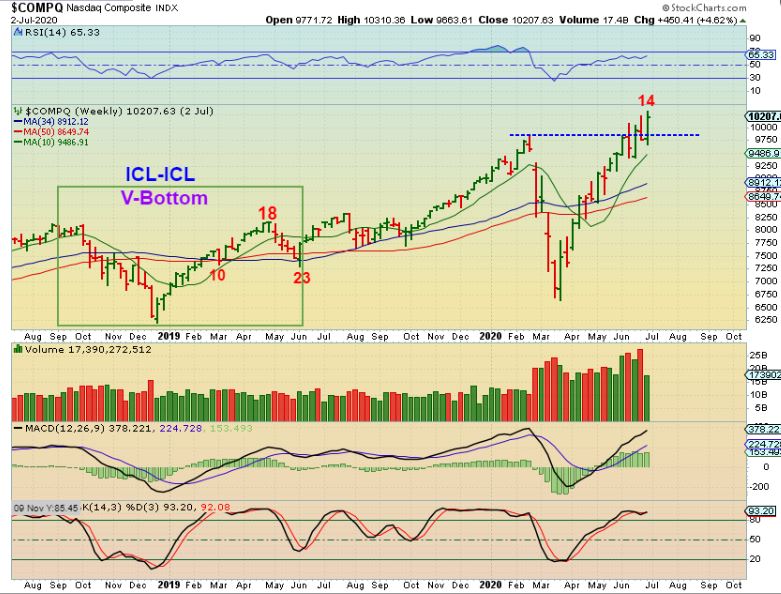
The NASDAQ closed at new highs. Wow. I’ll be honest, even though I did think that we’d get a good 6 month ride higher and then possibly start a bear market downtrend as a result of the Covid business shut downs and lay offs, etc, I did NOT expect new all time highs. Riding with stops has kept many in the trade ‘long’.
.
IT IS IMPORTANT TO NOTE THAT THIS IS THE NOW THE 3rd DAILY CYCLE, IT CAN BECOME L.T. & ROLL OVER INTO THE EVENTUAL DROP INTO AN ICL DURING THE 3rd & THEN THE 4th DAILY CYCLES. THAT MEANS IT COULD PEAK IN 2-3 WEEKS or LESS. I cover that in daily reports.
.
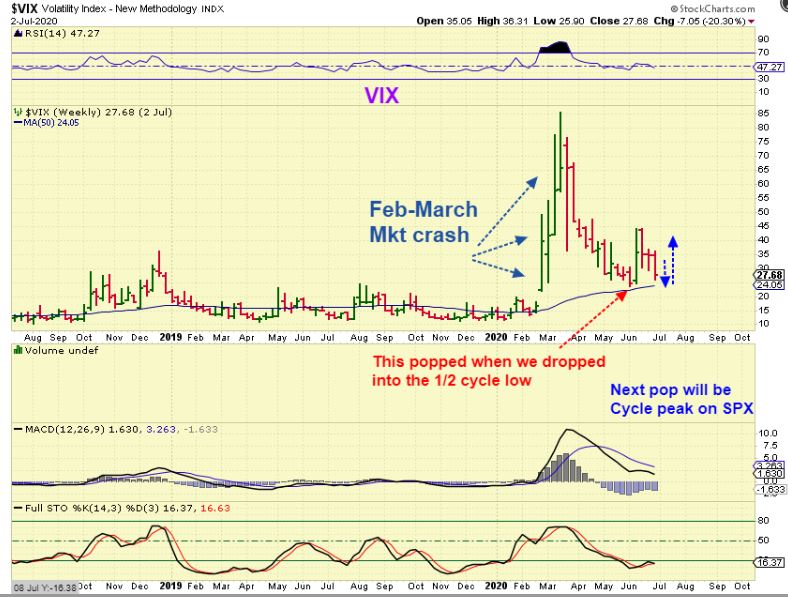
We were watching the VIX for clues and it broke down instead of higher. The large POP was when the markets dipped into the 1/2 cycle low. This weeks small pull back in the SPX looked like a dcl, so the VIX may drop to the 50 week ma (as drawn here) and chop sideways until the Markets peak.
.
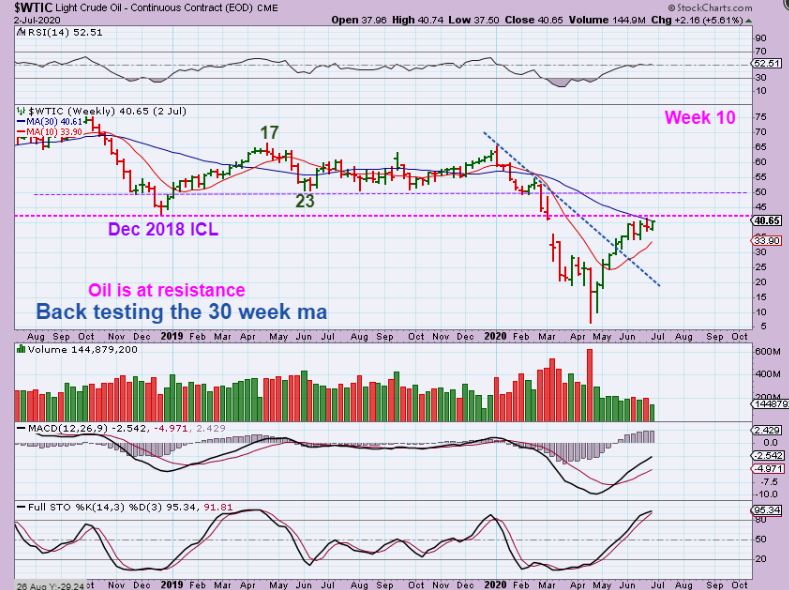
WTIC has also recovered and worked its way higher to the 30 week ma and a resistance point from a former ICL. Oils chart remains healthy too, with this normal sideways chop.
.
WE ARE GOING TO COVER A LOT WITH THE PRECIOUS METALS SECTOR.
.
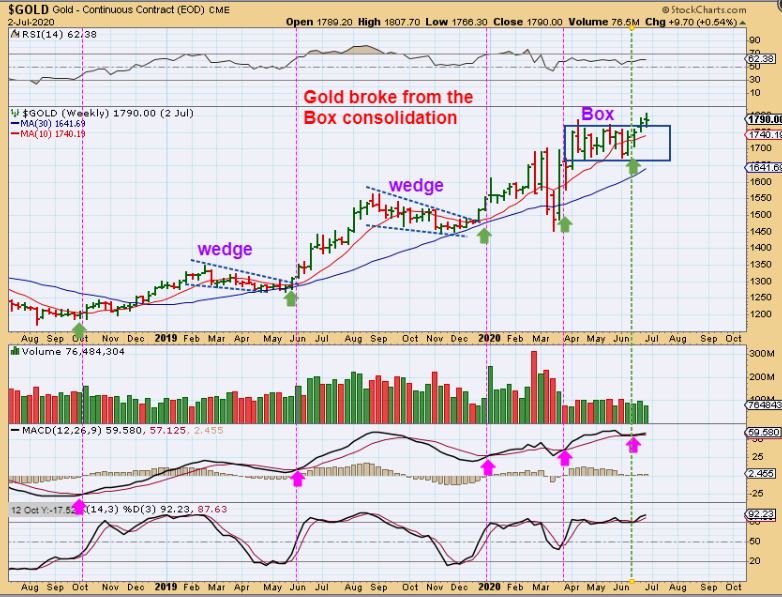
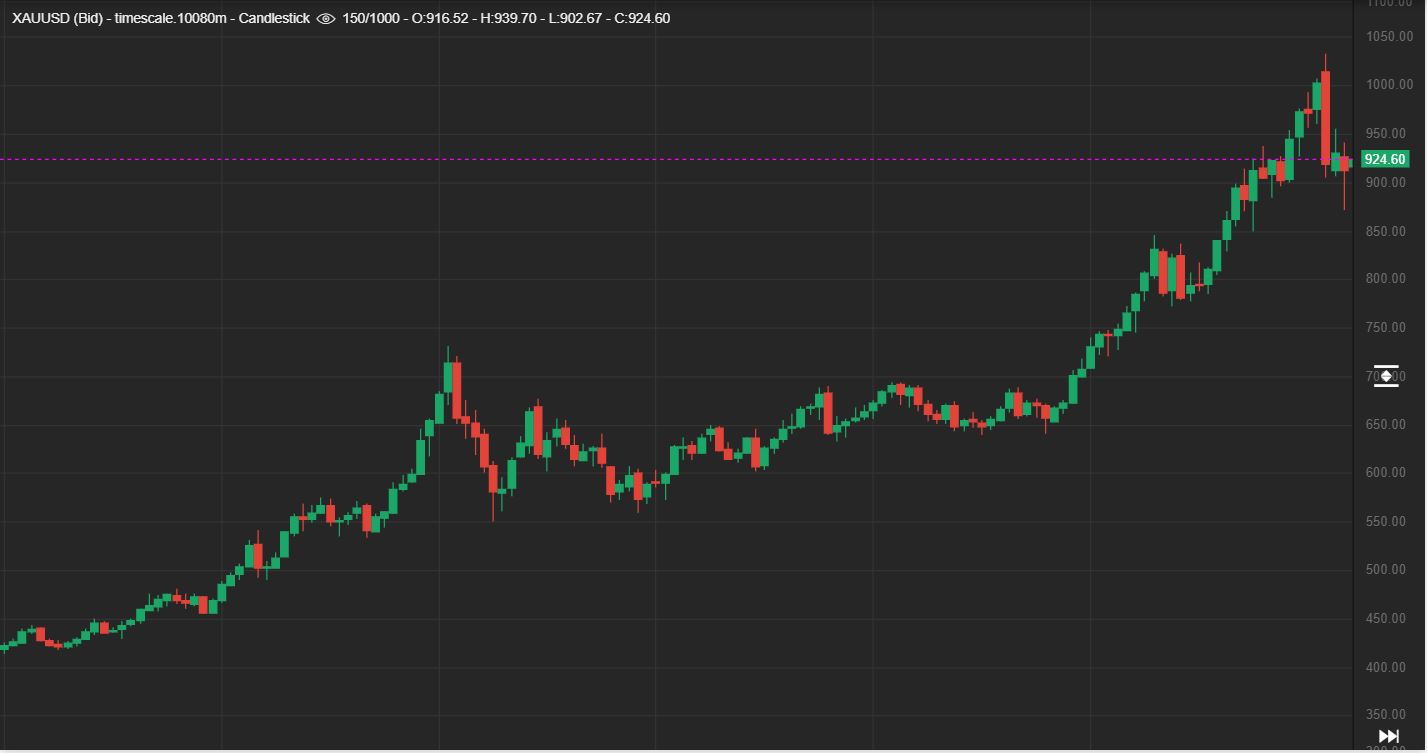
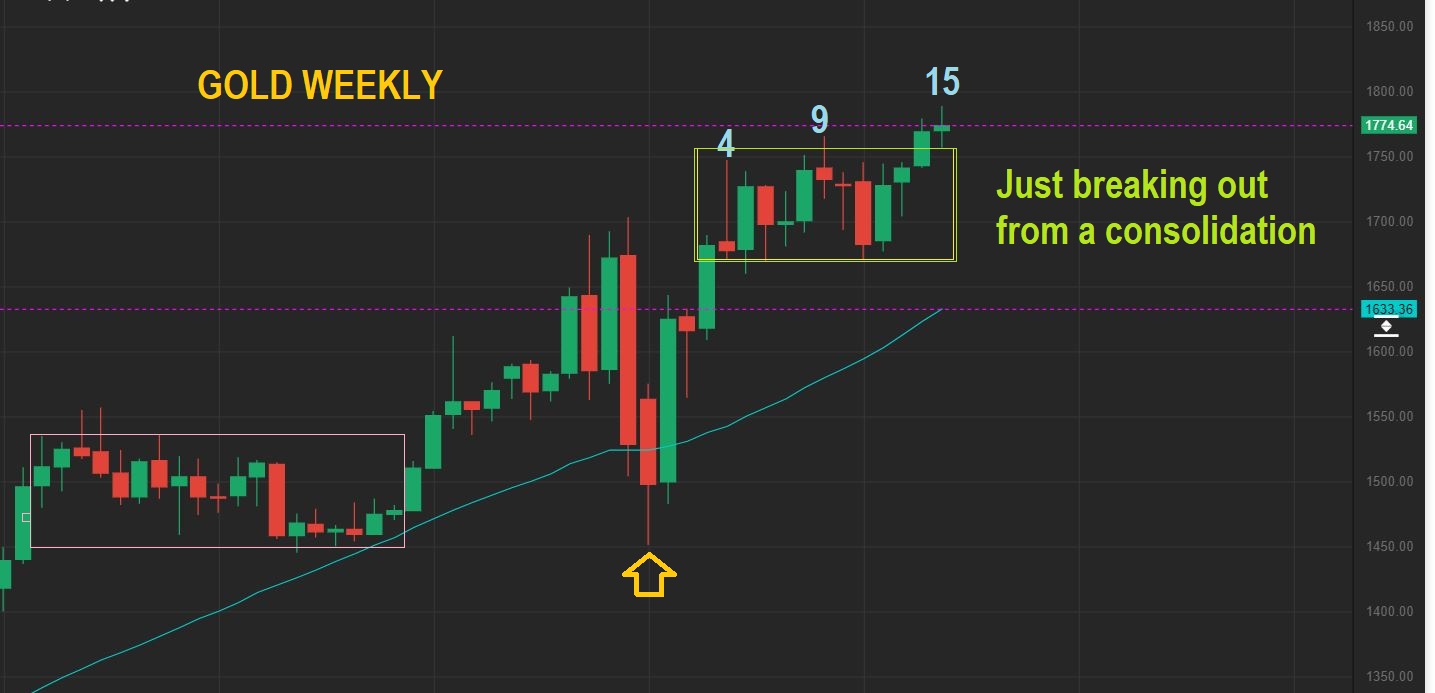
GOLD WEEKLY – I had been pointing out a long (boring) Box consolidation. They are usually bullish and lead to higher prices as a continuation accumulation phase. Gold broke out this week and this should go higher. Golds break from prior consolidations has led to nice moves higher, and this can do the same, but could it become a false break out or back test soon? This is why it could…
.
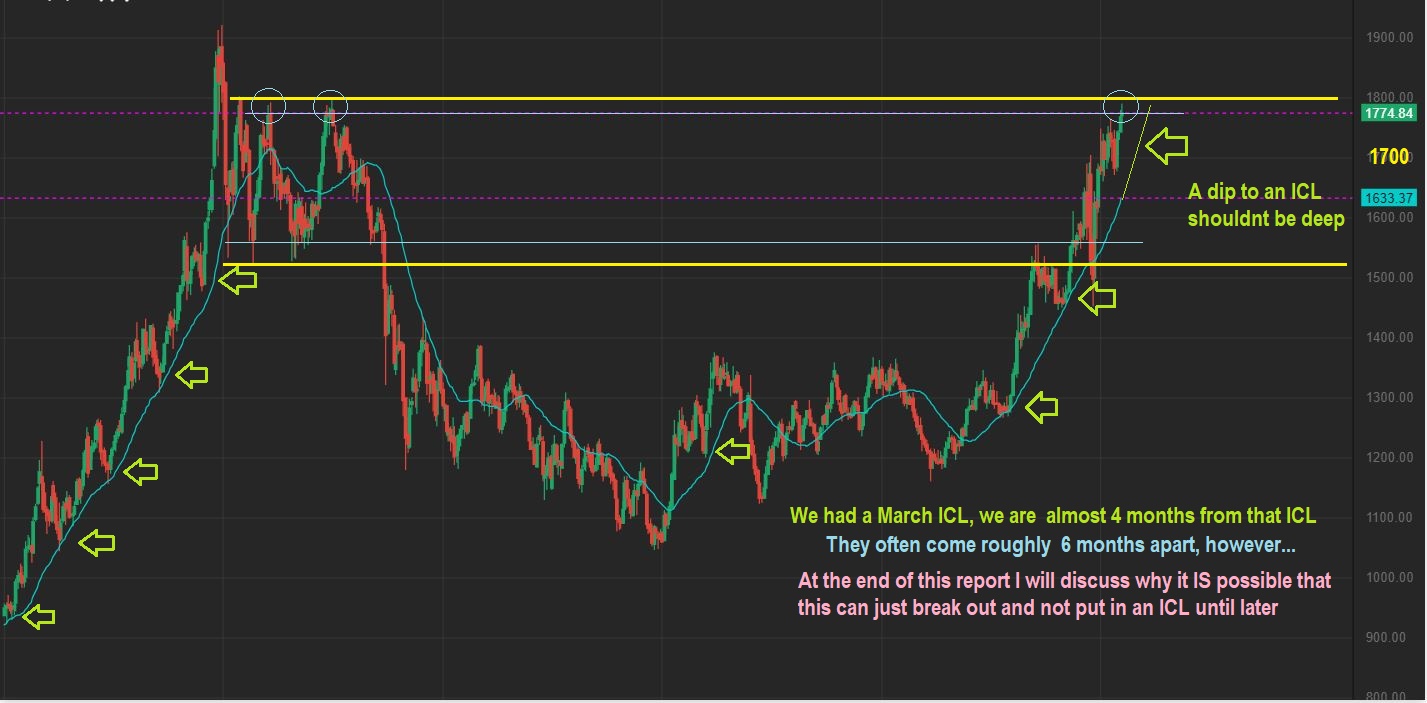
GOLD WEEKLY Big Picture – After making its way through resistance, Gold chopped sideways and started to push higher last week, but remains at resistance. An ICL comes due every 6-7 months on average, so I drew a tag of the green line, but remember— gold is breaking out now. It may just run & back test that BOX as an ICL too. Please read the chart carefully.
.
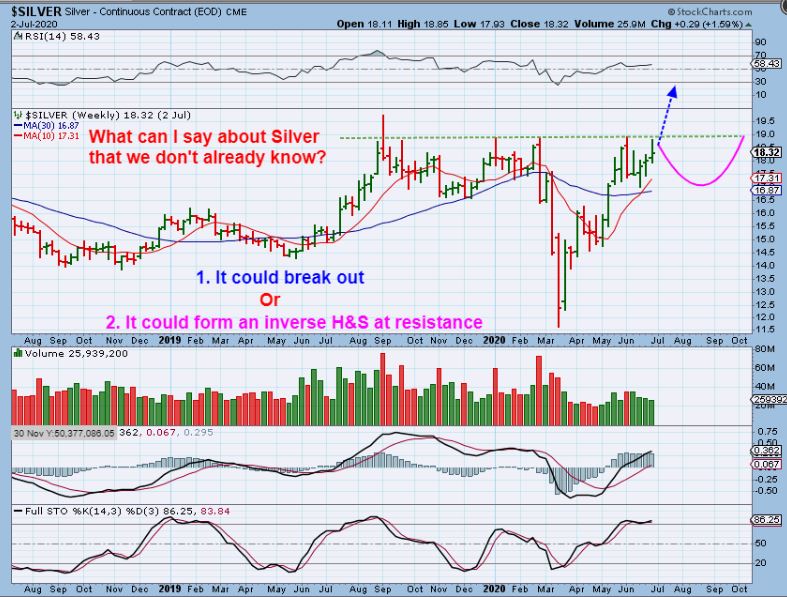
SILVER WEEKLY – Silver is still at resistance too, and I’ve discussed this each week. I’ve drawn 2 possible scenarios on the chart. One is a follow through break out after the recent consolidation, the other is a dip into an ICL (Chop continues).
.
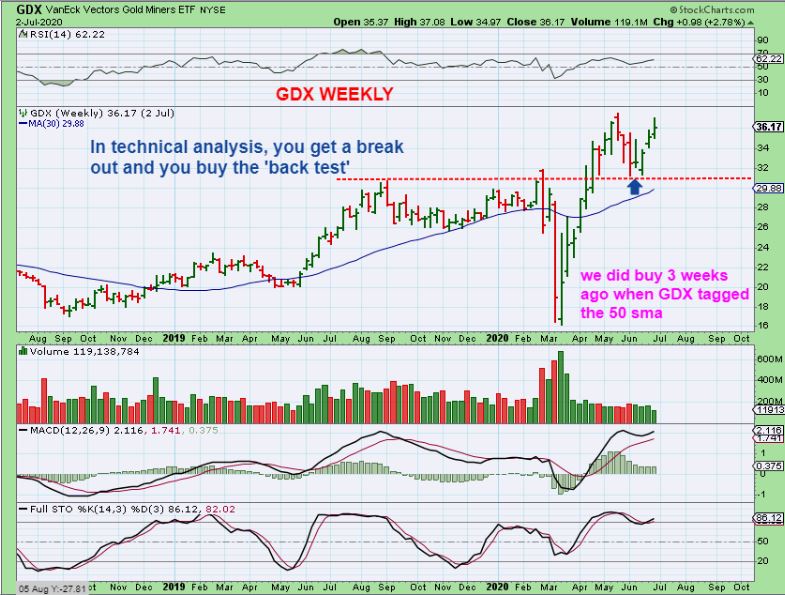
GDX WEEKLY – This really is text Book Technical Analysis action as a break out & back test. It remains Bullish. Can it back test again for an ICL? That is not out of the question, but it also has finished what it was expected to do and could just continue higher. I will discuss possible bullish implications for GOLD to just break & run higher at the end of the report, and Miners would go higher.
.
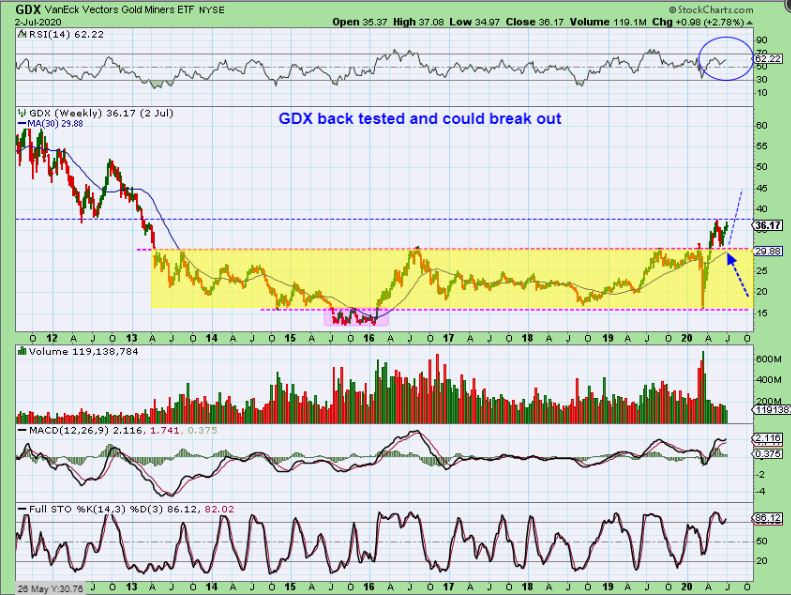
GDX WEEKLY – So you can see that GDX could become range bound unless it continues to break out further.
…
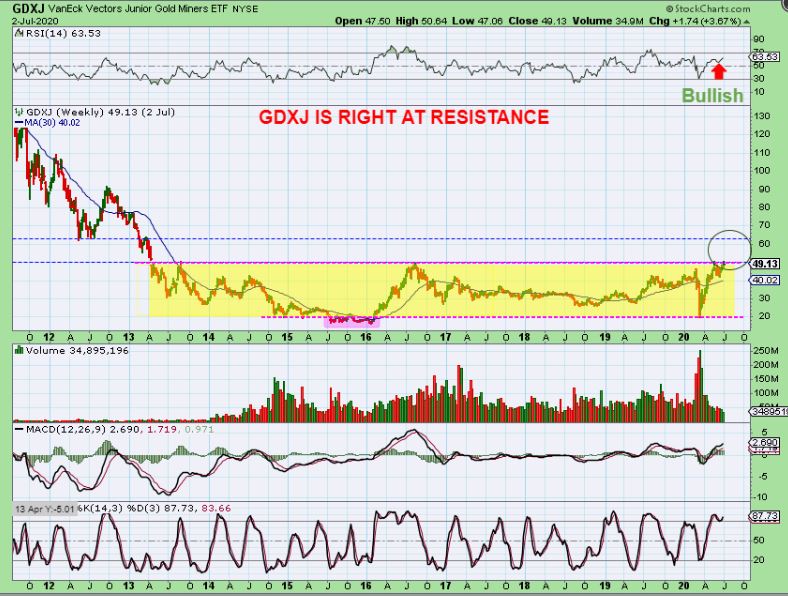
GDXJ WEEKLY – A break out here should send price to that $60+ area. Juniors seemed to do better than the bigger Miners last week. The RSI bounced at 50%
.
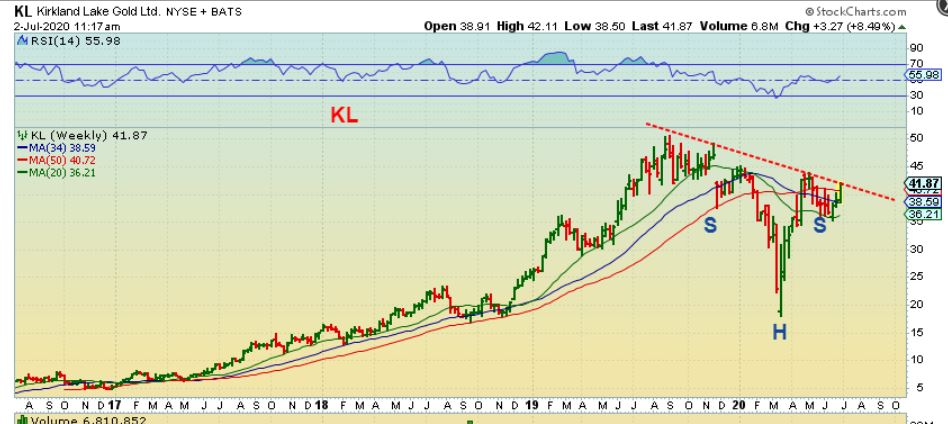
KL WEEKLY : I posted this in the live area Thursday and wanted to put it here too. KL had an exceptionally Bullish run 2017 to 2019 and when it finally breaks free from this down trend, this could easily double over time ($40 to $80+). The first target would be roughly $65.
.
There really does appear to be a good amount of bullishness in the various sectors of the markets. That can change a weekly chart with one bad week, but so far the pull backs have been normal and the direction has been choppy or up. Stops in reasonable areas will keep you in the trade, since the weekend reports are more of the Big Picture View. After doing some additional research, I have a lot to discuss below, so be sure to read that section too.
.
Enjoy your weekend everyone!
.
~ALEX
.
THINGS THAT I FEEL YOU MAY NEED TO SEE: I have said to many people about cycles, I use them as a Guide, not a rule. WHY? I have seen cycles stretch, I have seen them fade (becoming very mild), and so on in a bull market. In a Bear market, I find they act very very predictably, but in a Bull Market, they can throw people off. I will show you what I mean below.
.
THIS IS A LOT TO TAKE IN, I HOPE THAT YOU CAN FOLLOW IT.
.
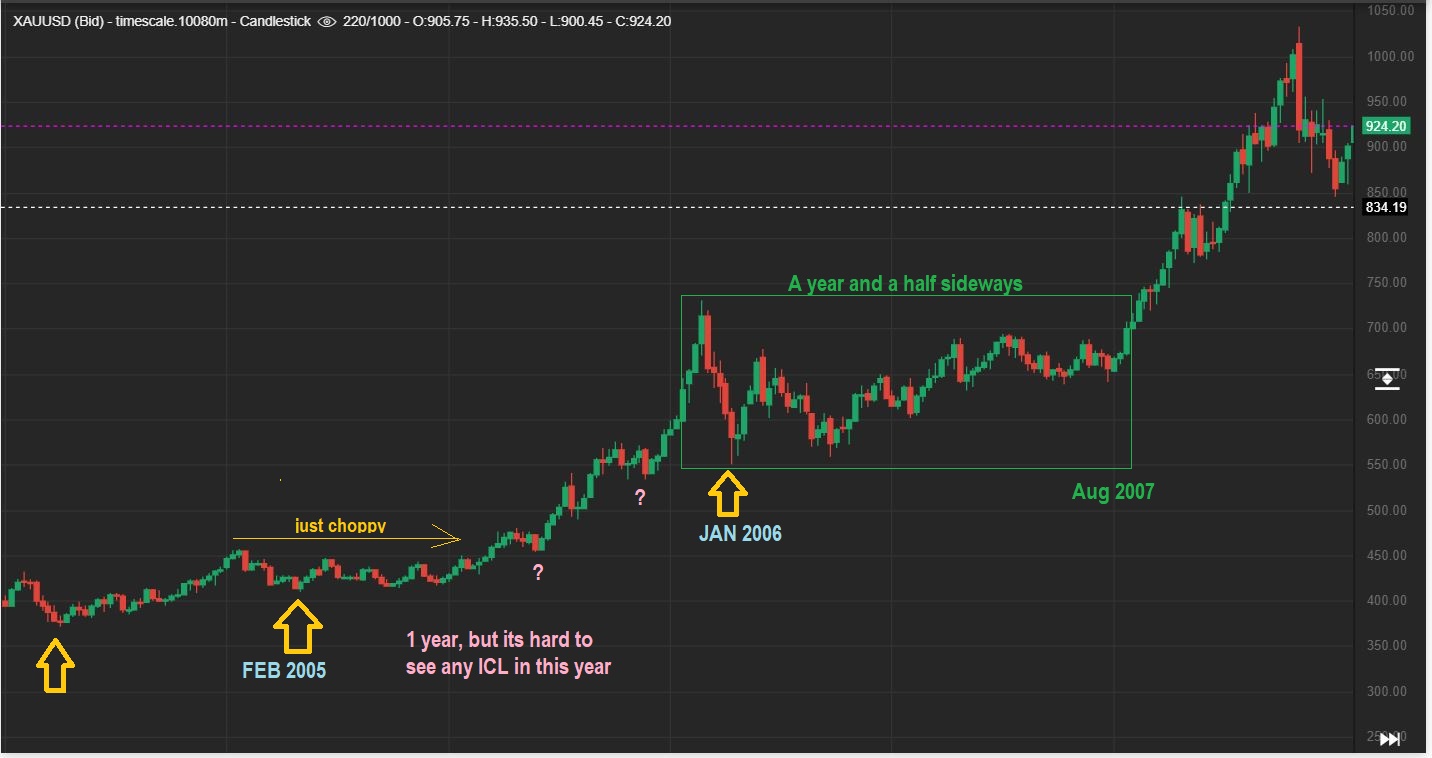
GOLD WEEKLY 2005 to 2007 – I am going to discuss a few GOLD BULL RUNS in greater detail, but just look at this chart. In 2006 , after a strong run up in 2005, we had a LONG PAN & HANDLE shaped consolidation. That was BRUTAL as I rode that out, but it was also bullish. The little BOX consolidation that we just had is NOTHING compared to some of this sideways chop. This chop is hard to predict using cycles. Where is the next ICL after that first sharp drop at the start of the Pan?
It isn’t always clear – so now let’s discuss ICLS in choppy times…
.
GOLDs PAN & HANDLE –
1. Look at the Feb 2005 ICL. Where was the next one? It is vague.
2. Look at the January 2006 ICL. Over 1 year sideways and no real visible ICLs.
3. My point? Simply that ICLs in Bull Markets can be mild and tricky (and choppy). Consolidation takes over in Bull Markets.
4. This often happens at resistance unless it can break out.
.
Now let’s look at something else annoying about GOLD MARKET BULL RUNS & Cycles 🙂
.
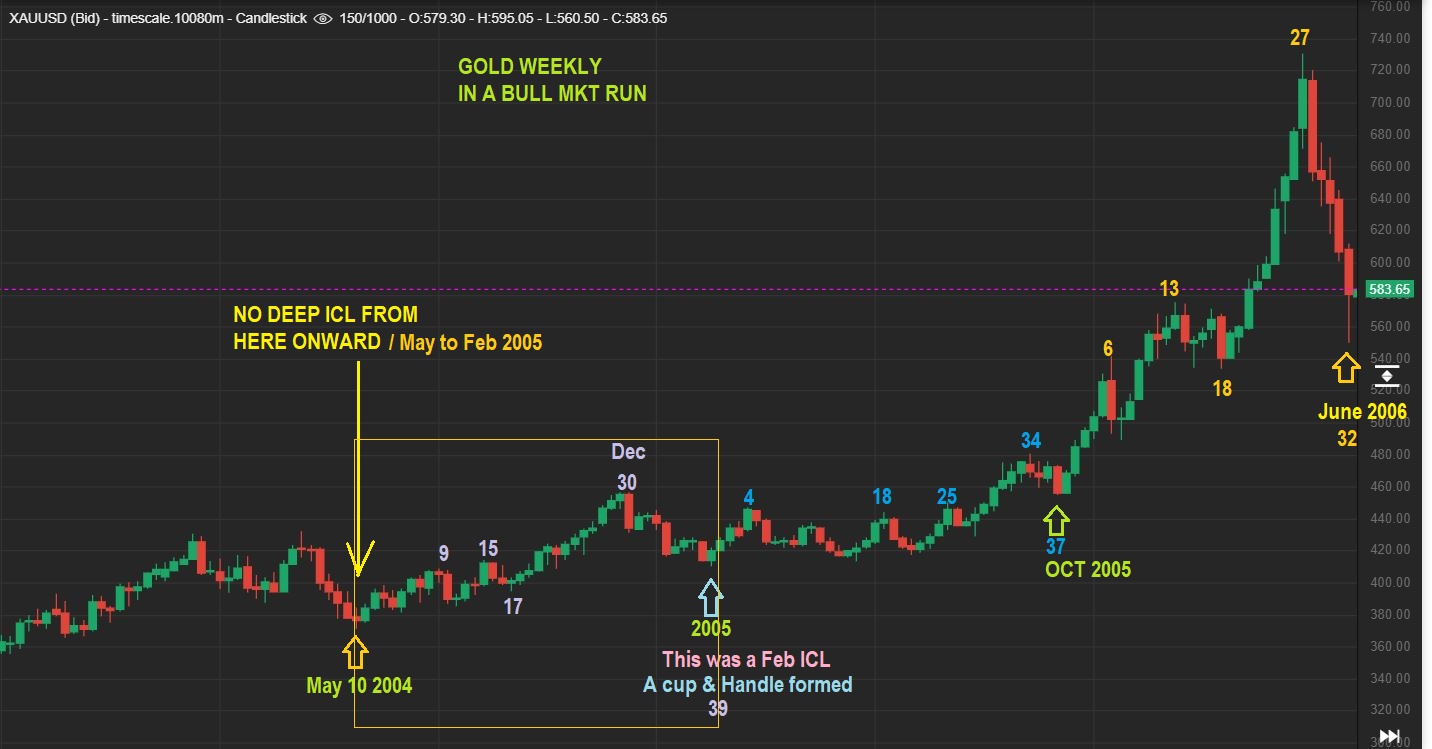
GOLD CYCLES – Look at the yellow box from May 10, 2004 to Feb 2005. That is 9 months ICL to ICL. We are currently on month 4, so I wanted to point this out. YELLOW BOX – Did you notice that it ramped up after week 17?
.
GOLD CYCLES SAME CHART – ICL May 10, 2004 to ICL Feb 2005. That means that this ‘peaked’ on week 30. We discussed this week that a peak can happen at week 15 or 17, but in a BULL RUN, you can’t rely on that.
Now look at the intermediate that follows that Yellow box…
.
1. ICL FEB 2005 onward was sideways & choppy. Do you see week 4 in blue? Then week 18, then week 25? Maybe we saw an ICL at week 15 (?), but then that would be extremely L.T. with a week 4 peak, right? So we go to week 34 peak and a MILD ICL at week 37, Oct 2005.
2. CYCLES CAN THROW YOU OFF IN A CHOPPY BULL, I USE THEM AS A GUIDE. I USE TECHNICAL ANALYSIS AND OTHER METHODS THAT HELP OUT ALONG THE WAY.
.
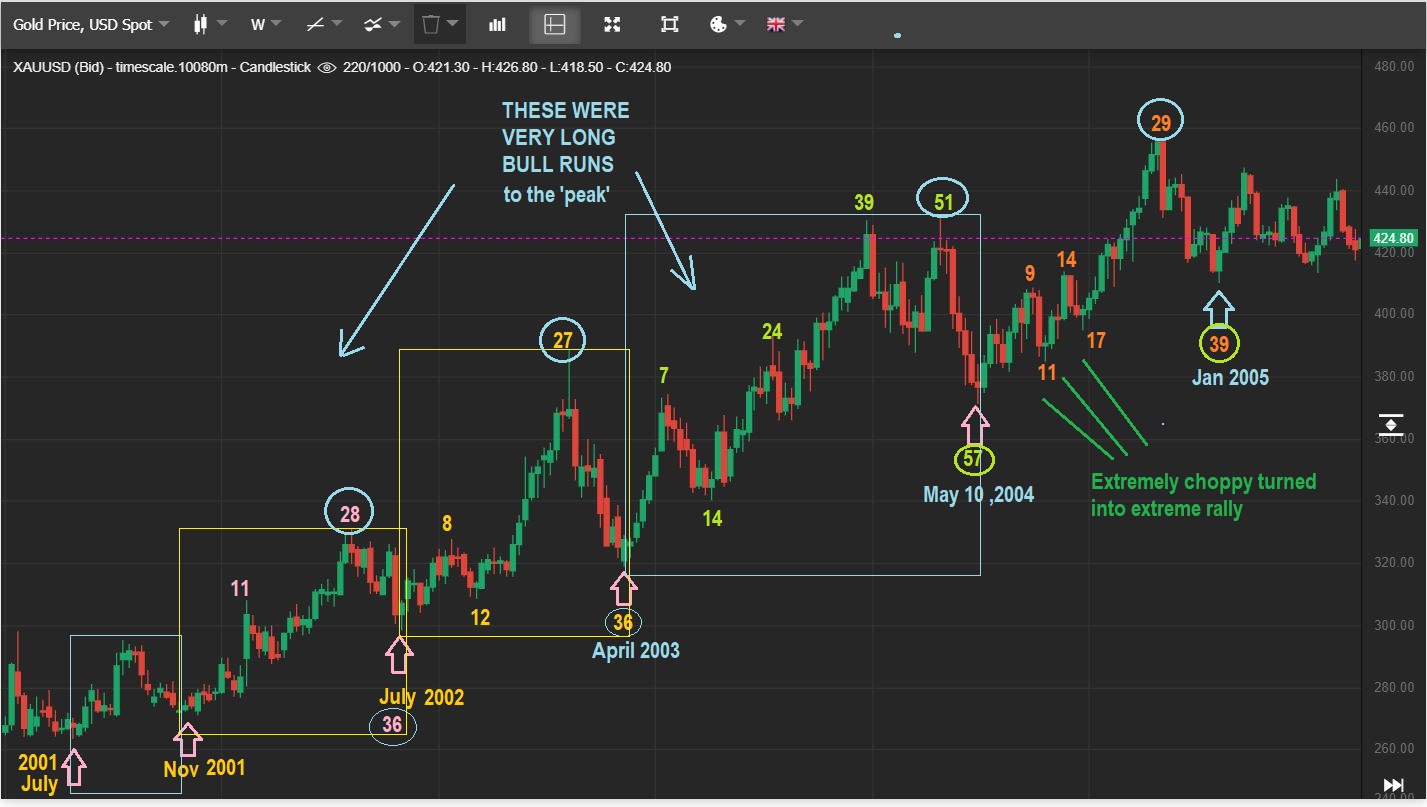
GOLD BULL RUN FROM 2001 to 2006 / CYCLES & ICLs – This is when the bull began in 2001.
1. The first daily cycle was short, 4 months July to Nov, and peaked on week 7.
2. The 2nd Intermediate cycle was a 28 week peak of 36 weeks. Nov to July (7.5 months).
3. The 3rd one was a big run, then a big drop. Peak week 27 of 36 weeks. July to April. ( also 7.5 months) .
4. look at April 2003. That is not an ICL on week 14 , it went straight up for 6 weeks, no daily cycles in between. THAT MEANS that was April 2003 ICL to next MAY 2004?! That rally went from Great to horrible. Week 49 looked like an ICL, I would have gone full leverage into week 51 and then a crash May 2004.
5. Next was May 2004 to Jan / Feb 2005. A PEAK on week 29 after very choppy start. WHAT IS YOUR POINT ALEX? My point?…
.
My point? SAME CHART, focus on the 2nd half…
Look again at starting point of May 10, 2004. What did I write in green writing through week 17? Choppy, choppy, choppy to week 17- then blast off to a peak week 29. My point is that we were currently in a choppy box consolidation, we broke from a box consolidation on week 15…
.
This is Gold right now. We just chopped in a box to week 15 here too. So this certainly CAN go higher based on what I saw in 2003 & 2004. What if it peaks on week 25 or so? If GOLD breaks to new all time highs, it will probably take off to $2000+. THat is a valid point to keep in the back of our minds. I did this extra research to show past cycles that just blasted off after choppy times. Now let me show you more…
.
Now let me show you more with Cycles in a Bull Market. This is after the Crash in 2008…
.
POST 2008 CRASH –
1. The 1st Intermediate Cycle peaked week 17 & bottomed on week 24.
2. The 2nd IC peaked week 34, bottom on week 43. (We are on week 15).
3. The 3rd IC Peaked 20 of 25
4. Next a Peak 22 of 26
5. Peak parabolic week 32 of 35.
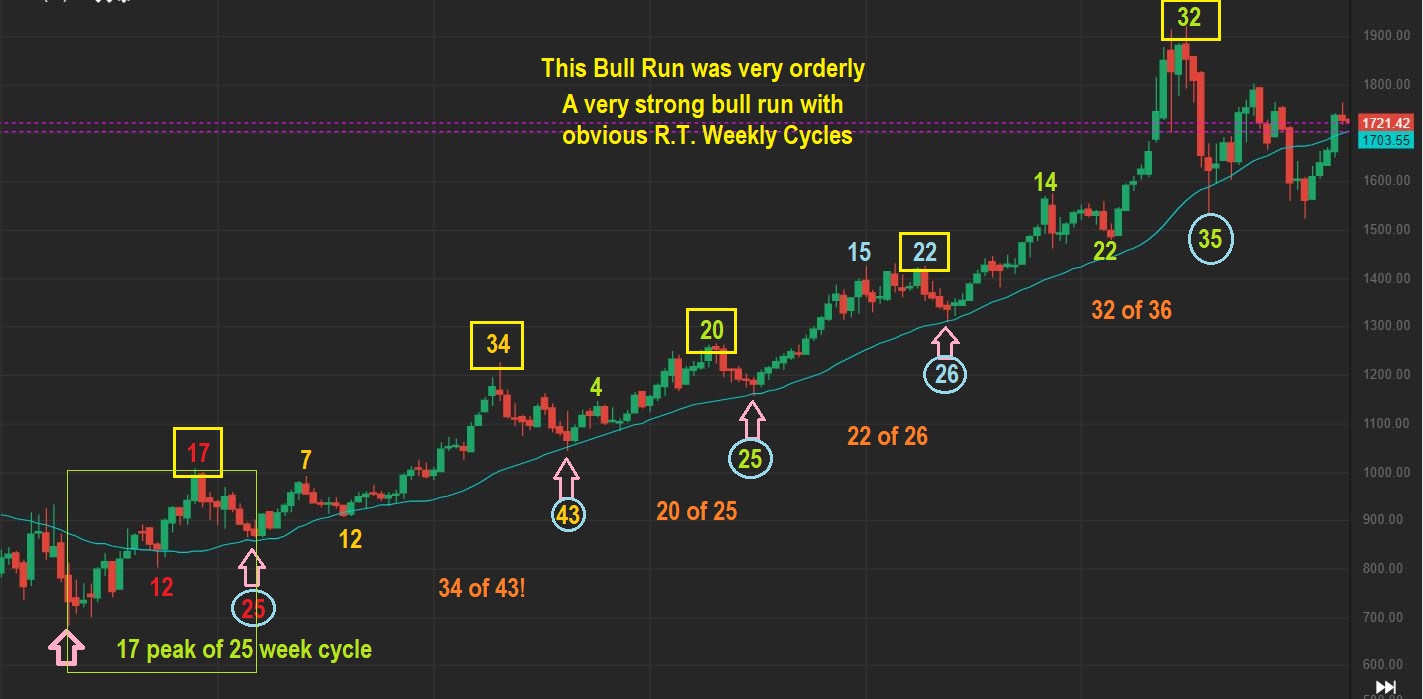
Again, we are on week 15, possibly breaking out from a Box consolidation. Look at that 200802011 run again. Several of those runs above peaked after week 20. In a Gold Bull using cycles, we could have a few more weeks of upside with an ICL due on avg 6-7 months after March ICL. If we just Stay Frosty and use stops, we should be just fine.
.
FOR THOSE IN CHFS BASE: Again Alex? Yes 🙂 Obviously there are no guarantees, but let me show you what I love about the base in CHFS, using NVAX ( or INO or IBIO)…
.
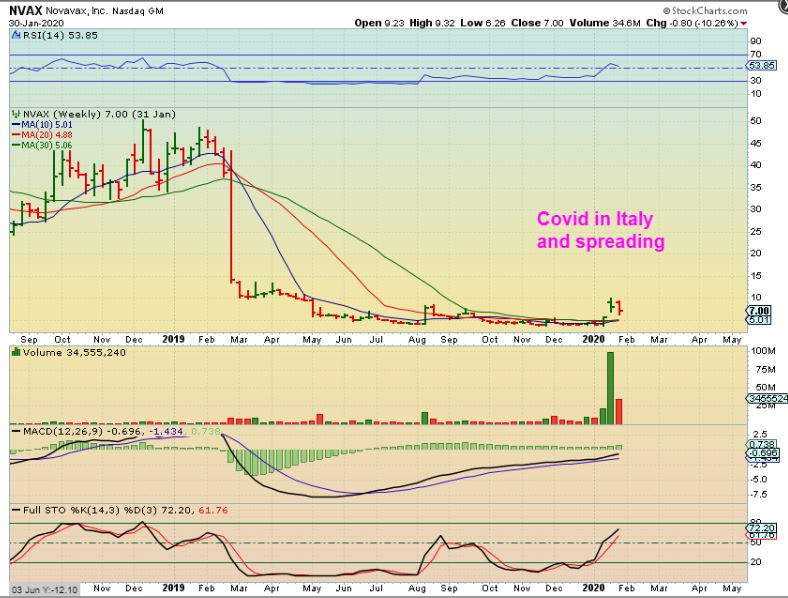
NVAX Formed a tight base after selling off too. In January it had some high volume pops as COVID spread from China …
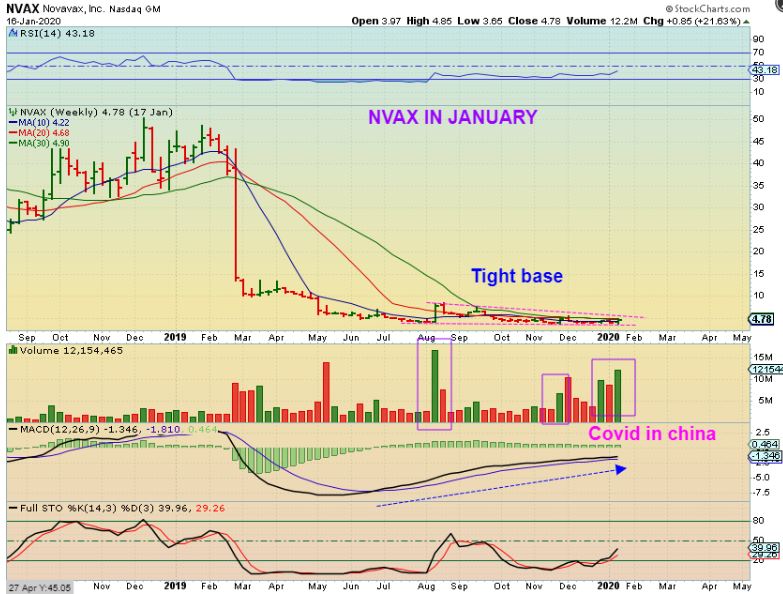
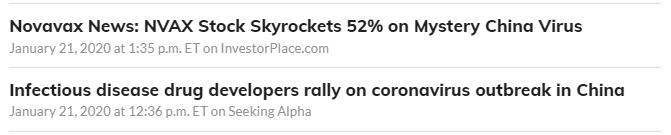
NVAX NEWS DATED JAN 21, 2020 : They work on infectious disease treatemnt, vaccine , etc. THIS WAS THE FIRST POP FROM THE BASE…
NVAX BASE – The pop from the news that COVID was spreading and NVAX was working on it. This was a big pop from a tight base, but it started to drop again…
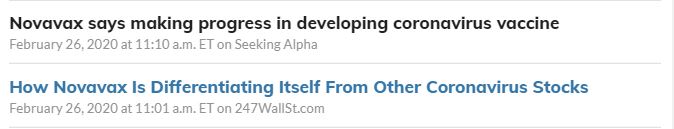
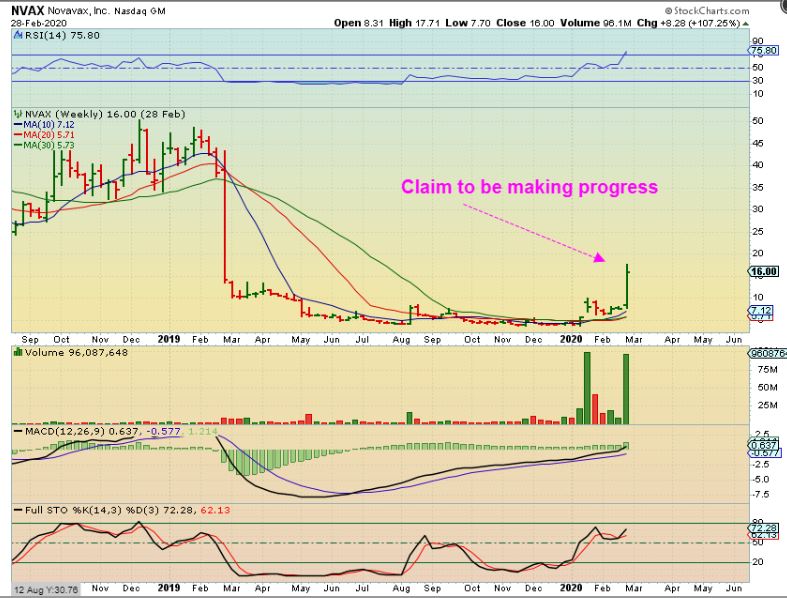
NVAX NEWS DATED FEB 26 – MAKING PROGRESS ON VACCINE DEVELOPMENT
NVAX BASE – WHOA! over another 100% Pop that week.
NVAX BASE – AND THE REST IS HISTORY. TIGHT BASE AND A MASSIVE RUN.
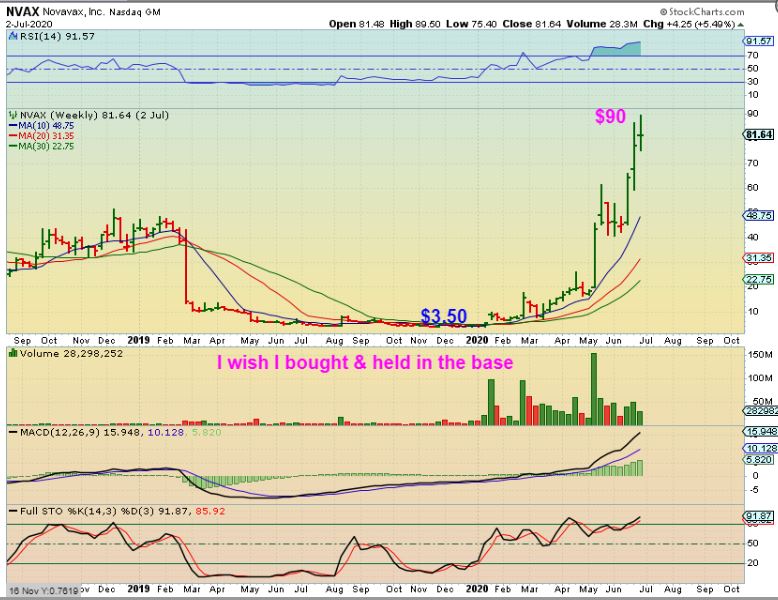
BACK TO LOOK AT THE BASE – A tight base with volume pops …
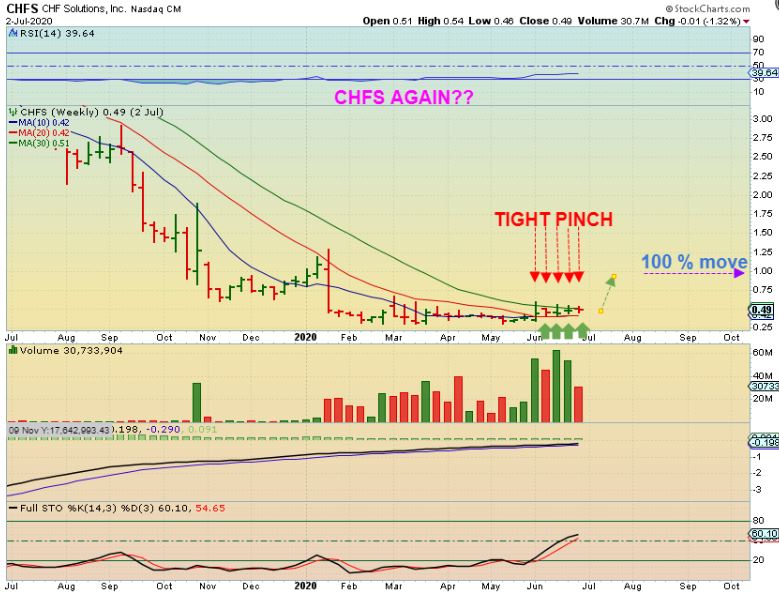
CHFS BASE – A very tight base and volume pops here too, with news of COVID patient care.

CHFS BASE – A very tight base and volume pops here too, so I simply put 5% of my account in it and wait. It worked on VISL, NAKD, BNED, and others. This and CHEK are by far the best looking bases . I think that any positive news release will pop this , because it looks to be under accumulation to me, NO GUARANTEE, but I like the investment.
THESE TRADES ARE DIFFERENT, AND MAY NOT BE FOR EVERYONE. I CAN SIT AND WAIT AND JUST SEE HOW IT PLAYS OUT, BUT IF YOU ARE NOT HAPPY INVESTING IN A CHOPPY BASE FOR WEEKS, JUST EXIT ON A BOUNCE.
.
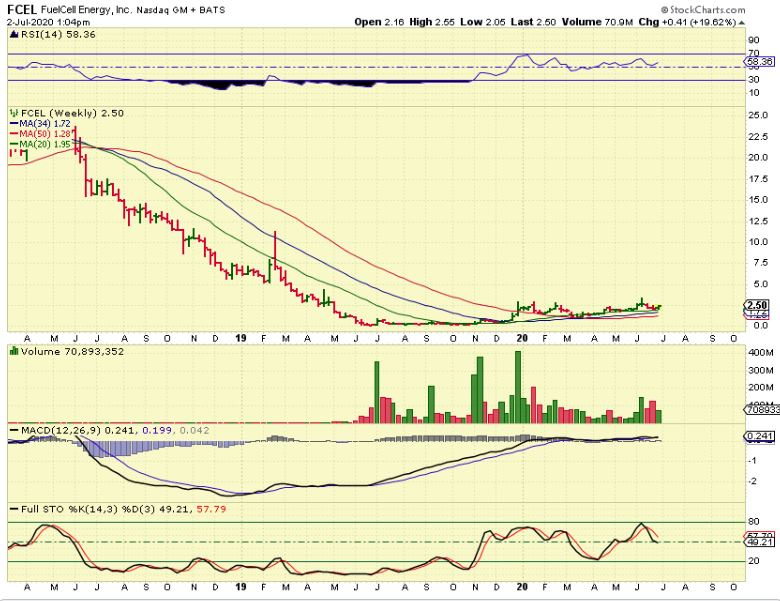
FCEL BASE – I also said that I bought FCEL, after BLDP & PLUG took off. Stepping back , this is a base that has been popping and consolidation too. It rested back on support and could be ready to run. It is a swing trade ( I try to hold more than just a week), unless it pops 100% – I always sell those & try to re-buy that dip.