
June 27th Weekend Review
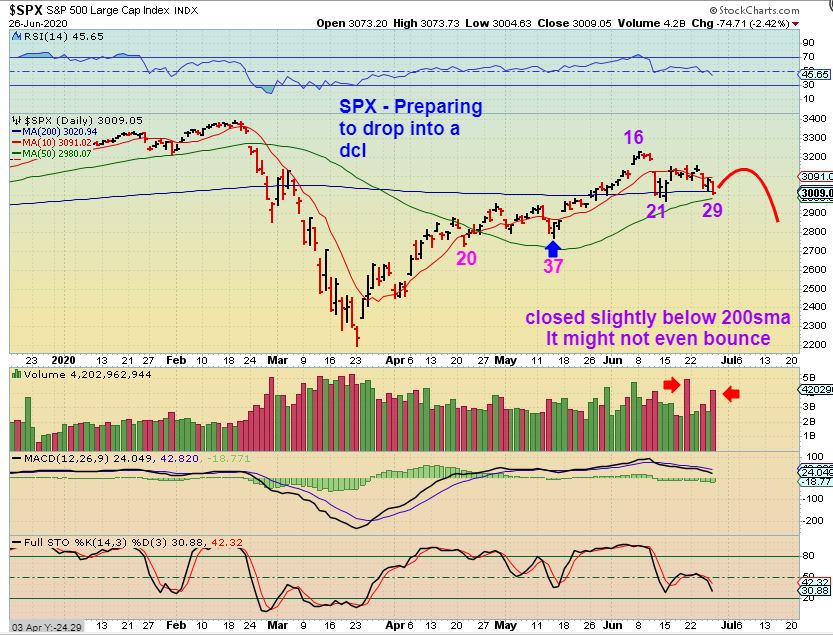
SPX DAILY – This is actually day 30 with a new low. THE SPX Closed slightly below the 200 sma after reversing off of it on Thursday. Daily cycles can be roughly 40 days long, and you can see that the last one was 37 days long…
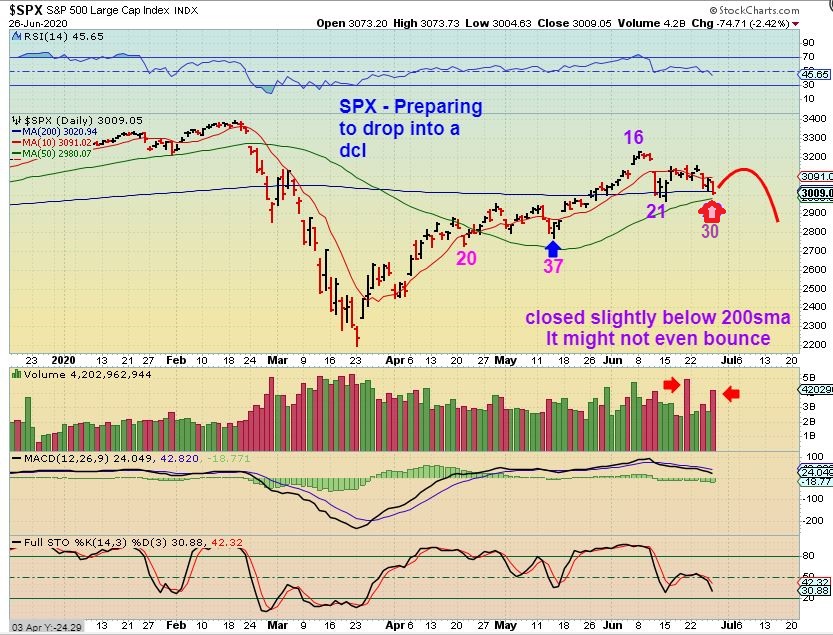
SPX DAILY SAME CHART – With Fridays increased volume drop- this now looks ready to drop into a dcl, it may not even bounce. This will become a Left Translated Daily cycle if it is longer than 32 days, and that technically makes the next daily cycle weaker.
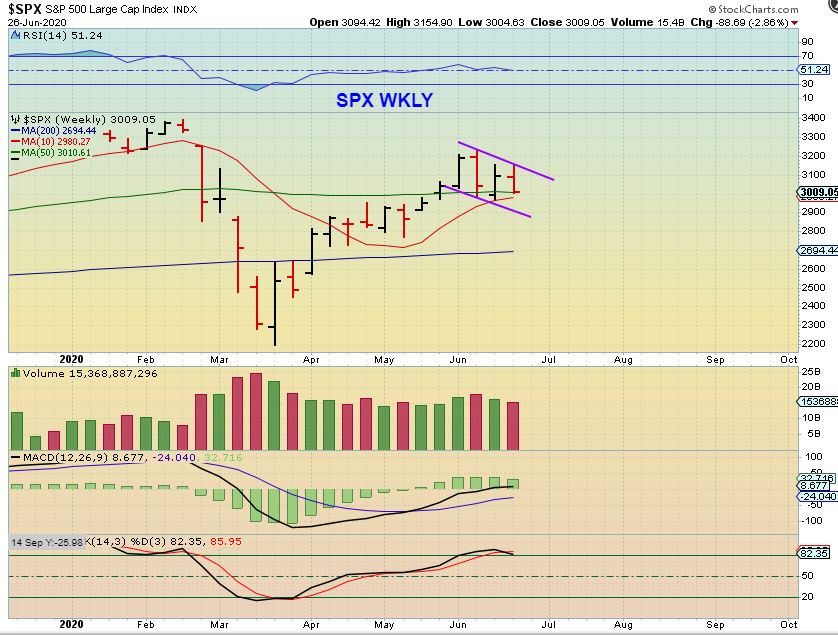
SPX WEEKLY – The weekly view, even if we do drop as low as 2900, would still look Bullish with the coming dip. THAT CAN CHANGE WITH A REALLY DEEP DROP, but so far it looks like we will dip into a dcl, and bounce into a 3rd daily cycle coming up.
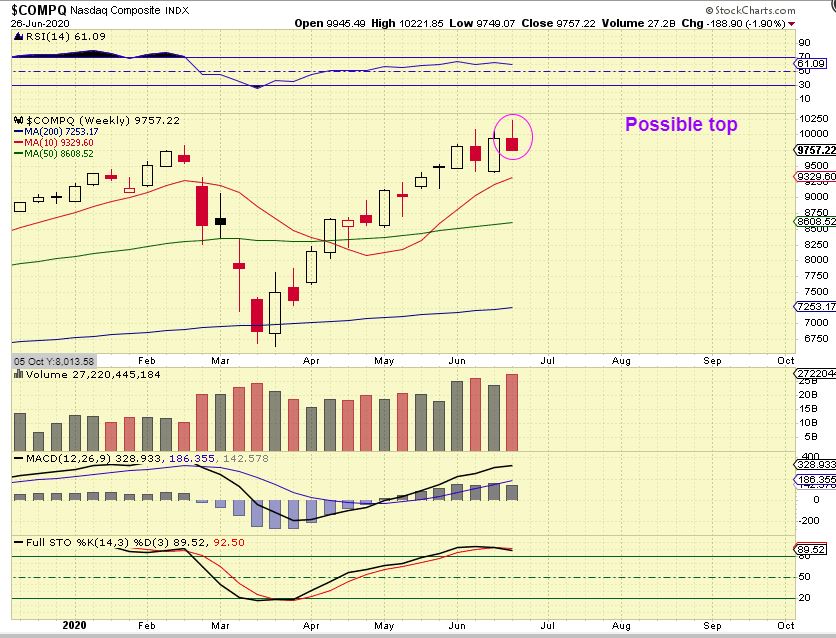
NAZ WEEKLY – This looks like a topping candle too, so I am saying that these charts indicate that we are ready to drop into a dcl ( Daily Cycle low). In addition to that…
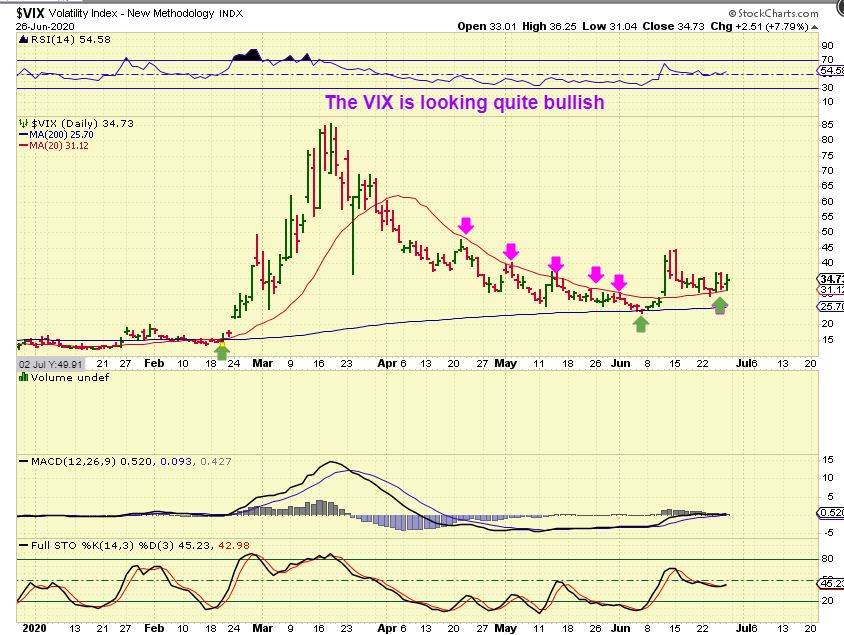
THE VIX DAILY looks ready to go higher, and that volatility happens as the markets drop. If I was buying the VIX, this is a buy .
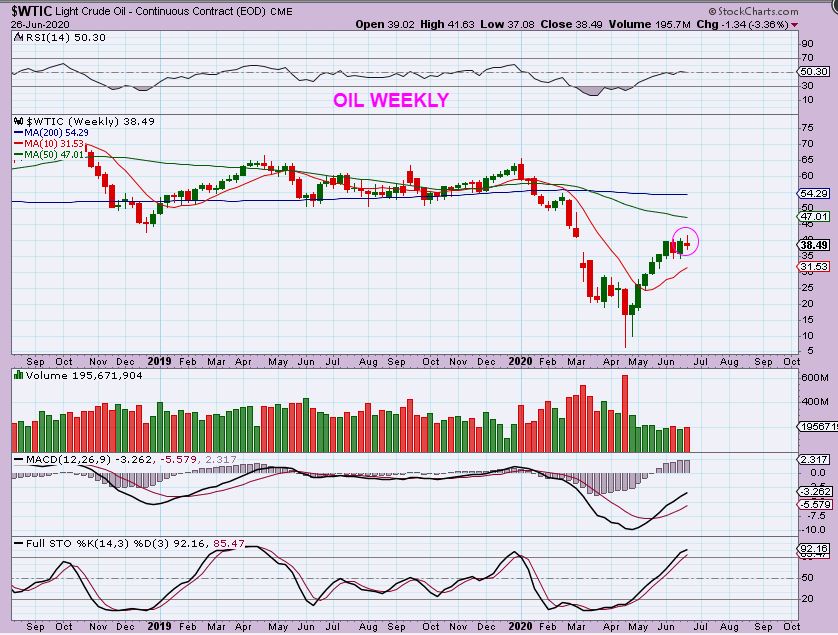
WTIC WEEKLY – Oil has a weekly doji, and it might follow the markets down, so this may be an indecision candle leading to a dip for oil too. Oil can drop to the red 10 wk moving average line and be perfectly fine.
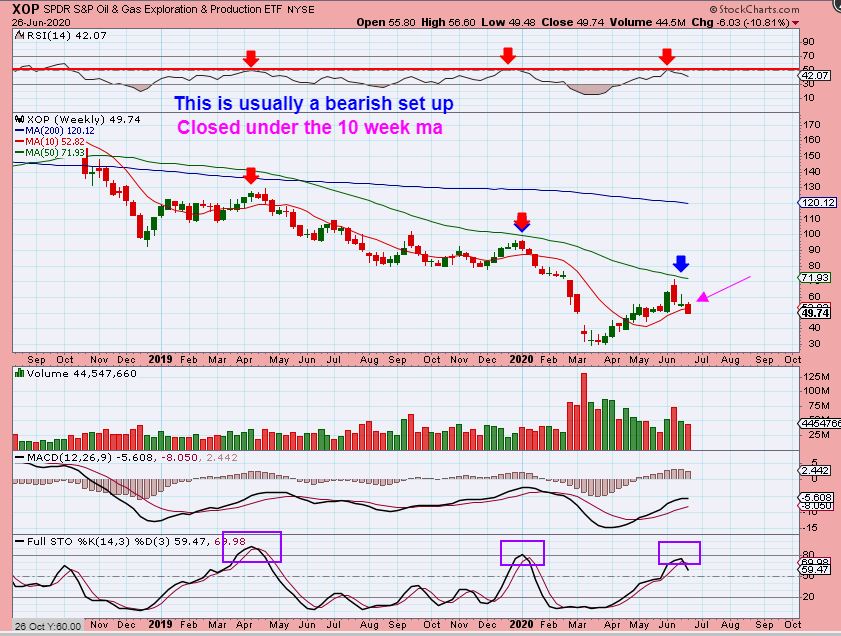
XOP WEEKLY #1– The XOP was looking good, but it broke and closed below it’s 10 week ma line, so Oil & Energy stocks may be affected by the markets selling down.
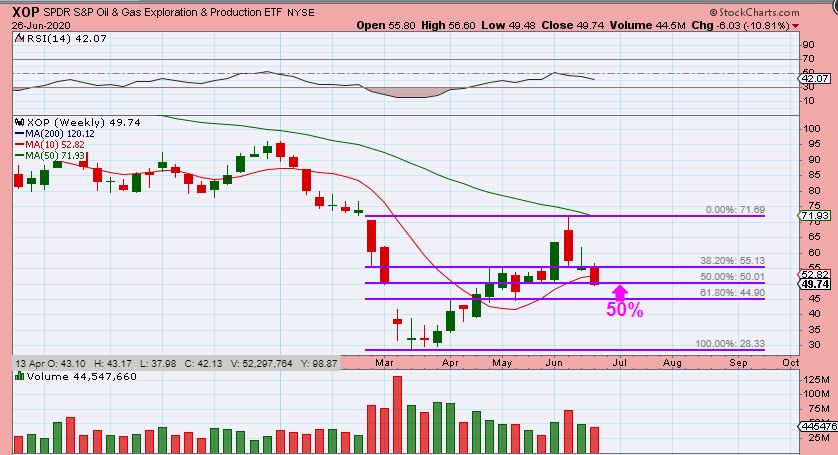
XOP WEEKLY #2 – The current pull back is a 50 % give back, and that is fine, but 61.8% is also a normal level and that is $5 lower.
ON JUNE 12th USD – I mentioned that the USD could bounce to back test the support that it broke through ( over time) with this chart.
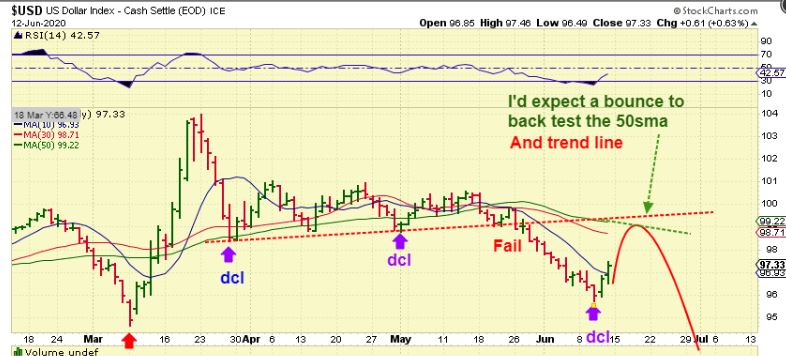
.
BY JUNE 24th USD – It bounced and dropped (choppy) and I said that I Still expect the USD to move higher and back test the support or major moving averages as shown with this chart.
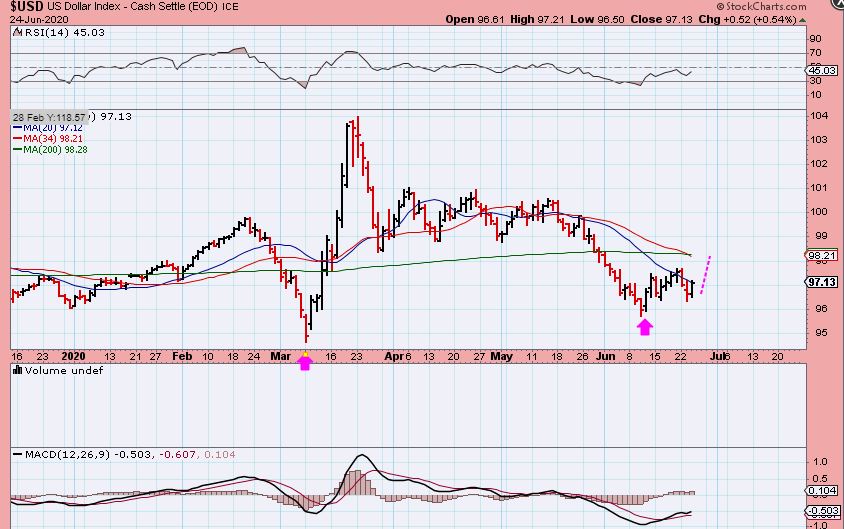
.
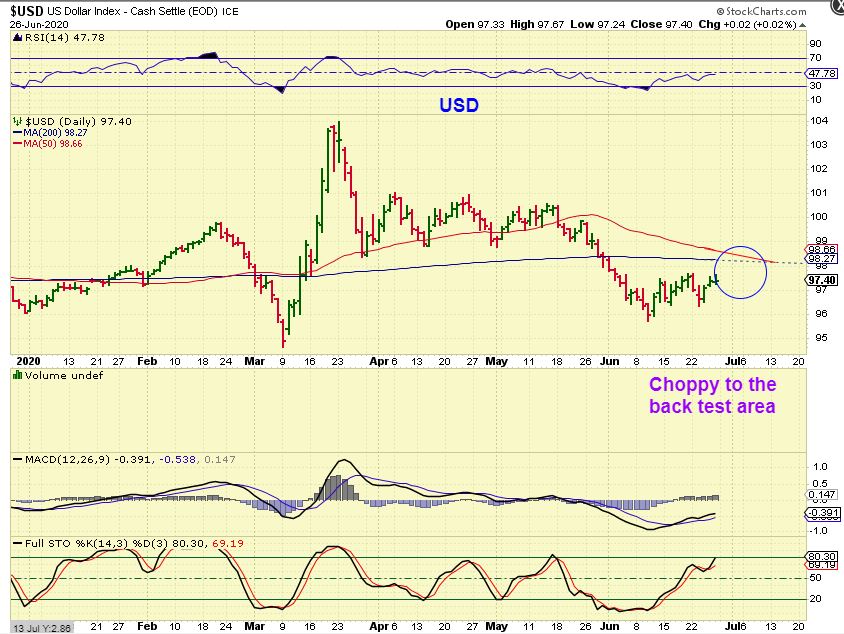
JUNE 24th USD – We see that it is still bouncing (Choppy) higher toward the moving averages. This movement does not really seem to be affecting Gold one way or the other at this point.
.
PRECIOUS METALS
.
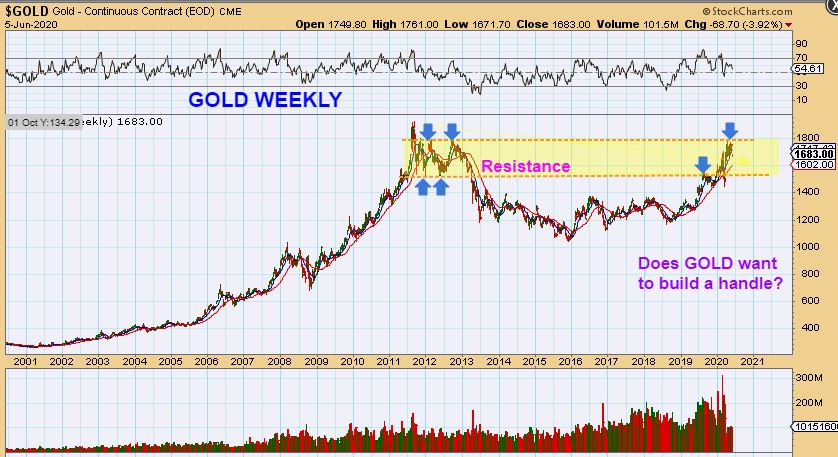
GOLD JUNE 6 – I’ve been pointing out the resistance area that GOLD is pushing through for months. I even asked, “Does Gold want to build a handle” or in other words, Gold could chop sideways at upper resistance.
.
GOLD June 12 – Gold has been building that handle, or chopping sideways on the daily and weekly charts. This is normal, there is nothing wrong with Gold.
.
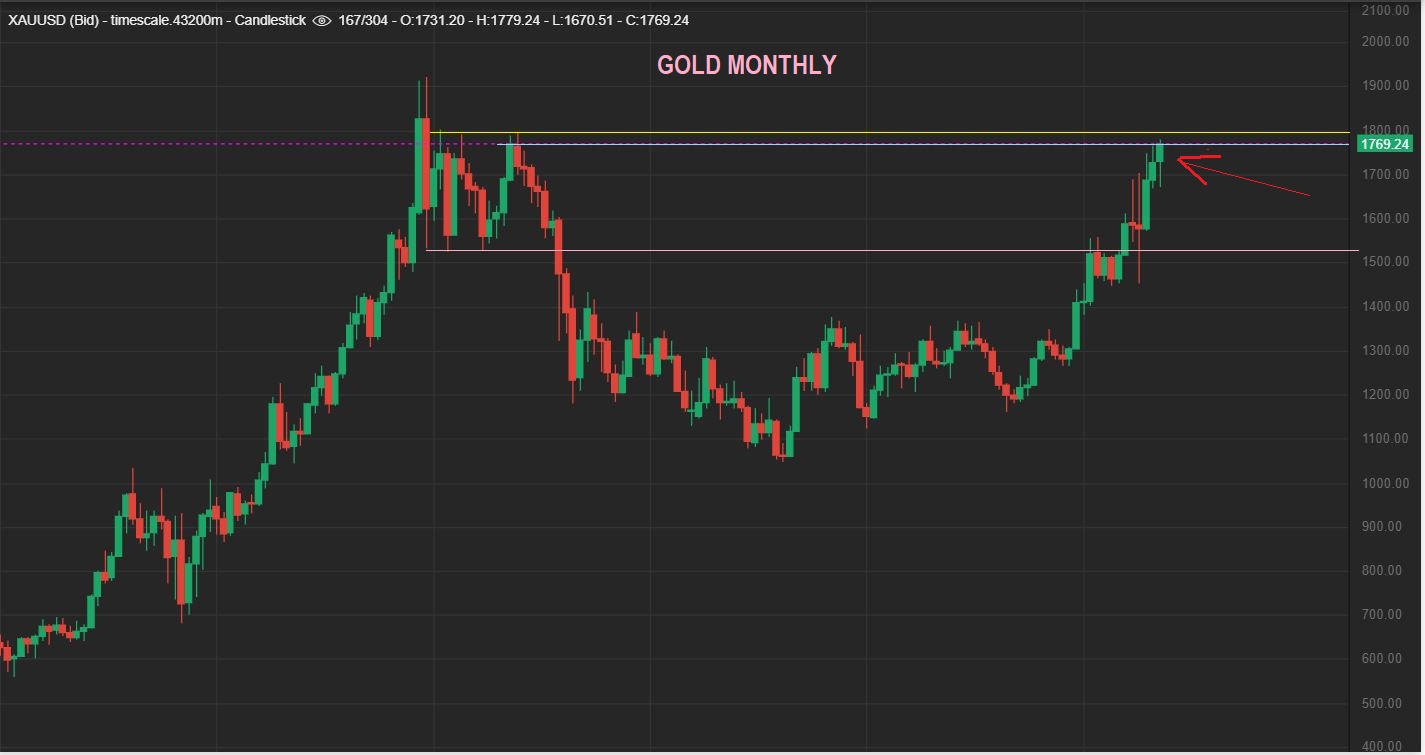
GOLD MONTHLY – We only have 2 trading days left in June so I cheated and looked at the Monthly Chart. Since the ‘CHOP’ or ‘Handle’ started in June, we don’t see it on the Monthly chart. All we see is that Gold pushed higher in April, May, and June to upper resistance and has been Bullish.
.
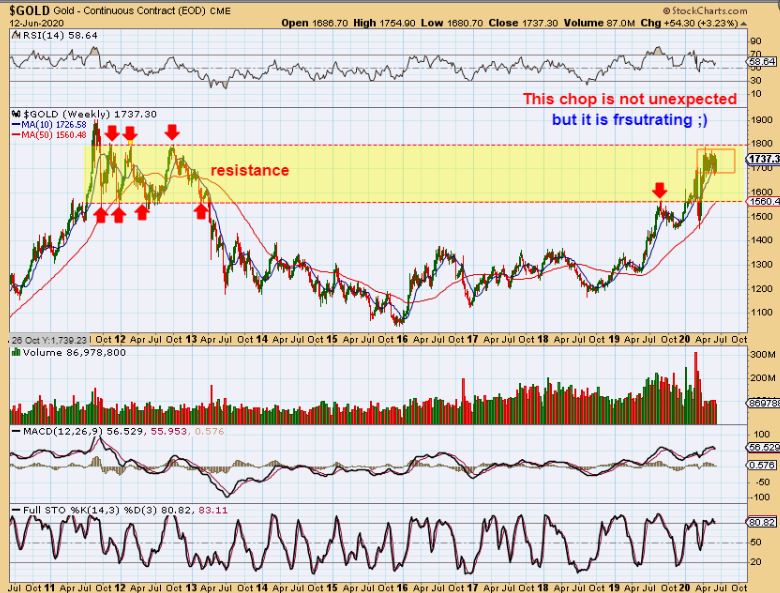
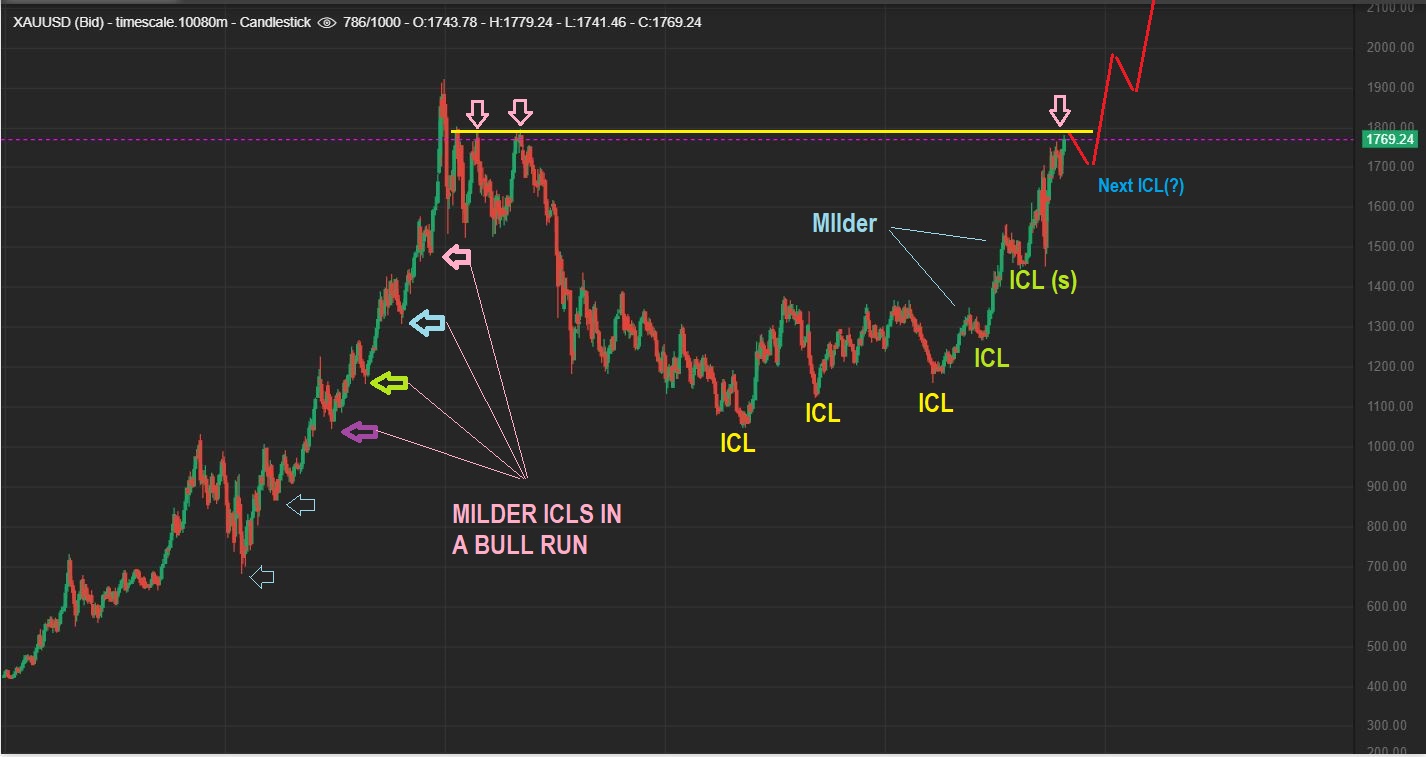
GOLD WEEKLY IS AT WEEK 14 – We know that 14 weeks out of an ICL starts to trigger the timing for a ‘peak’ in this Intermediate Cycle ( ICL to ICL). This CAN go higher to week 15 or 16 ( 2 more weeks), but for now I am just pointing out what these next 2 charts are saying to me at week 14…
1. 14 weeks out of the low is where runs can start to top out
2. A rising wedge usually tops out before the Apex is hit, and this is pretty close.
.
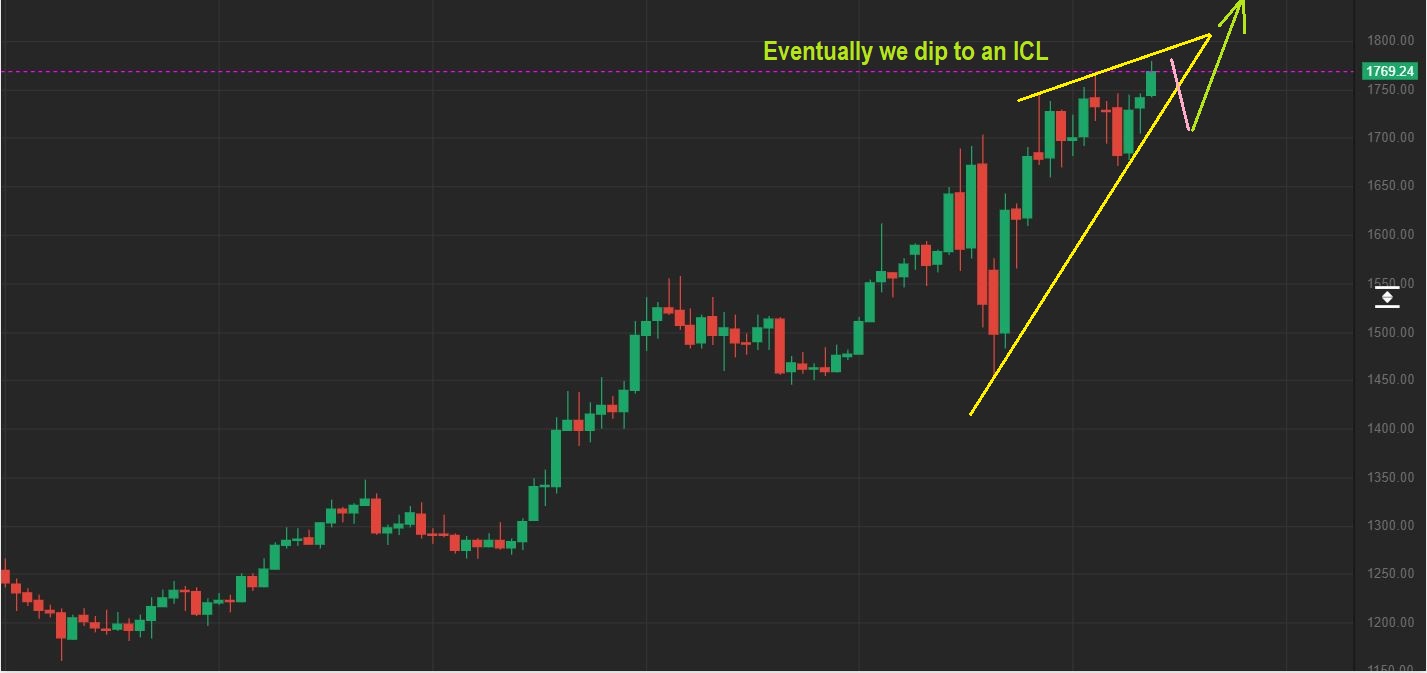
3. NOTICE: An ICL in a Bull Market does not have to be a deep drop, but they can still be choppy and frustrating. See the chart!
4. Important point/ My Thoughts: The next ICL should be a screaming buy, because Gold would likely break to all new highs and then It and the Miners could rocket from there when they get a lot of notice.
.
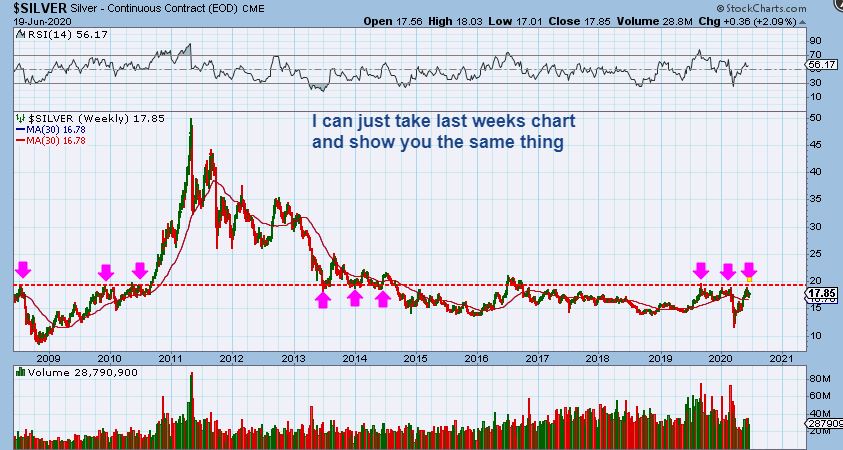
SILVER WEEKLY FROM LAST WEEK – I have actually mentioned for weeks now that we all want Silver to just break out and run, but instead it COULD just chop sideways like it did in 2010 first.
.
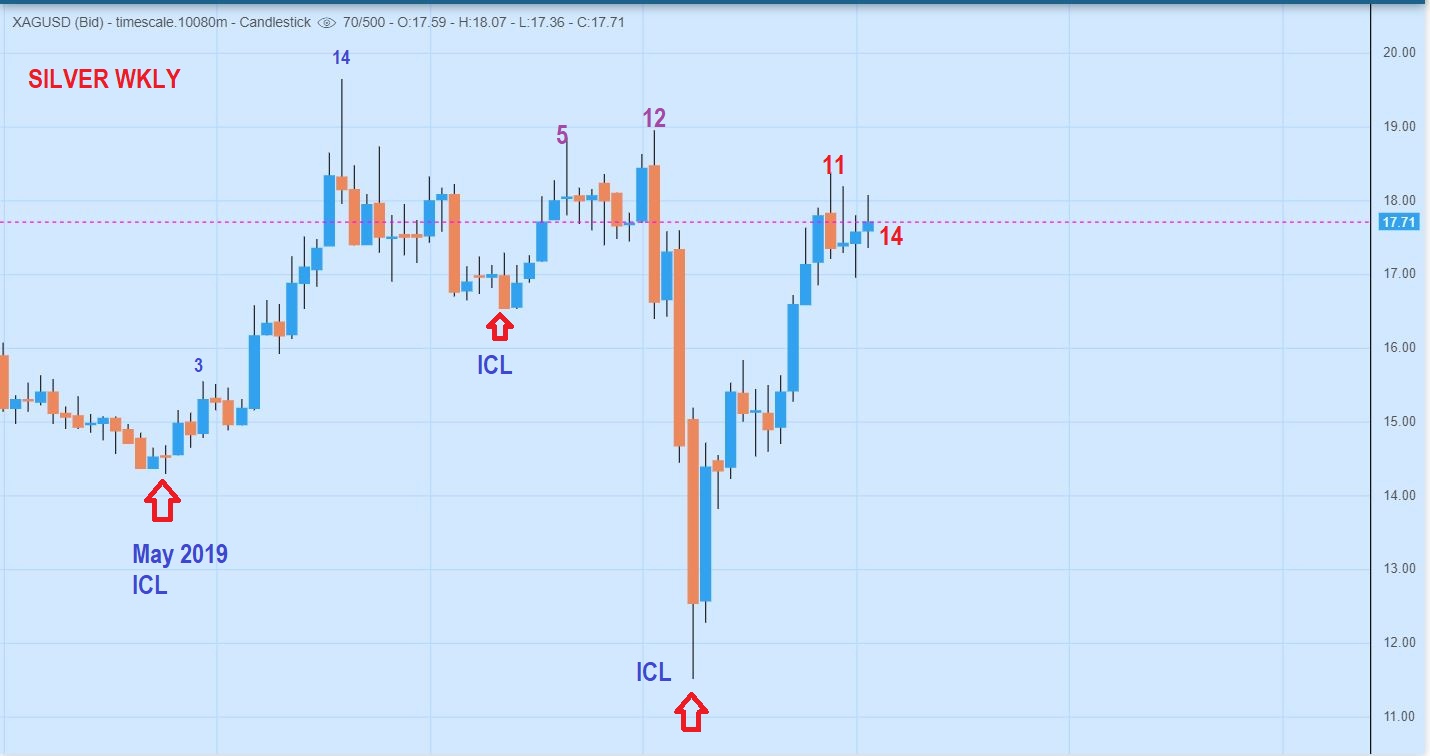
SILVER WEEKLY CYCLE COUNT – Silver still hasn’t broken out. It is chopping sideways and we are at week 14 out of the lows here too. The rally from May 2019 peaked in 14 weeks. The next one peaked in 12 weeks & then the Crash occurred. We could push to a peak in a week or 2, or it peaked on week 11 with this sideways chop at resistance.
.
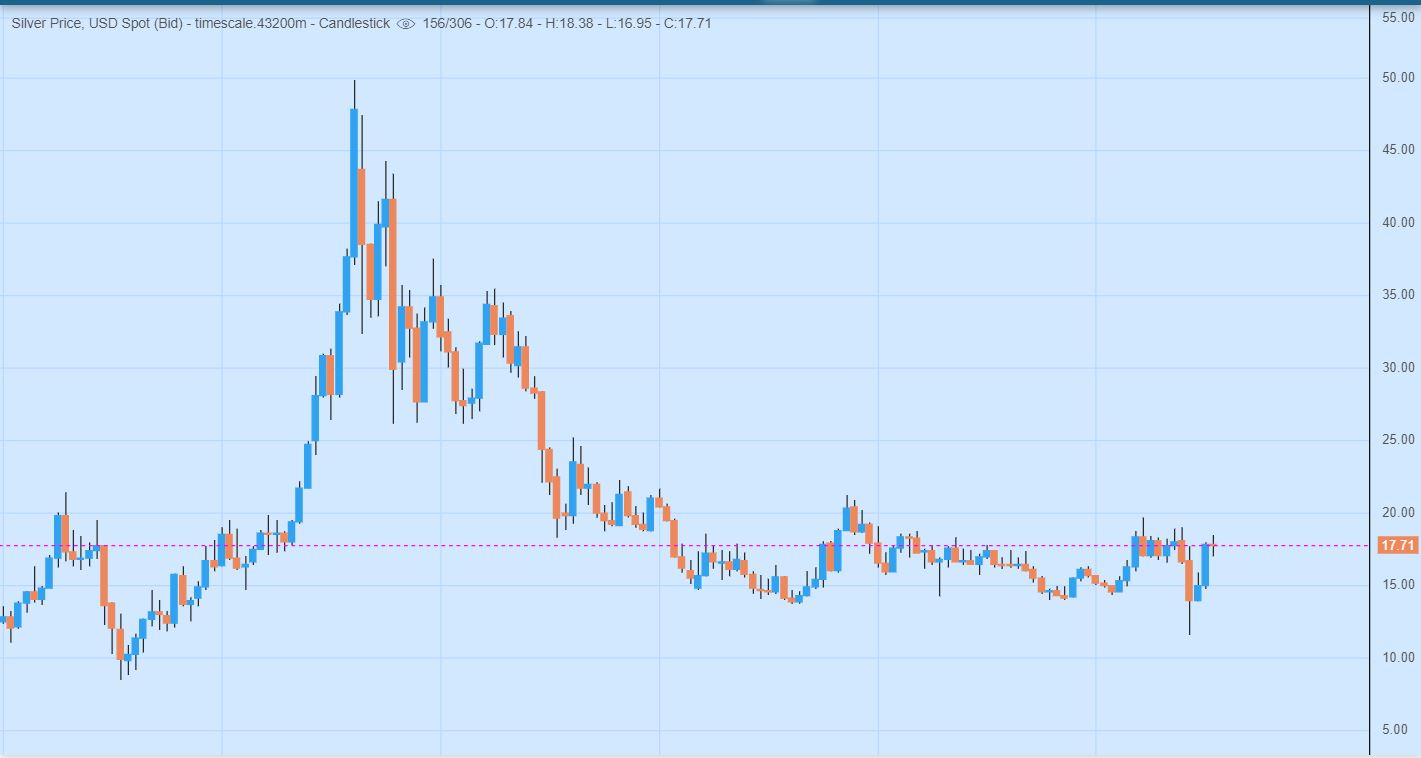
SILVER MONTHLY CHART – No change with Silver at all for June really. We formed a monthly Doji of indecision.
.
GDX DAILY – This was actually a very nice reversal off of support on Friday. The First Low reversal was a buy, and this second reversal low Friday could be where you raise your stops to.
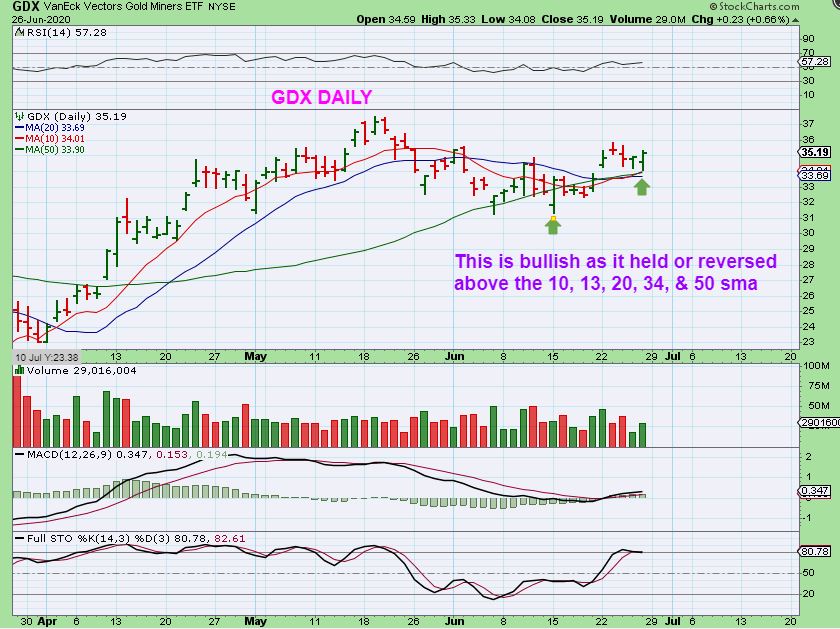
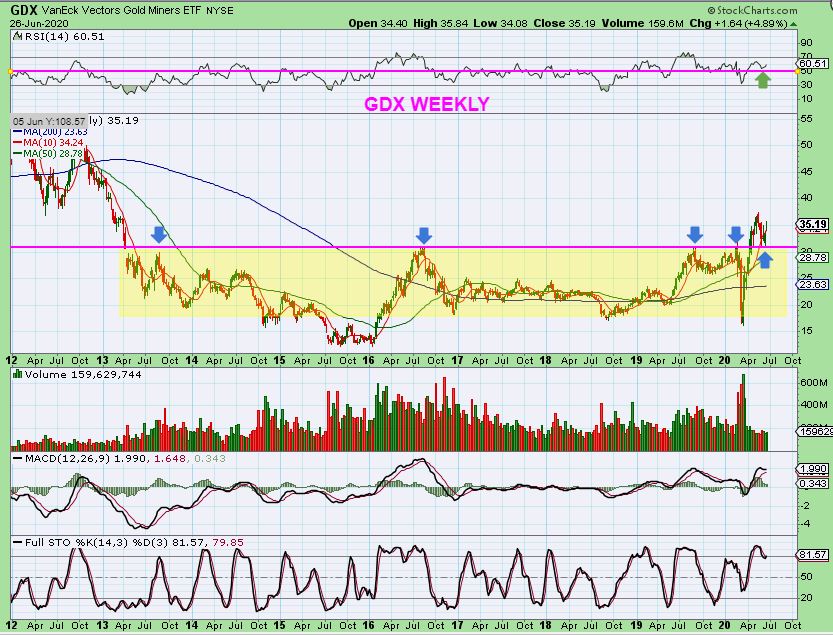
GDX WEEKLY – This is week 14 of the Intermediate Cycle, but GDX popped above the 10 week ma after weeks of sideways chop & drifting lower. That is Bullish for now.
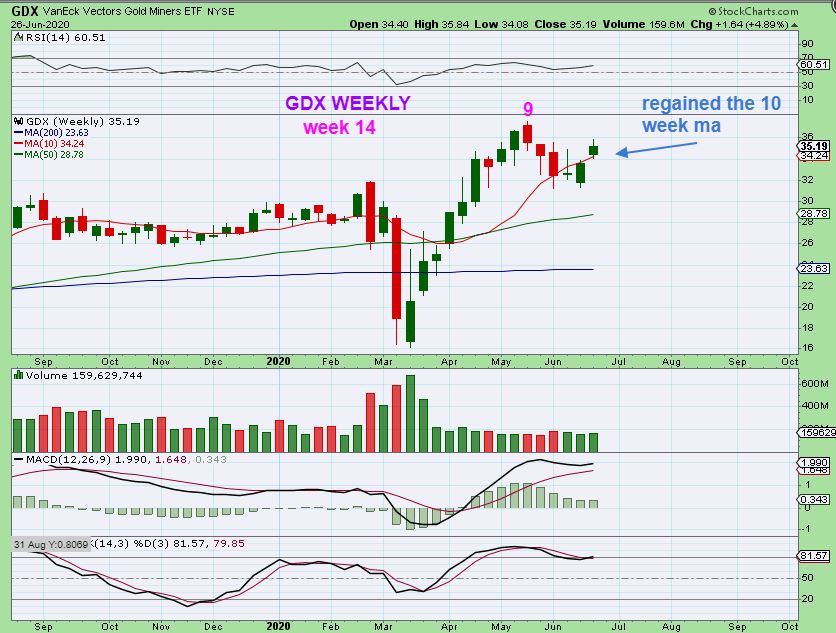
GDX WEEKLY – In the Big Picture we still have GDX as a break out from a multiyear base. We then got the anticipated back test, and now we also have a bounce off of that back test area. It is very bullish in the long term view.
.
That is your week in review and your Big Picture View.
– The General Markets look ready to drop lower into a dcl, and
– they may drag Oil down with them.
– The precious Metals sector can move a bit higher and the miners actually look like they DO want to make a final run higher with Fridays reversal at support.
.
That said … ‘time’ is getting late for the Intermediate Cycle count in Gold. 14 weeks can peak or top a cycle, so we are cautiously optimistic that the miners can run higher for a week or 2, but then we start a pull back. We’ll be examining things step by step in the daily reports.
.
The charts really are amazing aren’t they? They try to let us know what could happen next, and it can really help us to understand things better when we step back and look at these Bigger Picture charts too.
Enjoy the rest of your weekend, and thanks for being here as a Chartfreak with me!
.
~ALEX
.
Sidethought: Almost everything was taken down in the Feb-March crash. That can be due to margin calls, panic sellers bailing out, and various other reasons. The expression, “They threw the baby out with the bath water” comes to mind . When someone says that, it basically means that in haste, the thinking became , ” Everything must go!”
Since that time, we have seen smaller market dips where Biotech or even some Miners have now ignored the dip. That can continue, even if the General Marets eventually turn into down trending markets. We’ll see, but that leads me to believe that there are some areas that may resist the selling if we do see the General Markets roll over into a bear market down trend over time. The Miners may decouple and become a Bull Market. Some Biotech areas may also benefit, as the Covid Epidemic continues to run like a wild beast though our planet. I may discuss this thought further in future reports. My thinking is that the Precious Metals are definitely in a Bull Market, and that can last a lot longer as this sector becomes a safe haven – a place where money flows to as investors seek protection ( If or When the general Markets begin drifting lower). A break for Gold to new all time highs should give this sector a lot of attention.

