
June 13th Week In Review – The Fireworks!
To make sure that my thoughts are clear, I will have a conclusion with my overall thinking at the end of the report, but for now please read everything, and please look at every chart. We had some fireworks go off this week with the FOMC Mtg, and we have a lot to talk about.
.
We saw a change in the markets on Thursday of this week after the FOMC Meeting Wednesday. We saw a one day crash and with that, it is almost impossible to know if there will be follow through to the downside ( a real sell off starting?) or is it just a 1 or 2 day drop and then a recovery. Well, now that we have had a 2nd day, we can look at things and try to get a better idea of what we might be dealing with. It’s still a bit too soon to erase all uncertainty, but next weeks trading will help as we get clues along the way.
In Friday Mornings report, my advice was, ” There is a bit of uncertainty short term, so Sitting on our hands (unless you are an active day trader) may be the best play short term.” We have only had 1 additional day of trading, so that may give us an idea of how this will play out, but the advice to ‘take it slow, and maybe patiently allow the markets to prove themselves’ is still valid. Let’s look at the charts…
SPY – With the additional day of Fridays trading, I feel that we can gauge a little better what may happen next. So proceeding with caution, I think we could see a bounce from here next week. The SPY AND QQQ had reversal candles at support. Let me explain what else I am looking at…
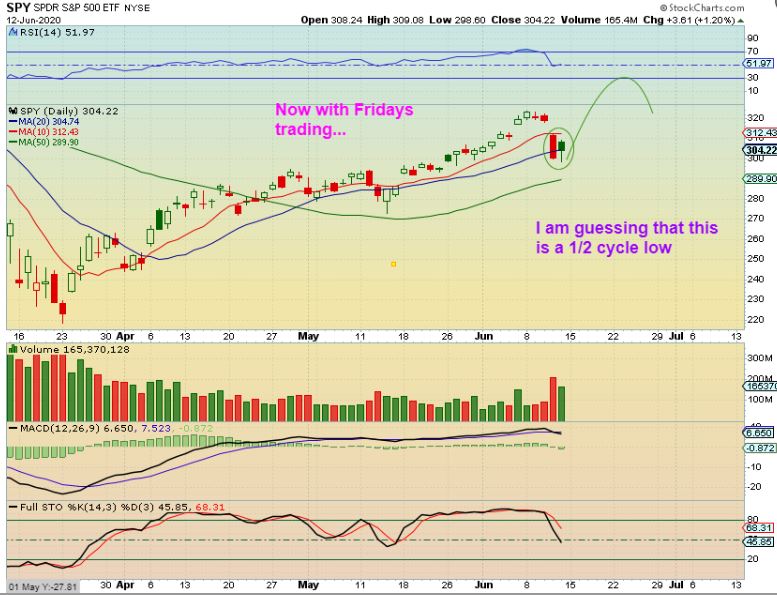
SPX CYCLE COUNT – The first daily cycle out of the ICL (Intermediate Cycle) was strong. The 2nd should be fairly strong too, and then the 3rd could weaken and the 4th could sell off sharply. Well, the first daily cycle was 37 days long ( they are roughly 40 days long), and the dcl dipped to the 34 sma. Now on day 20 ( 1/2 of a 40 day cycle) we dipped to that 34 sma again with a reversal, so Friday was a possible the clue. A reversal at the 34 sma. Will it stop there? Well, so far it did, so …
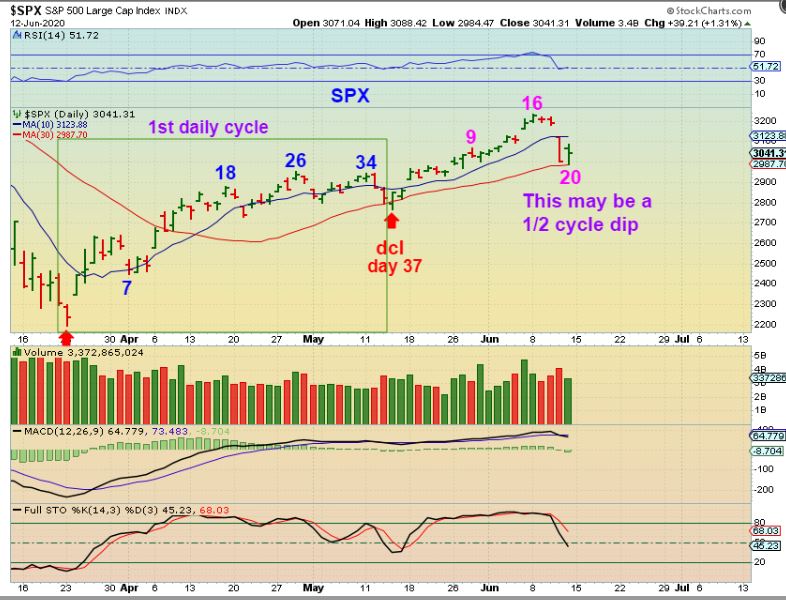
SAME CHART: Lets review the count & my thoughts…
1. The first daily cycle peaked around day 26 and remained at the highs through day 34.
2. A week of trading is 5 days, so that would be 2 weeks from now if it were to ‘peak’ around the same time
3. I DO think that Thursday was a warning shot, showing us just how quickly things can change with a BIG GAP DOWN.
4. The Dow lost almost 2000 points that 1 sell off day, so we DO need to be cautious and Stay Frosty.
5. If we open here or higher, you can buy it with a stop under the day 20 lows as a 1/2 cycle dip for a trade.
SO BACK TO THIS CHART – We should see a fairly bullish bounce, but a break of day 20 lows would change this analysis over to a “weak and bearish’ break down on the 2nd daily cycle.
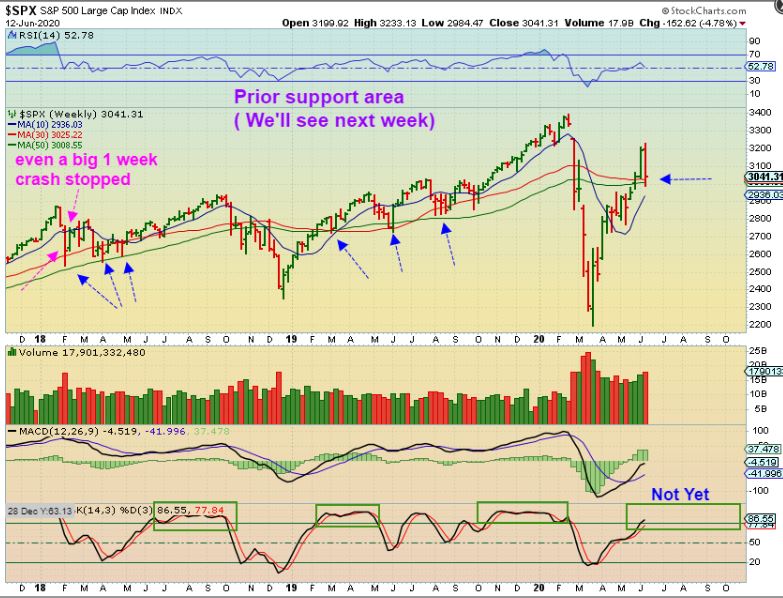
SPX WEEKLY– I actually think that at a glance this weekly chart looks like a Bearish Reversal, doesn’t it? However 2 points that stand out to me for continued bullishness are…
1. This is an area where price has been supported in the past (blue arrows) , and
2. Even on a sharp 1 week crashes like in Feb 2018, price reversed at the 50 week ma. SO NEXT WEEK IS KEY.
.
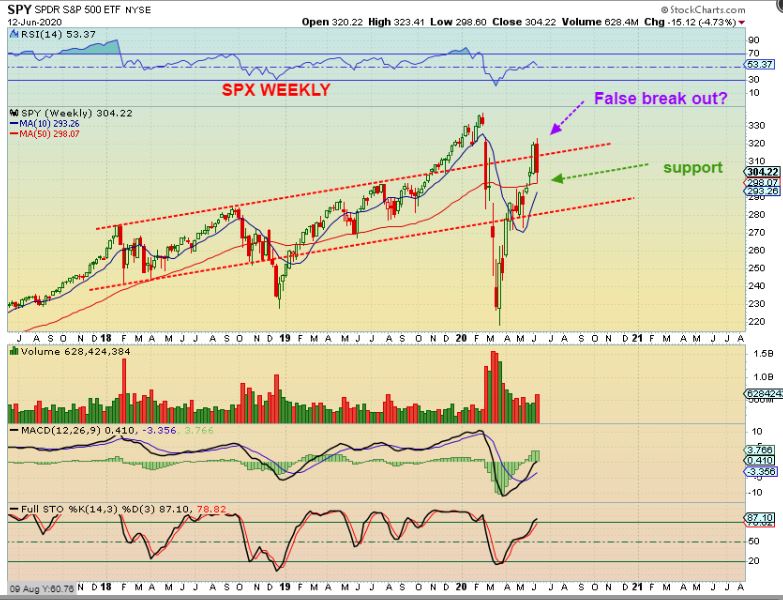
SPY WEEKLY – Again, at a glance the weekly chart looks like a bearish reversal and a false break out, but it bounced at the 50 week ma, so next week is important.
.
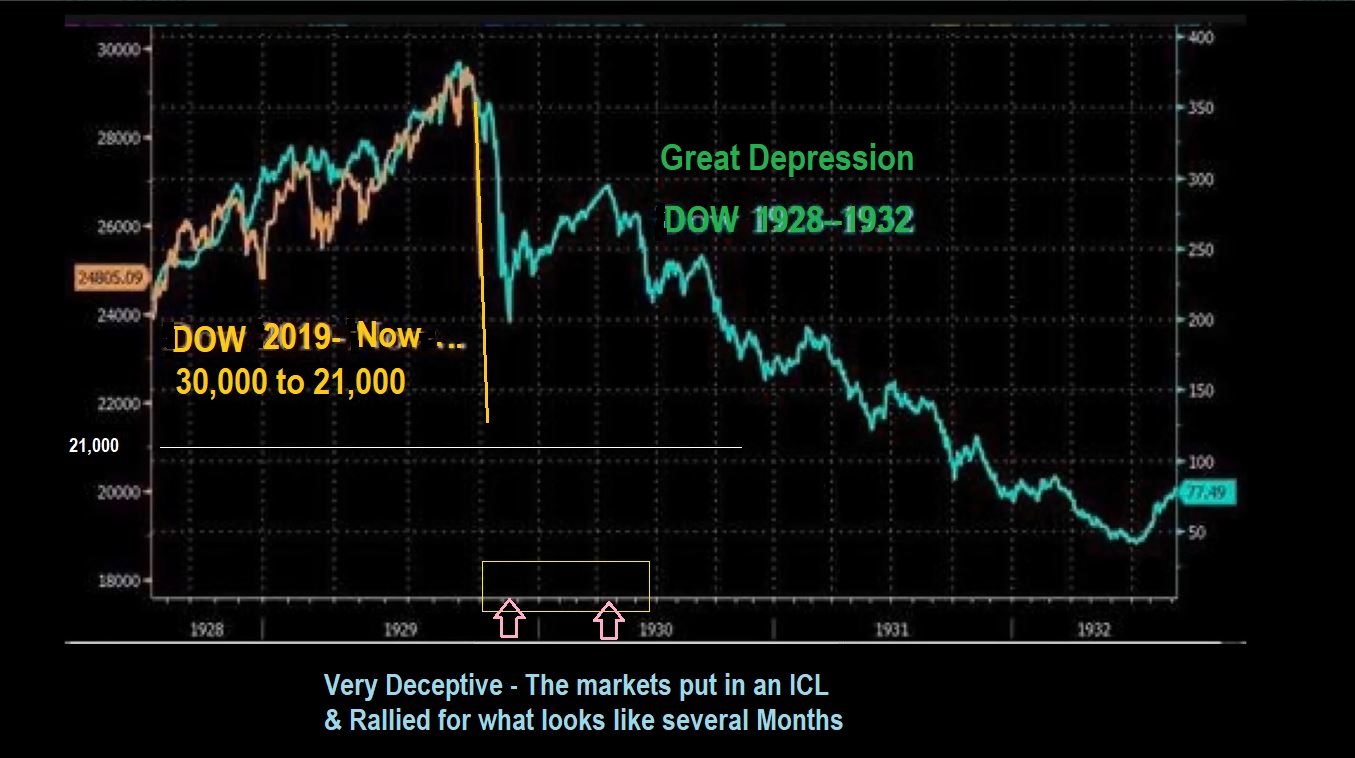
AS A LONG TERM REMINDER AGAIN – As we moved out of the crash lows in march, I pointed out this chart. I said that in the Crash of 1928 we saw an initial crash that then led to a 6 month rally. That rally was believable enough to draw everyone back in, but then a bear market unfolded. THIS NEEDS TO BE IN THE BACK OF OUR MINDS IN 2020, SINCE THE COVID SHUT DOWN MAY EVENTUALLY CAUSE AN ECONOMIC DEPRESSION.
.
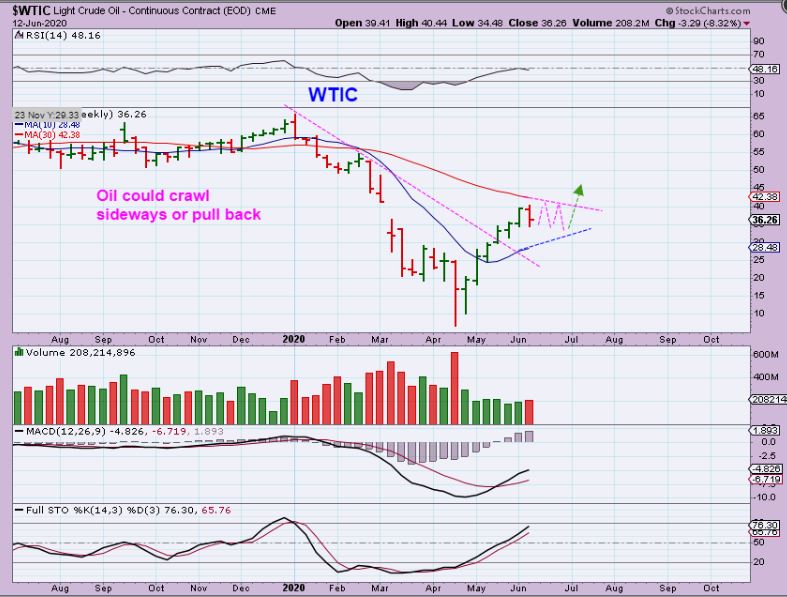
WTIC- Oil dropped this week too. I’ve expected a tag of that resistance line ( 30 week ma), but that may be enough of a rally out of the lows for now. Oil could still tag that $42 area or it may just get choppy if it is lining up to break even higher later.
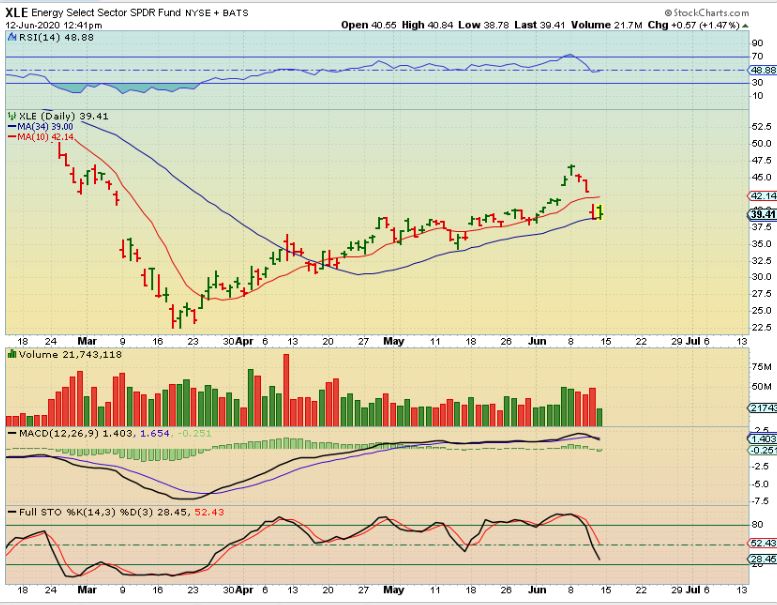
XLE -The XLE & XOP bounced off of the 34 sma in May, and may be doing that now too. Notice please that it matches the beat of the General Markets with a dip in mid April, a dcl in Mid May, and the current dip. So Oil stocks have followed the General Markets and NOT Oil at this point. With that…
.
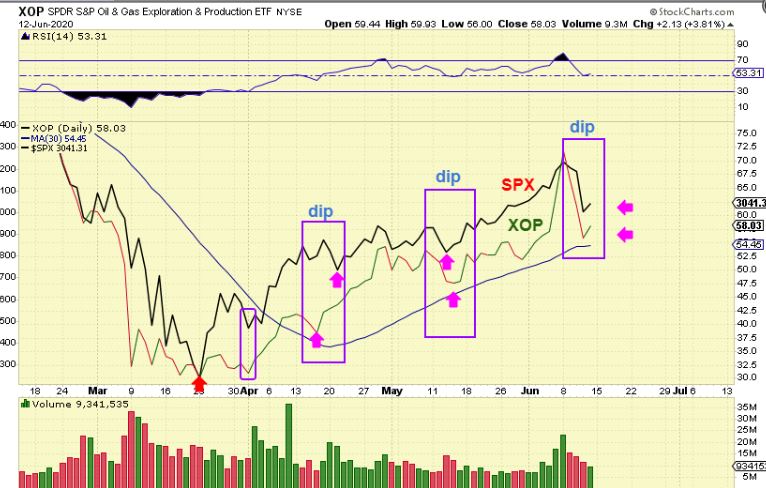
XOP & SPX OVERLAY – The OIL STOCK dips came at the same time, so if the Markets rally from here as a 1/2 cycle low, I Expect the Oil Stocks to be a buy too. The gains in the OIL Stocks have been big gains also.
.
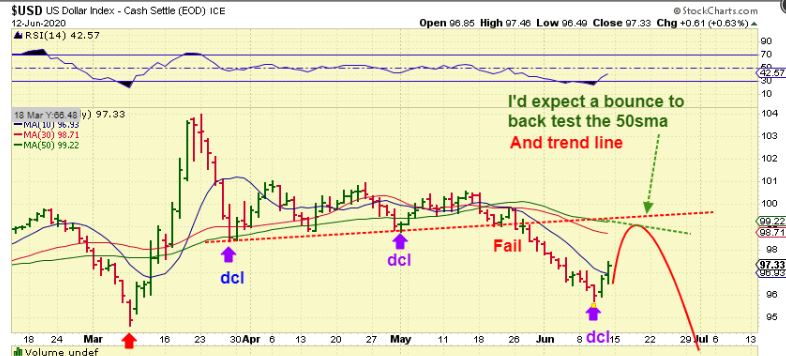
USD DAILY -The USD has a failed daily cycle and dropped for weeks in May into June. It seems to also have a dcl now. The USD will probably bounce to the 50 sma and then roll over again.
.
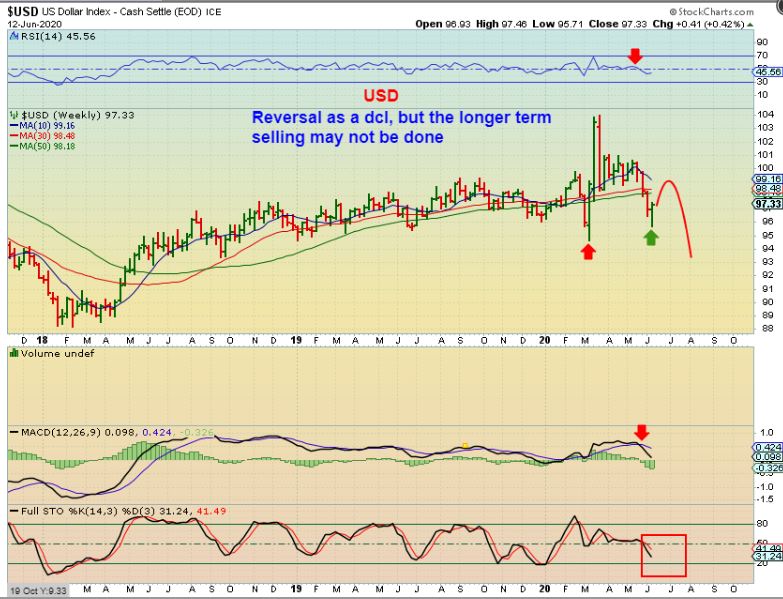
USD WEEKLY – I that a dip know that sounds good for Precious Metals, but look again at the daily chart above and that was a BIG DROP in May into June, but Miners didn’t really react strongly to that drop.
.
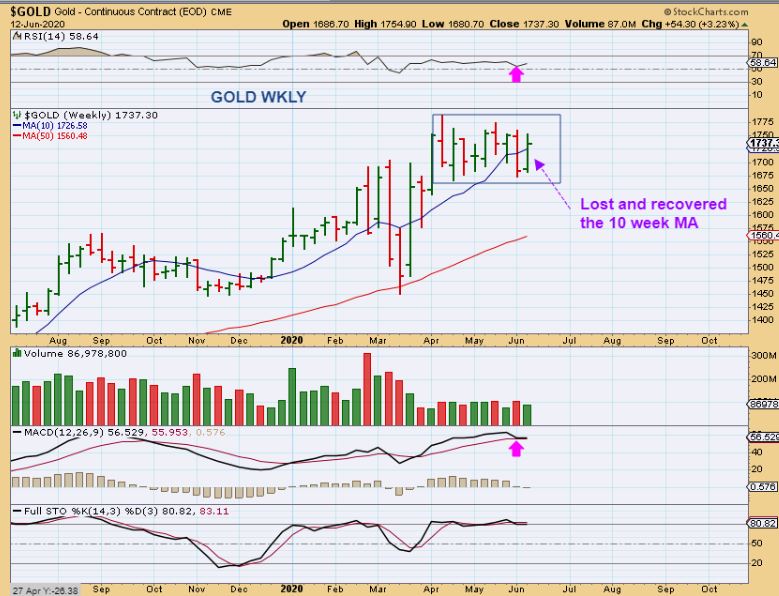
GOLD WEEKLY – It’s funny when you step back and look at the Big Picture and see that another week has passed and all in all its just another brick in the wall. We are still chopping sideways in a box consolidation.
.
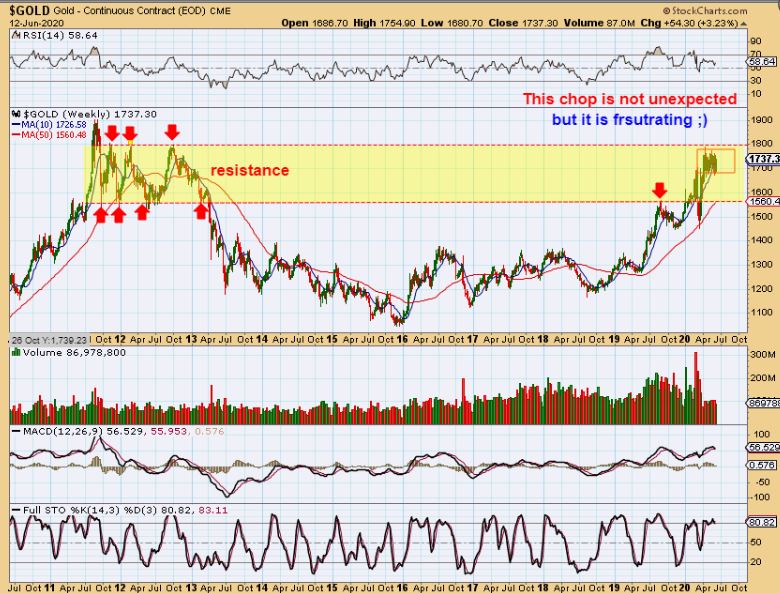
Stepping back for the BIG PICTURE OF GOLD – This is actually what I said we could see. On a day to day basis, as we wait for Gold to break out, we forget that in the big picture it has been pushing through at a solid resistance zone. I mentioned in past weekend reports that it could chop sideways here near all time highs, and that is what we are seeing.
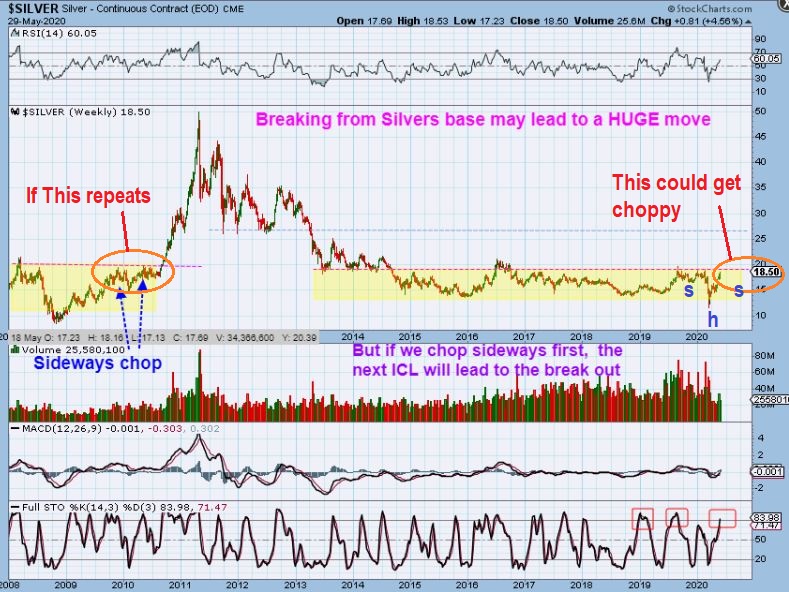
And it has been the same for our friend SILVER . It is in a multi-year base .
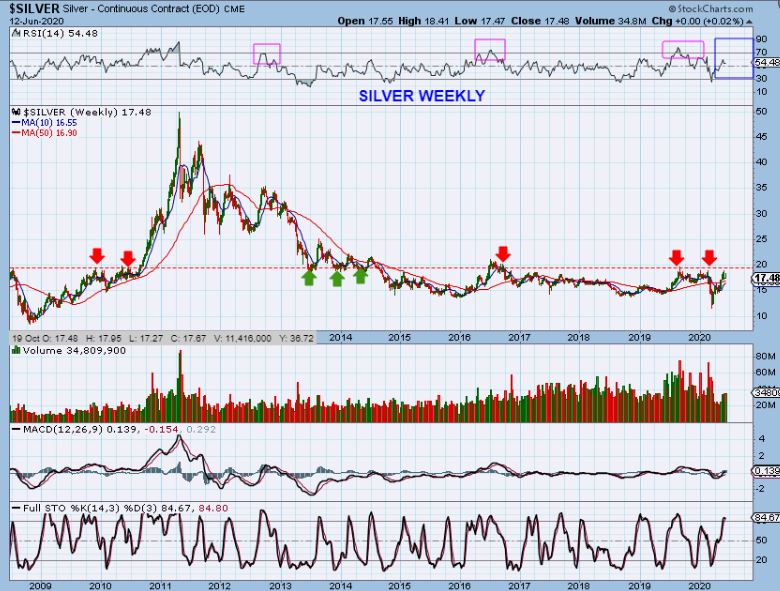
SILVER WEEKLY – I had pointed out weeks ago that just like we saw with Silver in the first RED Circle in 2010, we could get a little sideways chop before it breaks out higher too. The Rally out of this base will be well worth the wait.
.
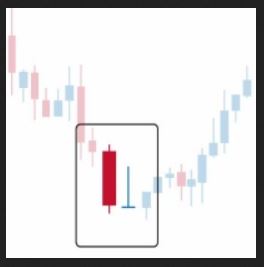
In the past I have shown you what a ‘Gravestone Doji’ looks like. It is indecision and can signal the end of a sell off is near, as shown here. This shows a gravestone doji and a slightly lower low reversal the following candle.
.
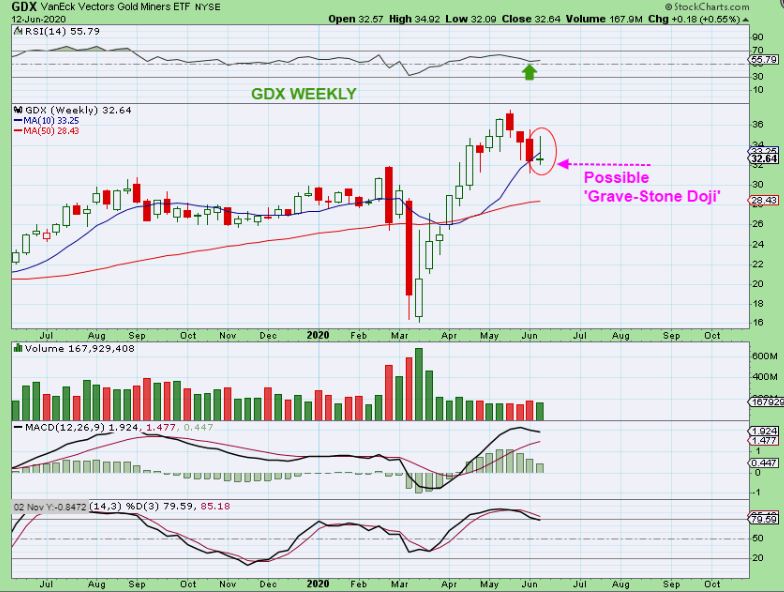
GDX WEEKLY – My weekly chart of the GDX shows a weekly gravestone Doji. Also Miners should be close to a dcl, and we know that from our weekly week day observations of cycle count. A daily cycle for Miners tends to be roughly around 33 days long… Let me show you again what I had in Fridays report for Cycle counts…
GDXJ was on day 28 as of Thursday & so Friday was day 29. We could chop around to get a 30+ day daily cycle and a dcl near the 200sma. Thats a slight dop from here. I count the First daily cycle at 34 days, this one was 28.
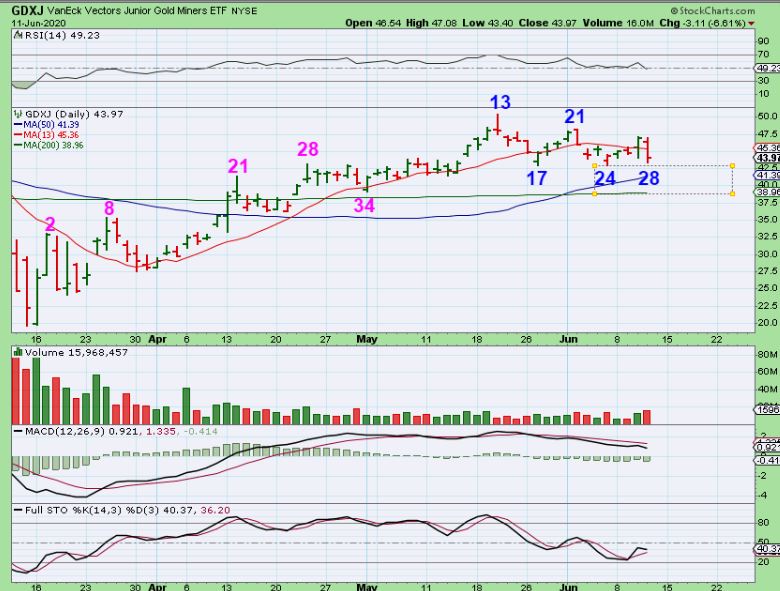
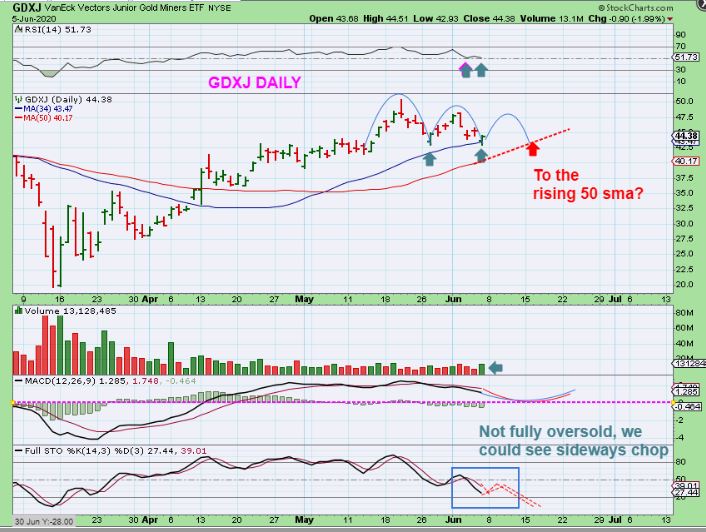
And I know that you recall that I have mentioned a few times that we could get a bounce & drop because the cycle timing could use more time. I drew these charts on June 5th to show that bounce & drop, It hurts A LOT MORE in real time, than it looked like it would on these charts last week, right?
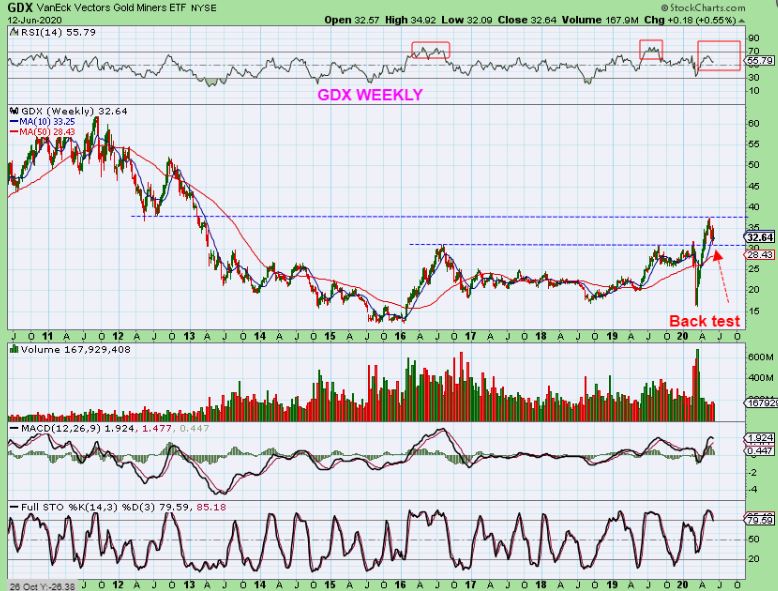
As we step back for a Big Picture view of GDX it also looks normal and bullish. Day by Day we hope for a break out, and if we don’t see that, we might tend to think that ‘something is wrong’? There is nothing ‘wrong’ with this chart.
This shows a bullish set up where GDX hit resistance and pulled back for a back test of the first break out. GDX REMAINS BULLISH.
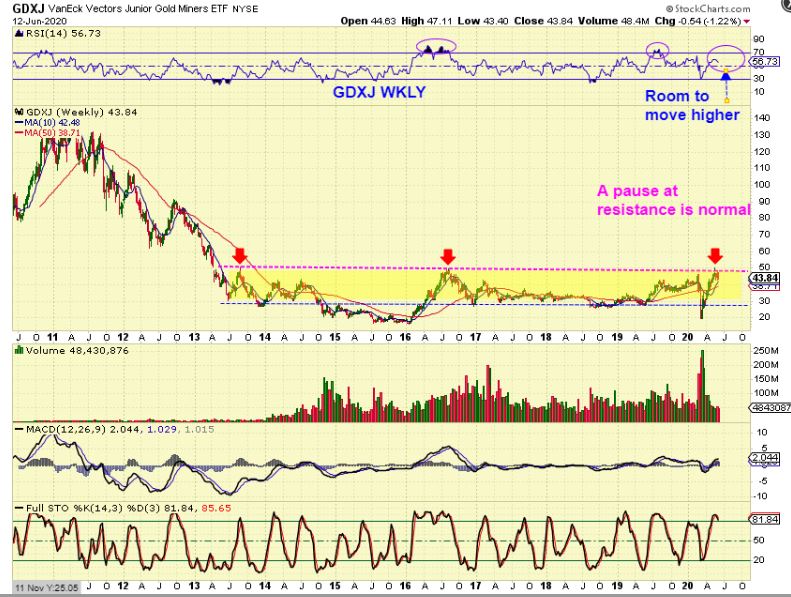
GDXJ also has a weekly gravestone doji and is near the 10 week MA. ON day 29 we can say that we are due for a low, and this is also normal bullish action. I also noticed that both GDX & GDXJ had massive Gravestone Dojis at the ICL lows. 🙂
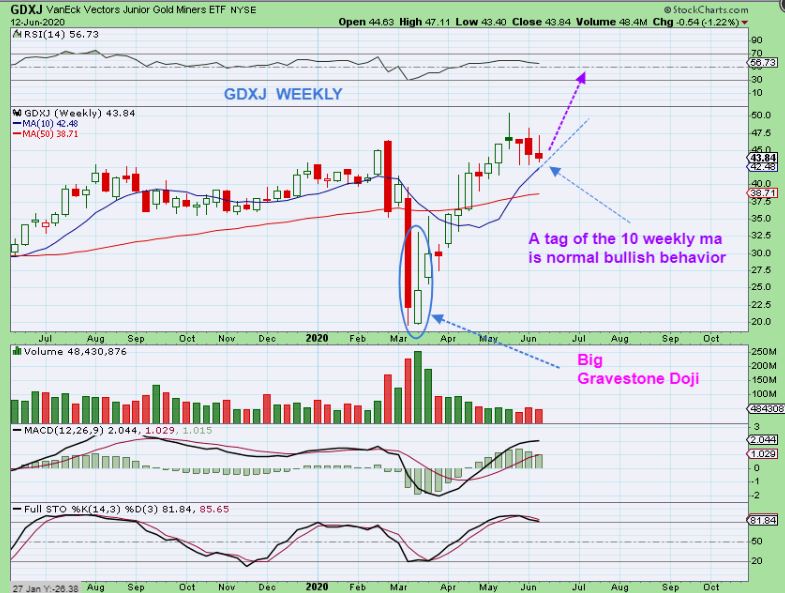
GDXJ Big Picture is showing us at resistance and this pause has most likely been building steam to allow price to break out higher after we get our DCL in place.
.
Conclusion: I am actually really looking forward to the trading next week. The trading before that F.O.M.C. Mtg was very profitable and we may see a return to that for the next half of the 2nd daily cycle (if this is a 1/2 cycle low). We can begin to buy at the reversal, but you’ll need to use stops. I am going to be watching the charts for trading opportunities going forward again too. As mentioned in the report, if the General Markets are going to move higher again for a week or 2 ( 10 trading days or so), Oil stocks could follow as they reverse out of the dip. That would make them a buy on reversal and they made us some good profit too. These may be short term trades for a week or two.
Our Precious Metals Sector is also at an interesting point too. I see Gravestone Dojis on the weekly charts that usually happen as ‘indecision’ near the end of a sell off. Along with that we know that our cycle count for Miners is within the area for a dcl to form (A daily cycles low).
.
Miners can simply reverse higher after a day 30 dcl this week too, but something else also crossed my mind. What if Miners keep chopping around into day 33, 35, or even say day 38 low, as the General Markets push higher after this reversal. Then we might even see them trade places? The Miners could rise out of a dcl as the General Markets begin to top & chop & drop down into their dcl later. I find that a bit less likely, and it will take time to see how this will actually play out. The good thing is that there are always clues along the way, and I can cover these ideas in the daily reports day by day.
.
I look forward to next weeks trading, but for now let’s enjoy the rest of our weekend and rest up – next week could be very active in one way or the other. 🙂 As always, I appreciate you all for being here, Thanks for being a Chartfreak with me!
.
~ALEX
.
A few additional encouraging thoughts :.
I’ve been running through some charts with the above analysis and found something that adds to the idea that we may be at temporary lows and ready to move higher next week ..
.
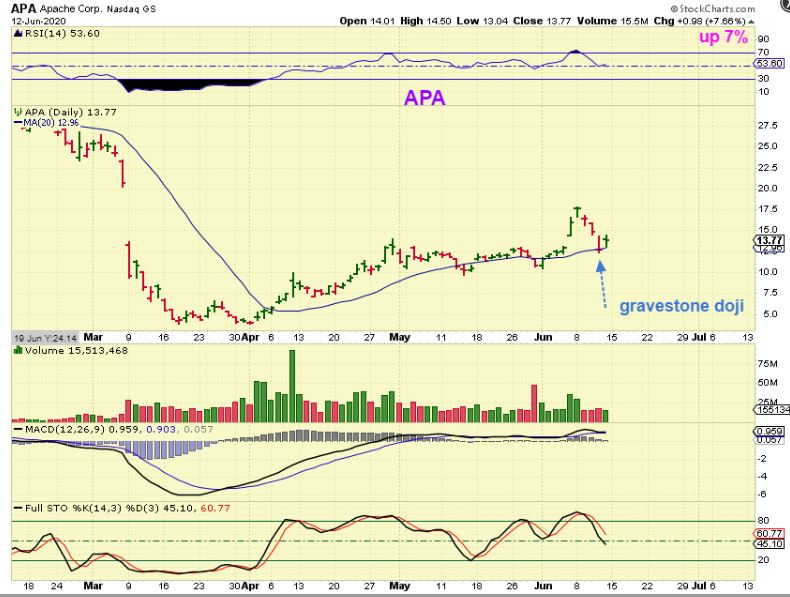
APA – Apache Energy actually dropped to the 20 sma and put in a gravestone doji. It then popped 7 % on a reversal Friday. Is this ready to go higher? IT can at least be bought with a tight stop, but that is not all…
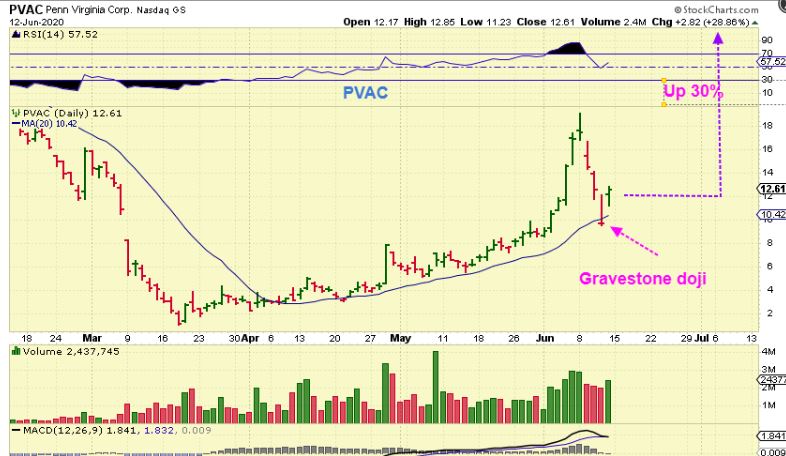
PVAC put in a gravestone doji Thursdy and reversed at the 20 sma, Popping up 30%! Volume was excellent too.
.
.
CPE has a gravestone doji at the end of the sell off and it popped higher too (but sold back down). It was still up 7% at the close, but my point is that these may be ready to go higher and could be considered low risk entry with a stop for protection. My other point is…
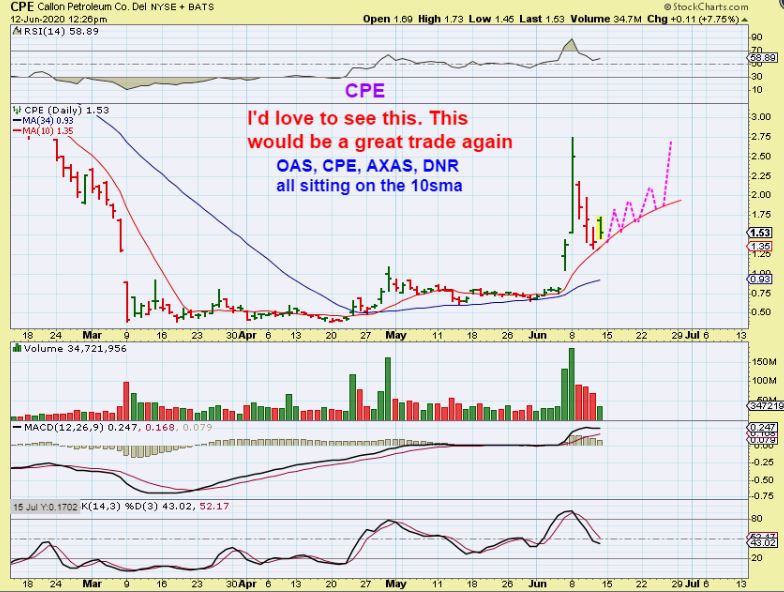
My other point is that if Oil stocks match the General Market, as pointed out in the report above, the General Market may be ready to go higher too. Our Oil list included OAS, CPE, APA, OKE, CLB, CVI, MRO, etc. Look for them near the 20 sma.
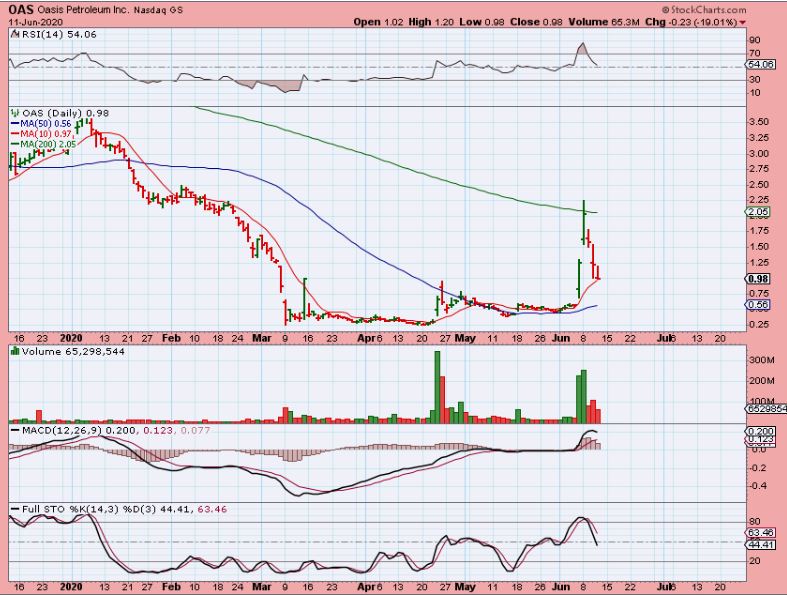
OAS – I actually had this in the Friday report to show a drop to the 10sma, but I didnt even see that OAS had a gravestone doji then too. I wrote then : We bought this on the 50sma and made great gains (300%). If this bounces and chops for a bit, we may get a low risk entry for a great trade , as seen on my next chart…
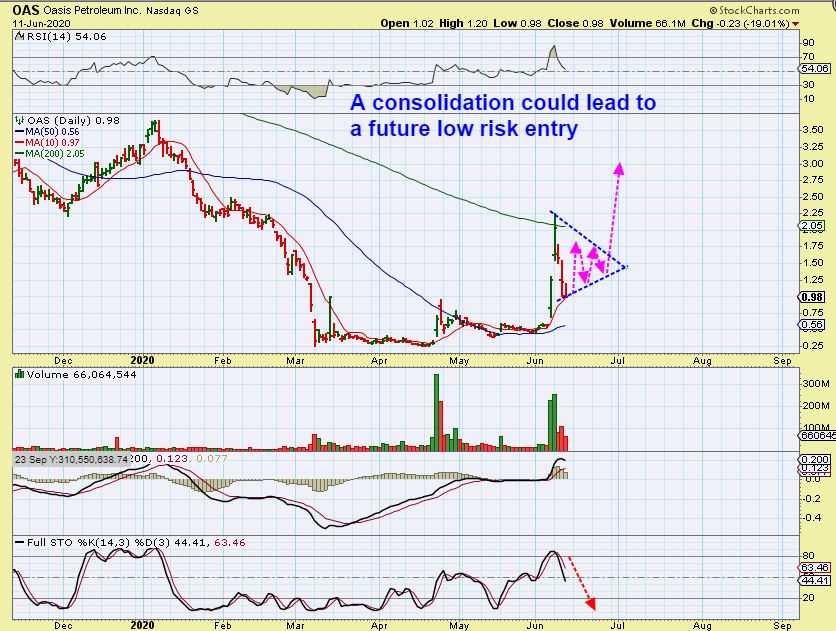
AND I THEN DREW OAS LIKE THIS ( But it may just rally higher from here too ) I SAID FRIDAY: -If I see this, it will be a BUY in the reports and could double or more again. That goes for CPE, DNR , and several others too.
.
ALSO
.
I wrote this in the chat area at the close Friday

.
AND …
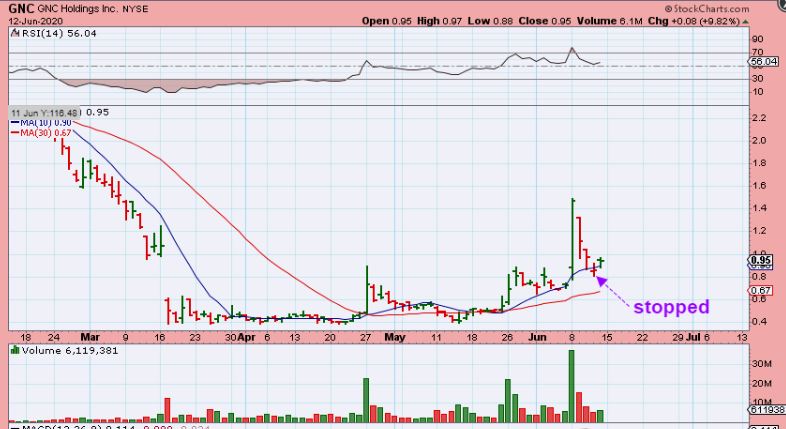
GNC came out with some news Friday and popped 30% in after hrs after this reversal Friday. Guess what? I got stopped out by pennies on Thursday as it dipped under the 10 sma 🙁 I also actually saw other stocks climbing on Monday and on into after hrs , so…
Again, my point is that next week could actually be an UP week and the clues or signs for that are already presenting themselves. I will put any low risk set ups that I see in the reports, but I will also be in the live area below each report to point out any trades that I see in real time. Enjoy Your Weekend!

