June 3rd – Trading
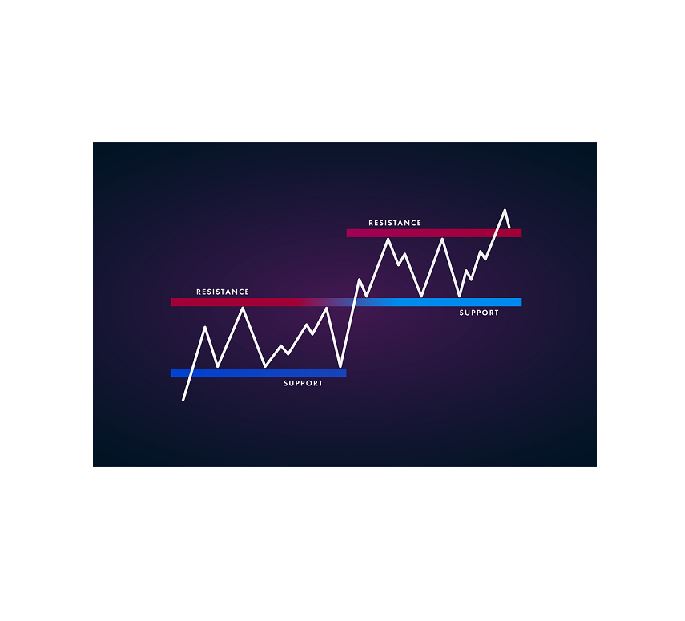
The Theme Picture will come in handy when we get to the Energy Stocks that I discussed in yesterdays report, and even some of the mining stocks that have been chopping sideways.
.
SPX – On day 12, the S&P continued toward that 3200 area, which I just realized has an open gap.
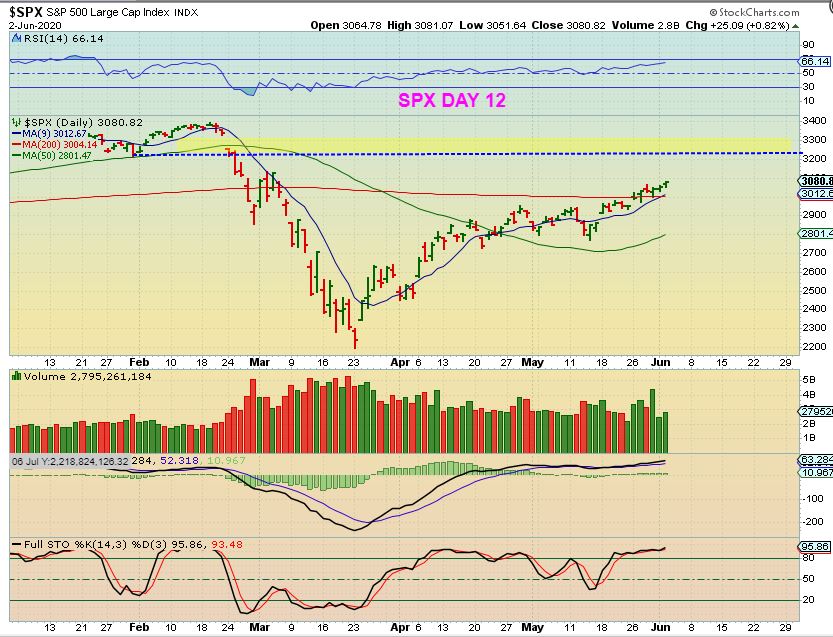
,
VIX– Last week I mentioned that I am just starting to see some signs that may lead to the markets topping after the 2nd daily cycle peaks. The VIX seems to be pinching between the 50 & 200sma, the MACD is slightly rising, and if this breaks higher, it could indicate the markets would be ready to pull back.
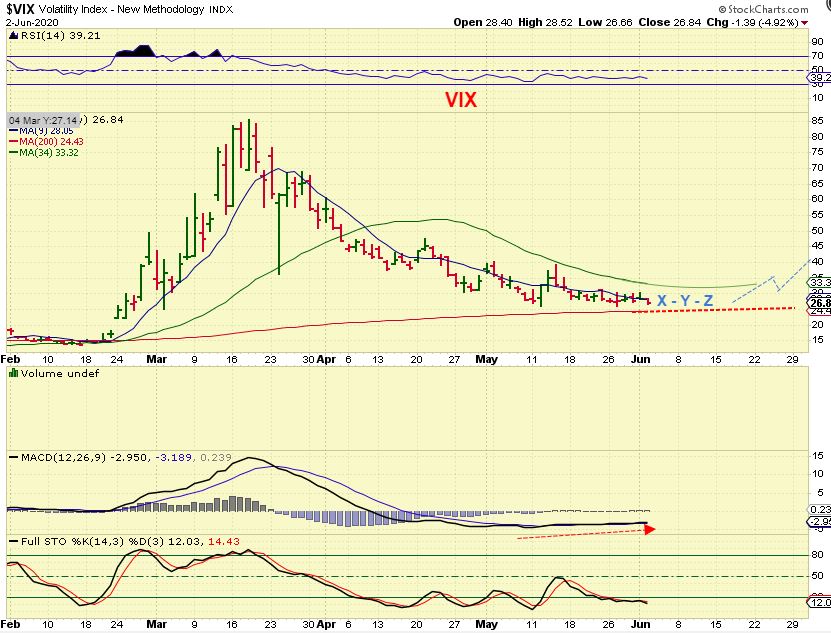
.
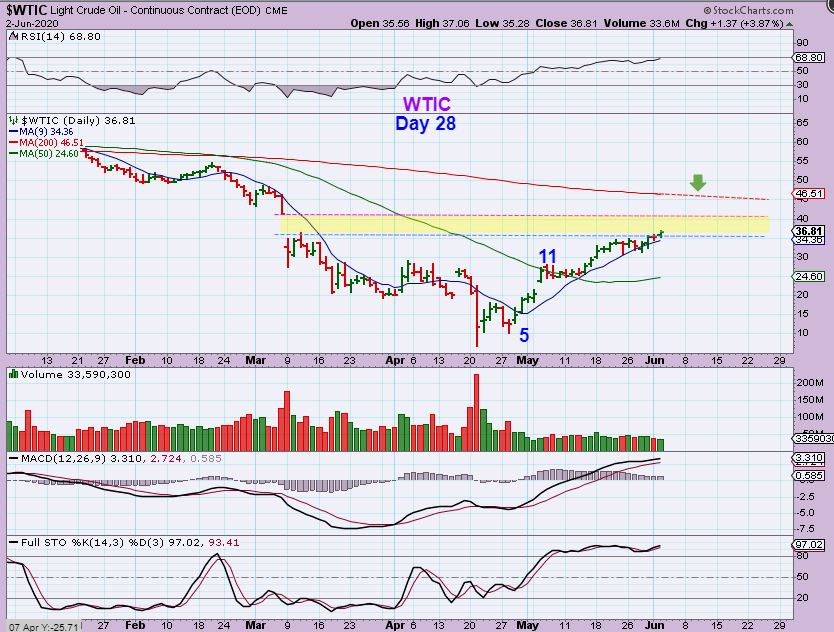
WTIC – Today is the oil inventory report. Lately Oil just keeps climbing , as expected.
,
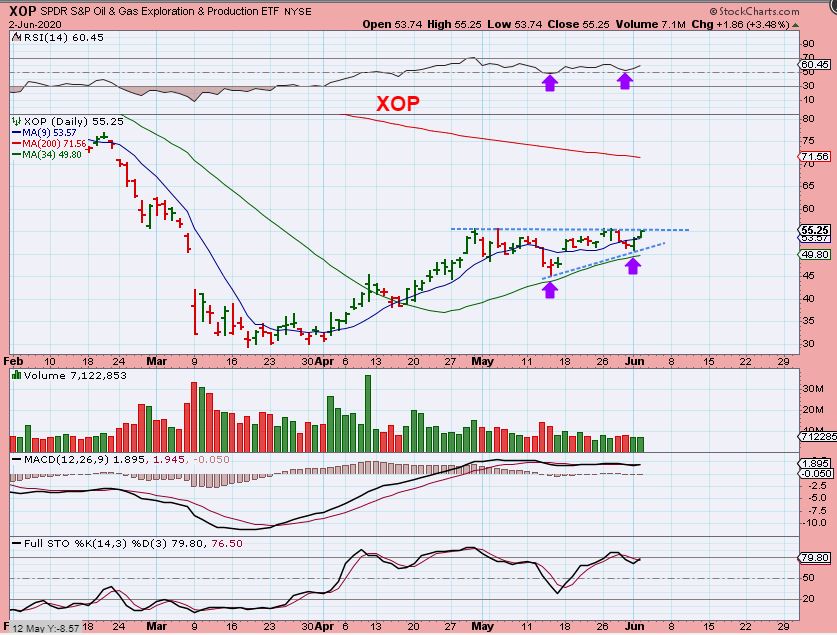
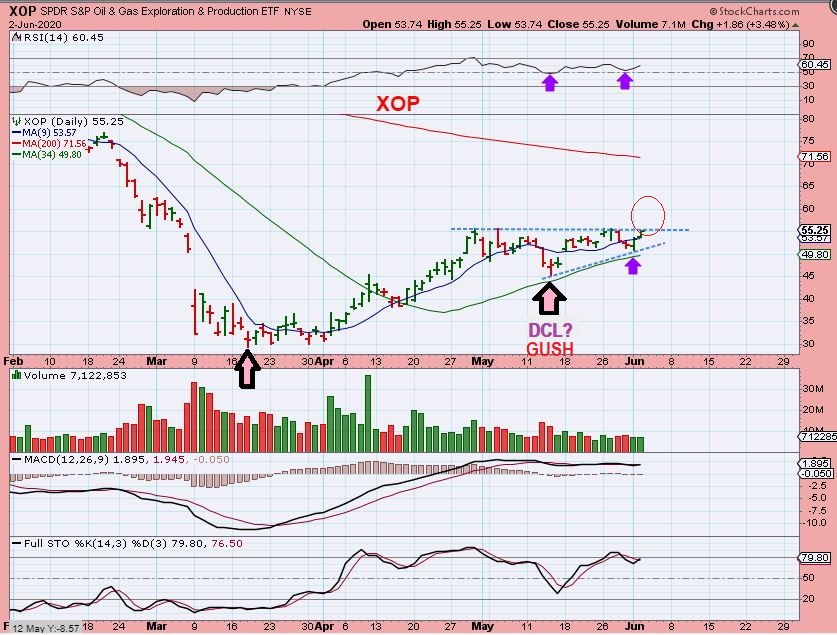
XOP -Yesterday I discussed Energy stocks as being set up to buy. This looks ready to break out after a sideways consolidation, so I am going to discuss that further at the end of the report. This is a bullish Wedge ( Gush) .
,
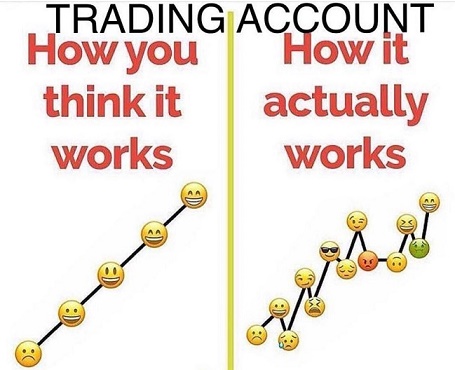
TRADING IN CHOPPY MARKETS: I thought that this picture was EXACTLY how trading goes in choppy markets, even if they are trending higher, when we only look at our account balances instead of the charts. 🙂 If you can zoom in on the faces, they are very emotionally expressive and rather funny.
.
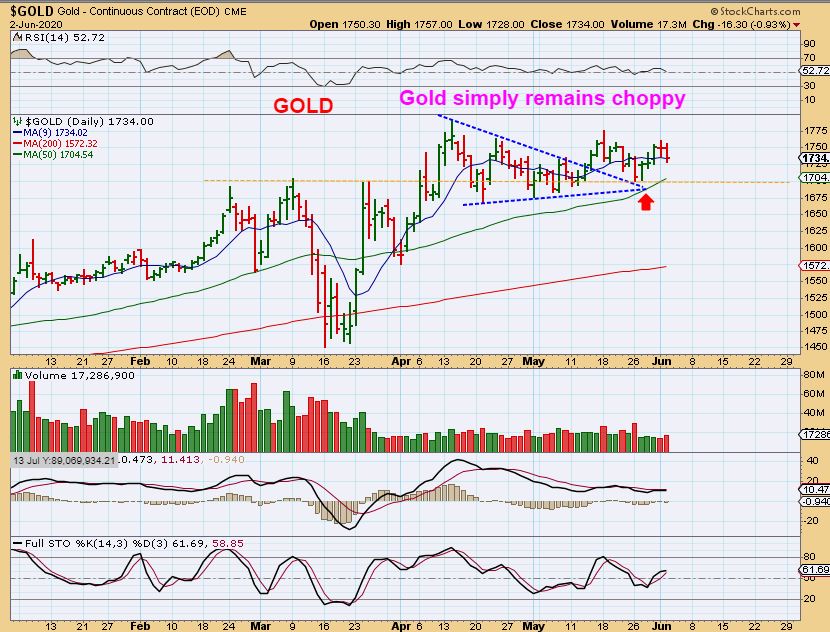
GOLD is back to being a choppy sideways consolidation. At the red arrow we have a back test tag of the triangle and the 50sma is rising. This chart is short term neutral, since it can drop or Pop.
.
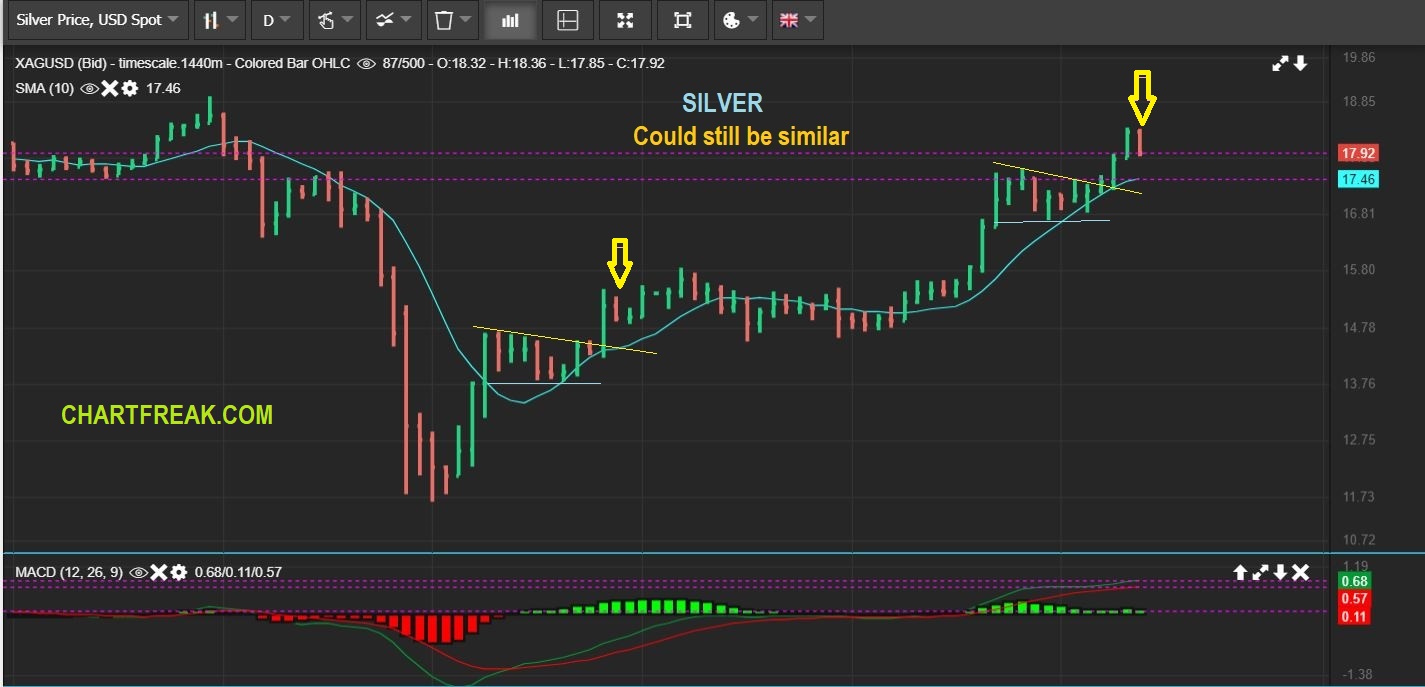
SILVER s drop was not bearish, and I drew it here as being similar to our prior break out from a triangle.
.
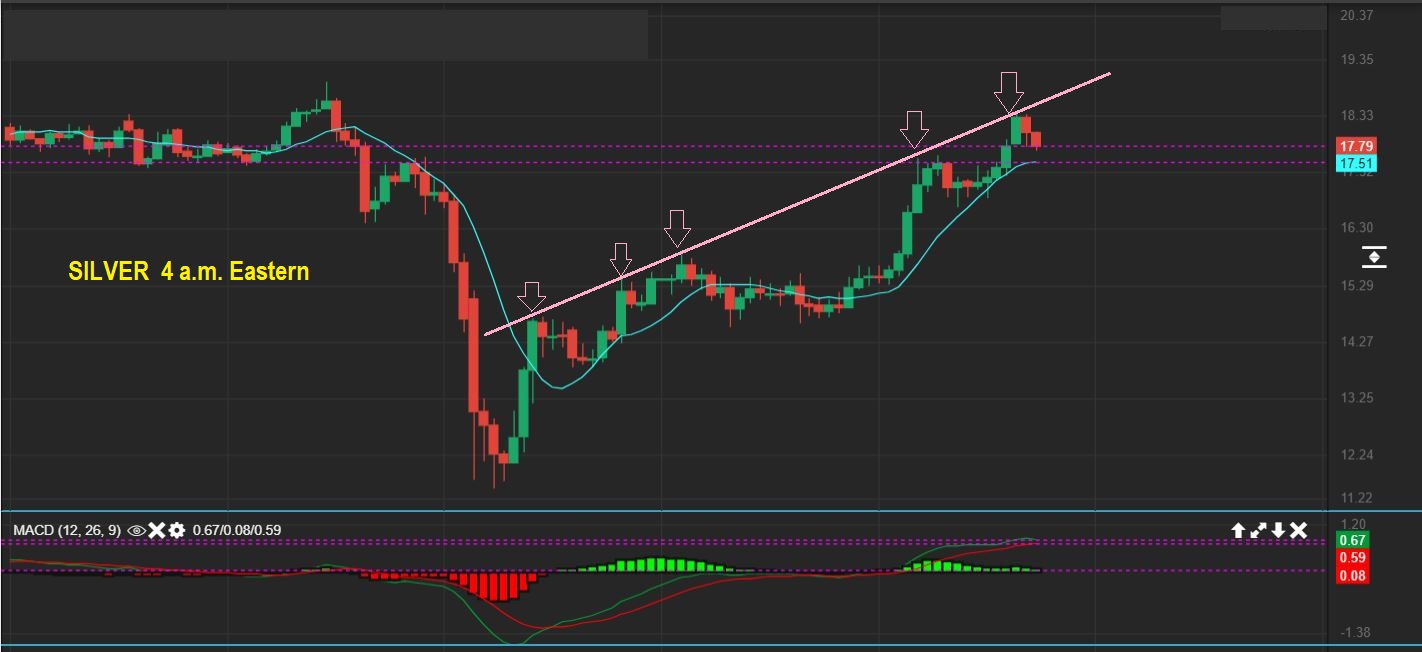
SILVER at 4 a.m. Eastern time, Silver has dropped further and is near the 10sma. We have an upper trend line that is holding price. I could draw a rising wedge, but decided to leave that out for now.
.
The sector is Bullish, but I’ve been asked ( every day actually) about Cycles, and ‘What if this is Left Translated? ‘ ‘Is this topping?’ ‘What is going to happen if this drops further?’. etc As you will now see below, These are all questions that I cannot answer yet, because it takes time for these things to play out, especially when it gets choppy.
.
AT THIS POINT, Miners and Metals have been Very Bullish and the big picture remains very bullish, but it does get choppy at times. I have mentioned that I see weakness in NEM, Barrick Gold, etc. They ran strong, and now started to roll over ( Normal correction most likely). I saw rotation into the Juniors and explorers, but now a little weakness appeared there yesterday too.
.
With that I will draw a few different ‘ideas’ of how this could play out, but it will obviously take time to know for sure.
.
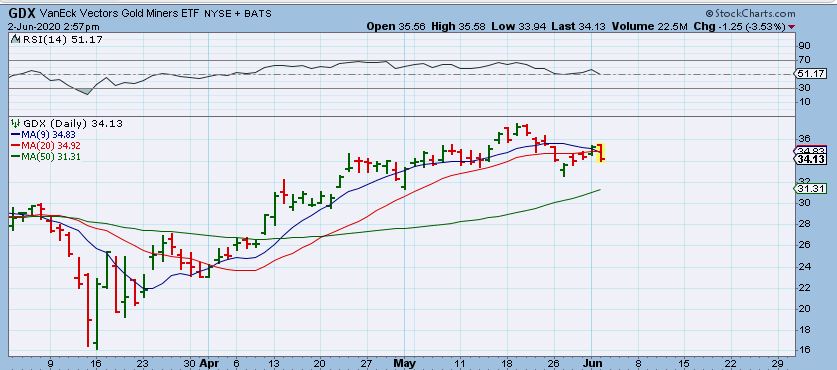
Yesterday before the close I posted GDX in the live area below the report as a possible bearish engulfing. I’m not trying to panic anyone, but this can drop further. I have already stated that NEM, Barrick Gold, AEM, FNV, etc had a strong run and are now consolidating, and they are dropping. As a short term trader, I see things that SHORT TERM indicate weakness. So…
.
SAME CHART: I personally don’t like this short term as a ‘trader’, because I already mentioned that this looked like a bear flag until it resolves upside. Now with this drop, this honestly looked like
1. A bear flag, rejected at the 10sma
2. A bearish engulfing candle and
3. A possible mini H&S forming.
4. So this can drop to the 50sma and be normal though. So…
.
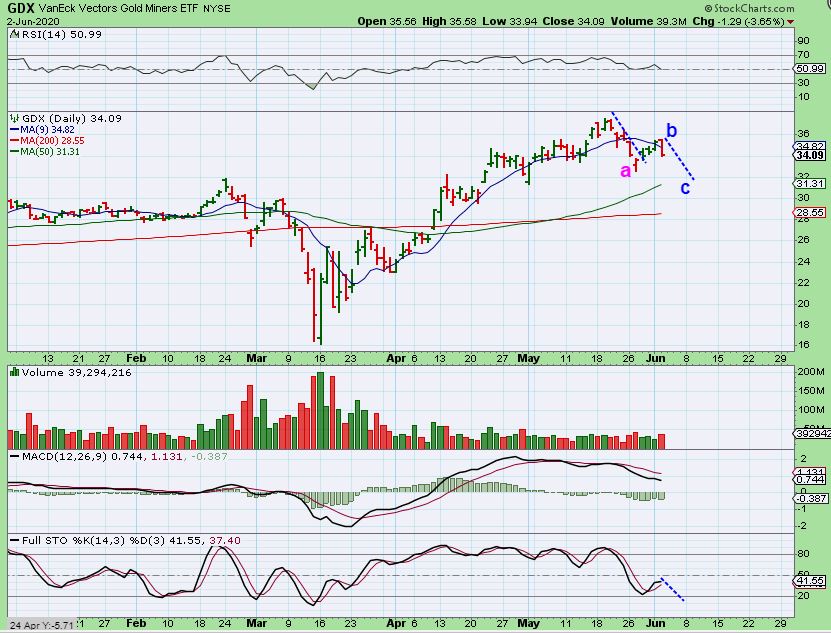
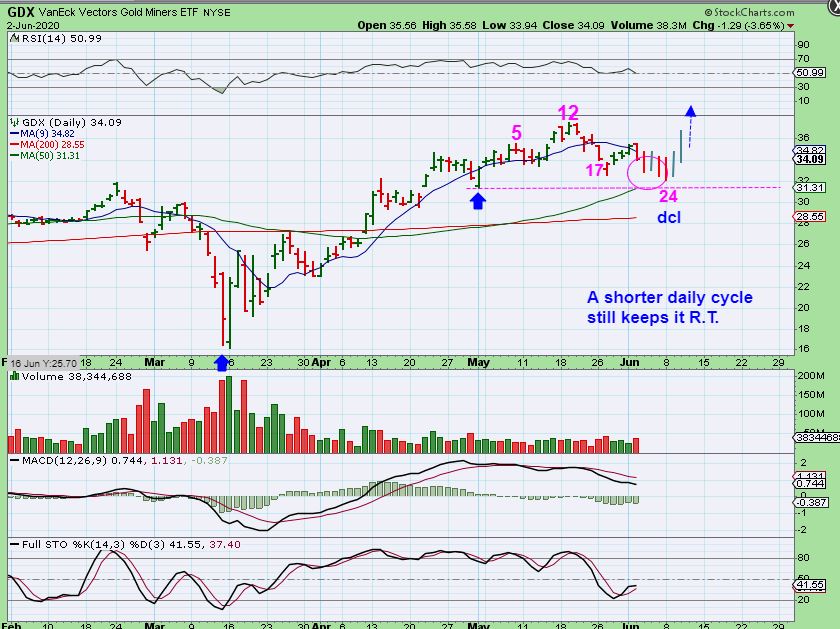
GDX -This could be an A-B-C drop toward the 50sma and a dcl. This is still a normal drop /consolidation though .
.
GDX could drop straight to the 50sma, and put in a dcl on day 24, that would be R.T. ( or neutral). This may be less likely to have a short daily cycle, but in a Bull Run, surprises are to the upside and a back test & run is normal bullish behavior, so I have this as a possibility.
.
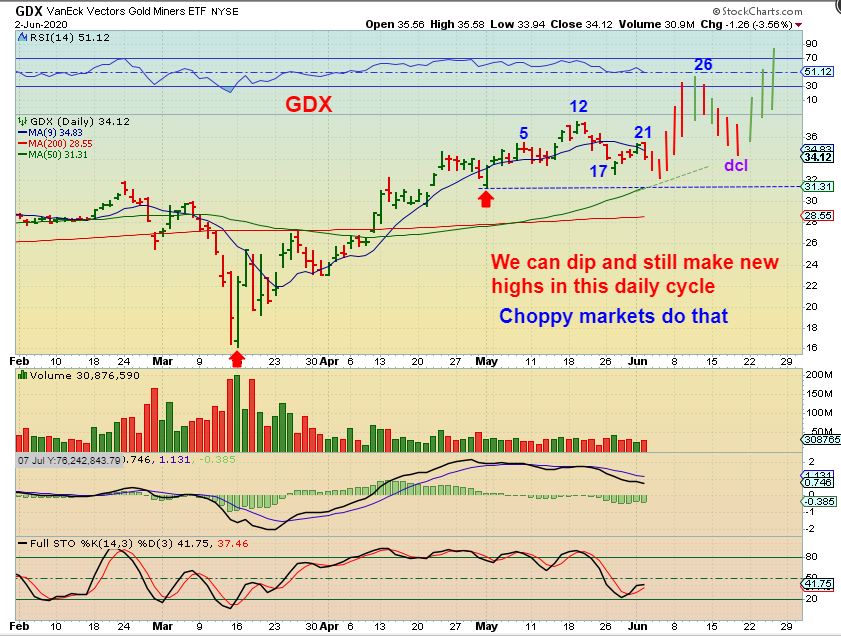
GDX MORE COMPLEX – Go back and take a look at the THEME PICTURE. A complex choppy sideways consolidation is normal too. This shows a day 23 tag of the 50sma, then a burst higher into day 26 R.T. peak, and THEN the dcl later. NORMAL CHOPPY SIDEWAYS CONSOLIDATION WHERE THE BULL TRIES TO BUCK RIDERS OFF.
.
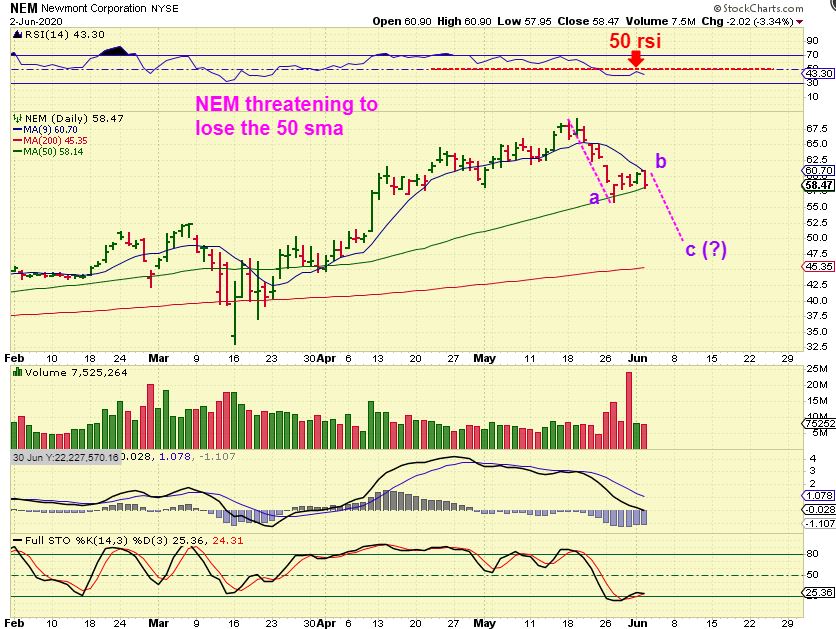
I saw NEM rejected at the 10sma and is threatening to lose the 50sma.
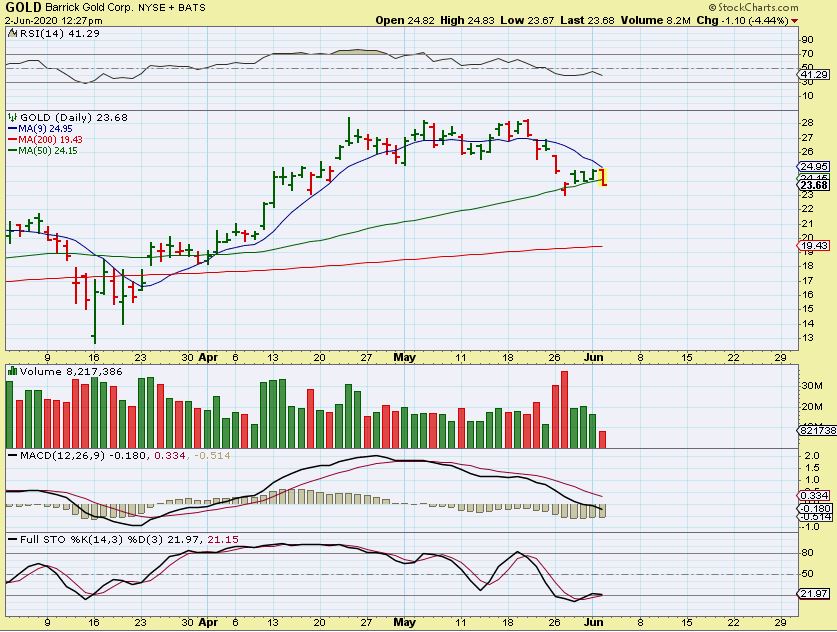
GOLD (Barrick) – So Barrick was rejected at the 10 sma and did lose the 50sma. It may be a shake out, but this looks like it definitely could do an a-b-c down to the 200 sma too.
.
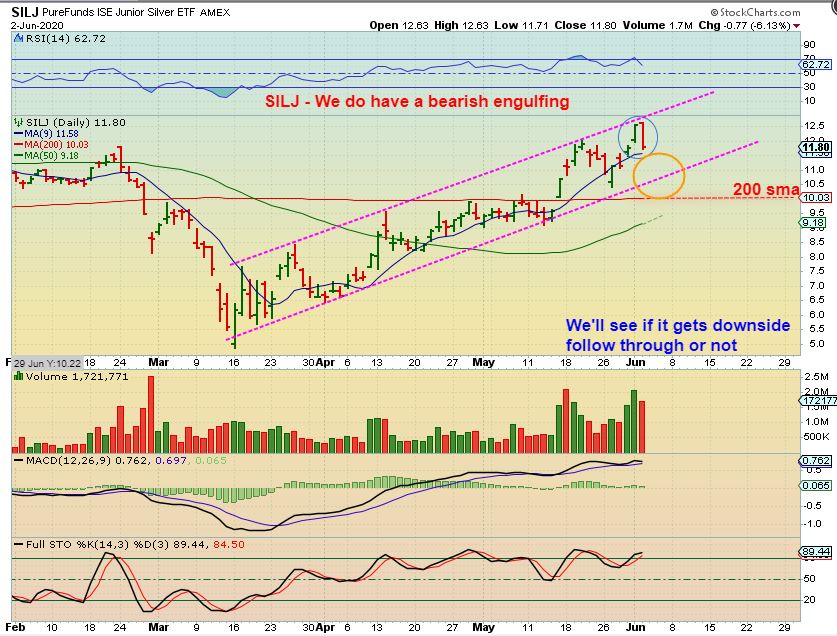
SILJ was a bearish engulfing so it looks like there could be further downside. There could be a decent buying opportunity if this drops as shown, but it means that Silver Stocks have further downside too.
.
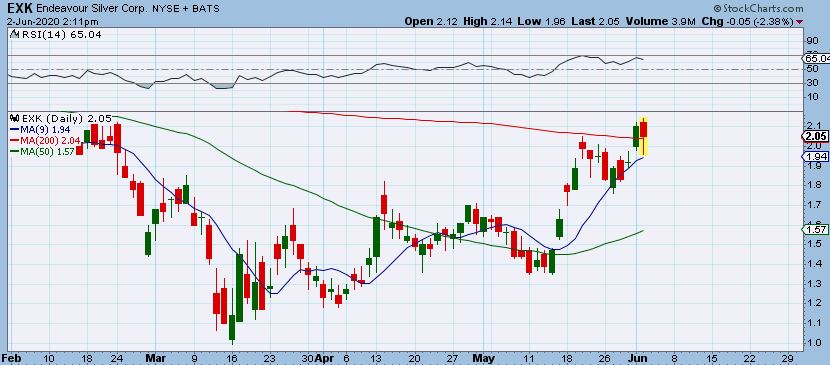
EXK – It was encouraging to see some Silver stocks drop and show a little strength into the close. EXK bounced off of the 10sma and regained that 50sma. I grabbed this chart at 2 P.M. Eastern, and it did close here at $2.05
.
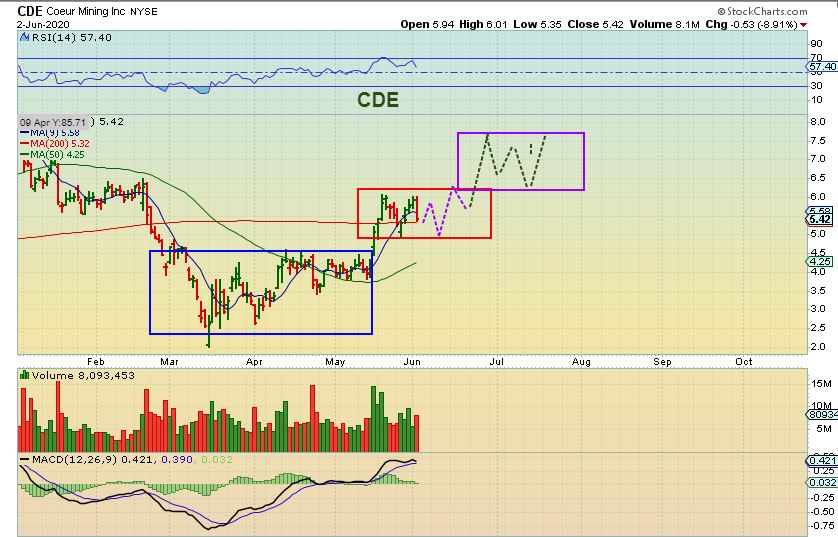
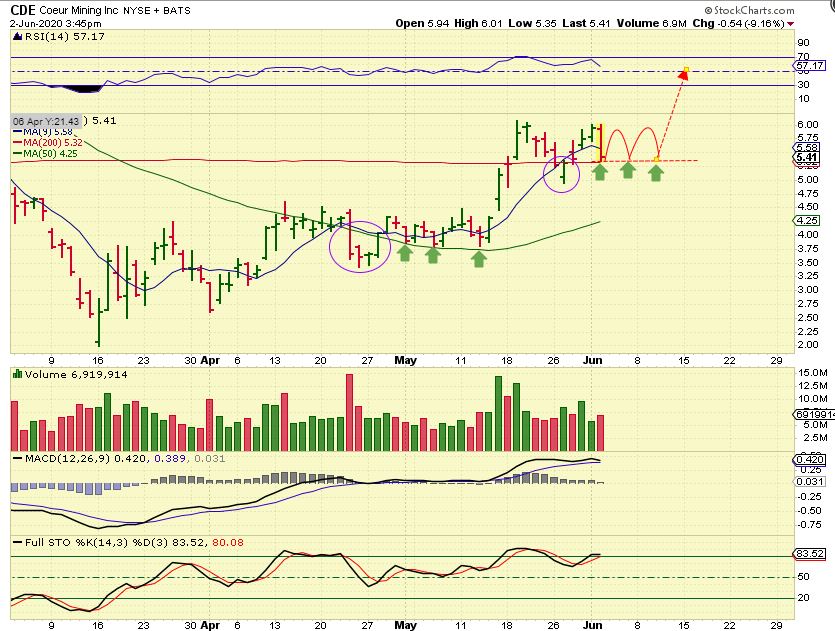
CDE dropped to the 200sma, so it could also break down further, but I’ve drawn it here with the possibility that the Silver stocks hold up better than NEM, BARRICK, etc. This would reflect the same action that we saw at the 50sma. It broke down, recovered & bounced along the 50sma 3 times. Like I said,
.
Like I said, it takes time for these things to play out. The Big Picture seen in the weekend report hasn’t changed, but shorter term, we are getting that choppy consolidation action that takes time to work its way out.
.
For those concerned about Daily Cycles: Even if this daily cycle formed as L.T., you don’t need to be overly concerned if you are holding , because the 3rd daily cycle still rises up and you can sell that push higher if you want to at that point. Everyone wants to see a 2nd daily cycle that is R.T. , since it shows strength and usually the 3rd daily cycle can be expected to then break to new highs. If this chops and forms L.T., it can still break to new highs in a Bull Market Run, but even if it doesn’t, it will bounce higher out of that dcl & you can jump out then if you want to. THESE ALL TAKE TIME TO PLAY OUT. As an investor, we just ride out consolidations and wait for the next leg up. As a trader, we often try to avoid the sideways chop and lighten up to enter other trades that may be ready to go immediately. I think Energy is set up that way, so I will discuss that a bit further below.
.
We’ll just have to wait and see what Wednesdays trading brings our way, enjoy your Wednesday trading!
.
.
~ALEX
.
Since the XOP bottomed well before Oil did, I think we just saw a dcl well before oil is ready to dip. That makes this a bullish flat topped wedge that is about ready to break out ( in the apex). Our Energy stocks have been choppy and hard to ride at times, but I think that you’ll be amazed at the gains.
.
We have traded APA, CLB, PVAC, SLCA, OAS, DNR, WTI, ERF, AROC, OKE, BTE, VLO, HAL, MRO, etc. You may want to look those charts up, here are a few below.
.
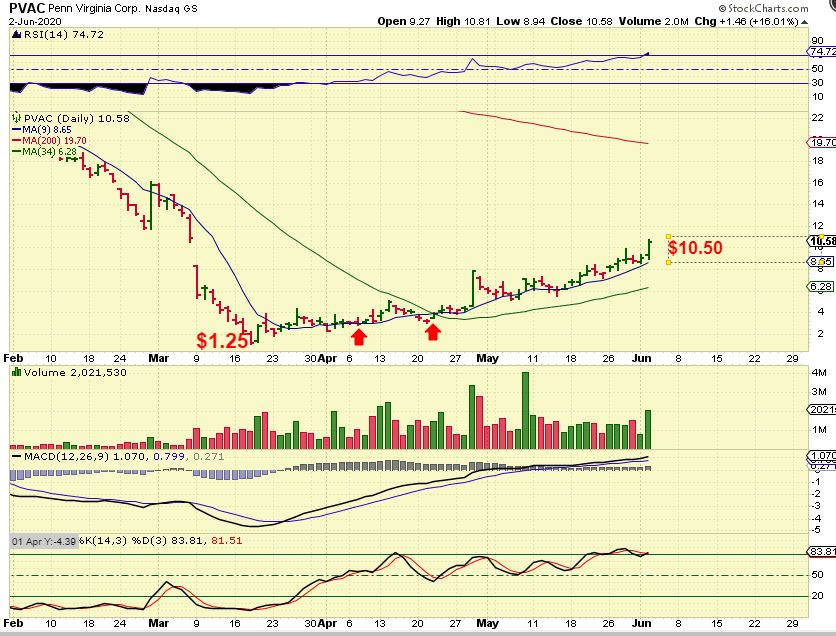
YESTERDAY I SAID : PVAC has been steadily climbing the 10sma, and many others have these same characteristics at this time.
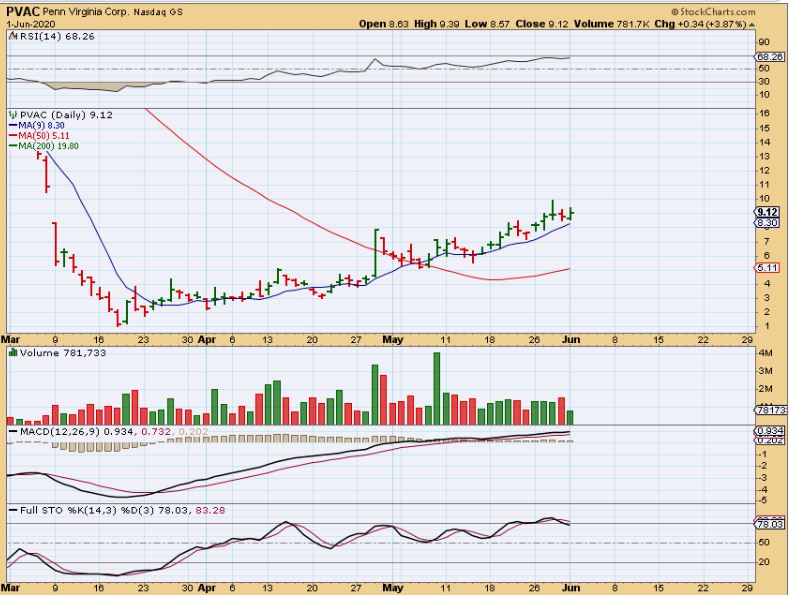
.
PVAC popped 16% yesterday and look at that chart. $1.25 ro $10.50, possibly on the way to $20. I have owned this a few times just scalping gains, but I wish I had kept a core position.
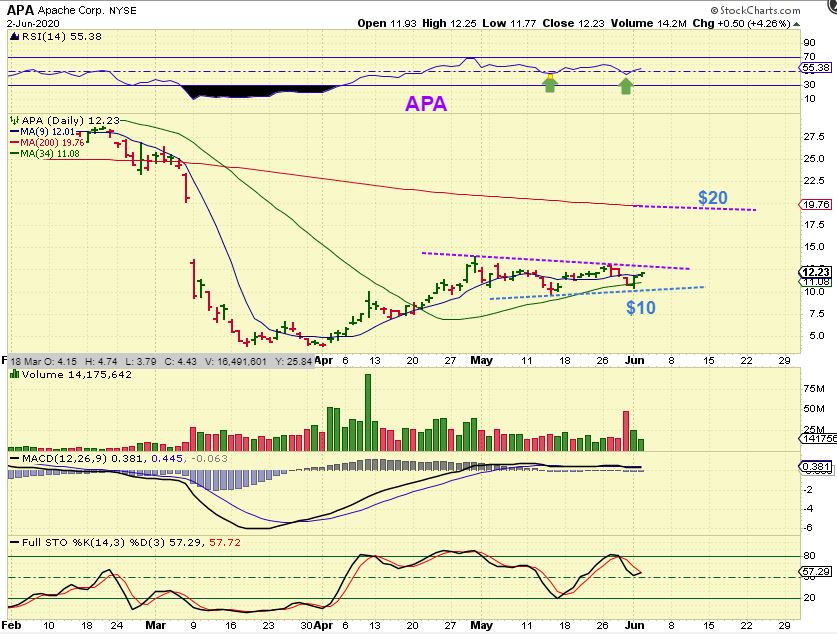
YESTERDAY I WROTE: APA is an example of a set up that looks bullish. After filling a gap from May 18, it reversed higher.
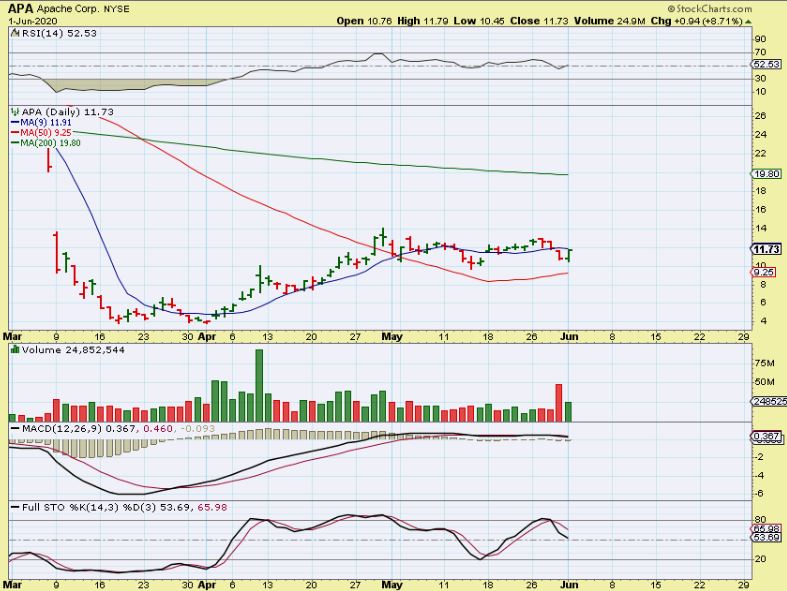
.
APA only pushed up 4% yesterday, but this set up is quite bullish too.
.
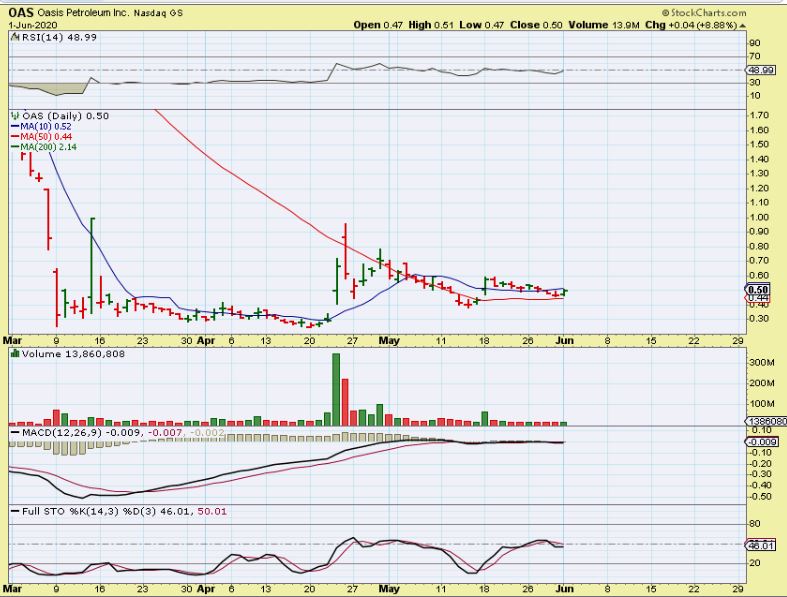
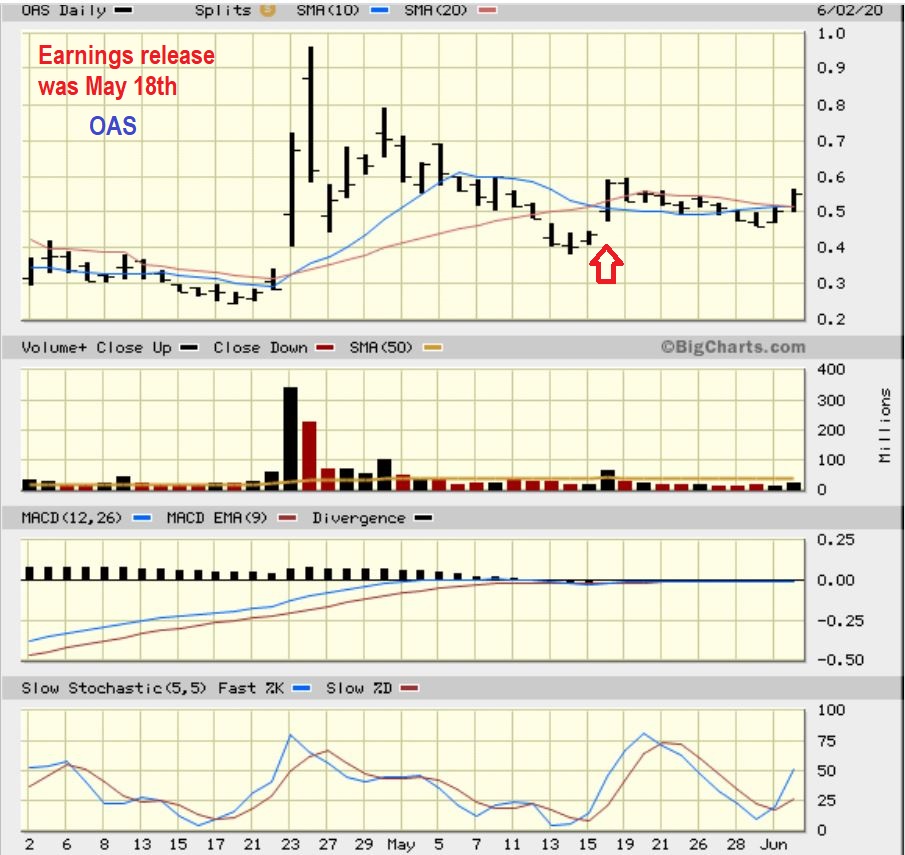
YESTERDAY I SAID: OAS reversed higher after tagging the 50 sma. You could buy this with a stop. I bought it with some $$ that I got from selling leverage ( USLV).
.
OAS popped 6% yesterday and I did a little research. That POP at the red arrow was from their earnings report, so now that earnings is behind us, I bought some OAS for a trade.
.
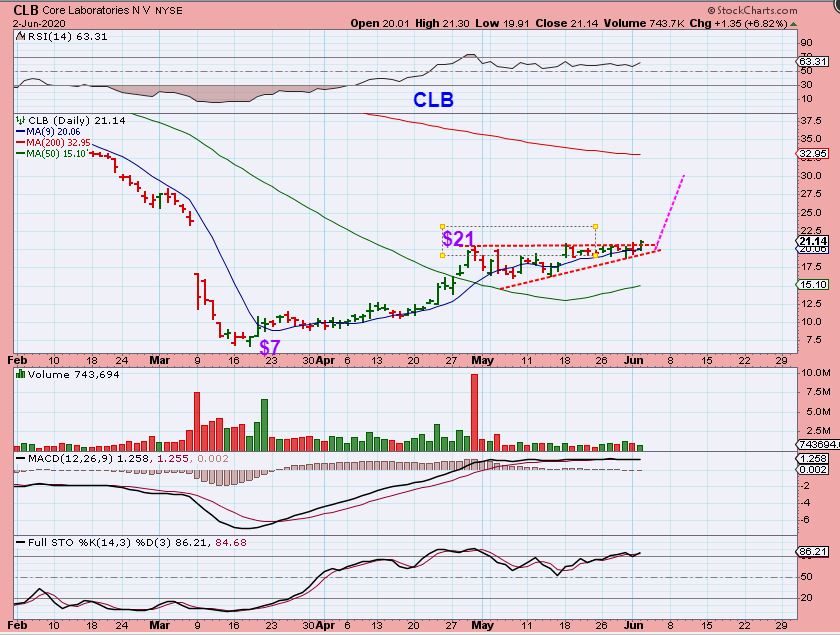
CLB – I traded CLB and I think I made roughly about $2 / share on it, but take a look at this run. That is 200% off of the lows? I knew these stocks were going to do this, and I wrote in my reports that these stocks would probably run up and at least fill those Big Gaps on the left, but the chop was difficult to ride at times. This did drop from that $21 high to $16 a week later, and THAT IS NOT EASY TO RIDE.
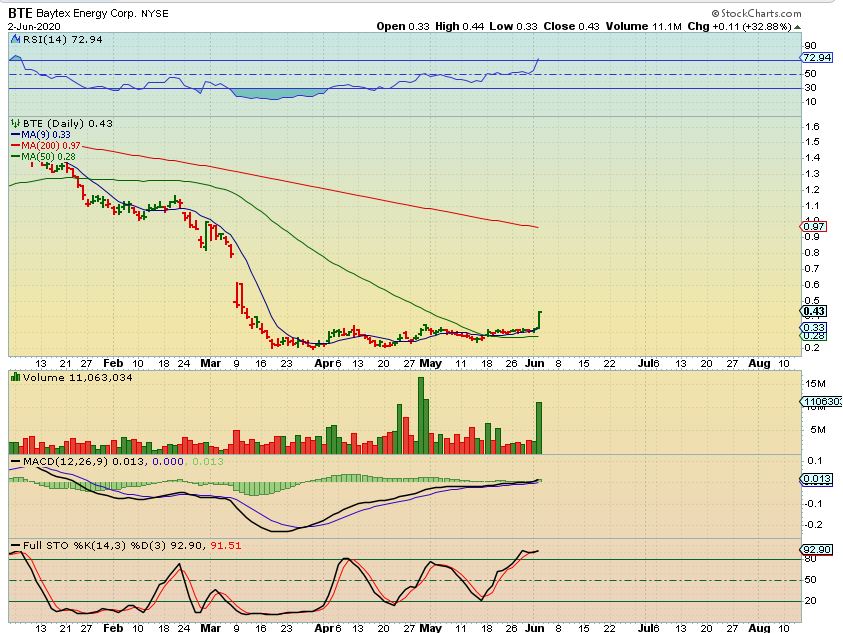
BTE & GTE both Really Popped yesterday. 32% out of a tight base. Some of these small;er energy stocks act like the junior or explorer Miners have been. OAS, LPI, WTI, etc fall into that category.
.
So as mentioned: I sold some USLV Monday and Tuesday and have now started to enter Energy stocks. These were mentioned as BUYS in yesterdays report. I lightly trimmed a couple of positions in Miners too, where I have BIG gains to try to re-enter lower. THAT is what short term traders in front of the screens all day do. For longer term traders/ investors – Riding out the choppy sideways consolidation can be difficult and frustrating, but like the energy stocks above, and the Miners that we already have been riding–it can be very bullish with good gains over time. Step by step. SCROLL DOWN.