
May 30th – The Weekend Report
The weekend reports are important because they basically cover the Bigger Picture. In Fridays report, I discussed hints or beginning signs of possible weakness in the General Markets with the Vix, The Inverse ETFs, etc. These are things that I will continue to watch as time rolls on, but as you will see, in the Big Picture everything still remains bullishly aligned in the Various Market Sectors. Let’s just get to the charts..
.
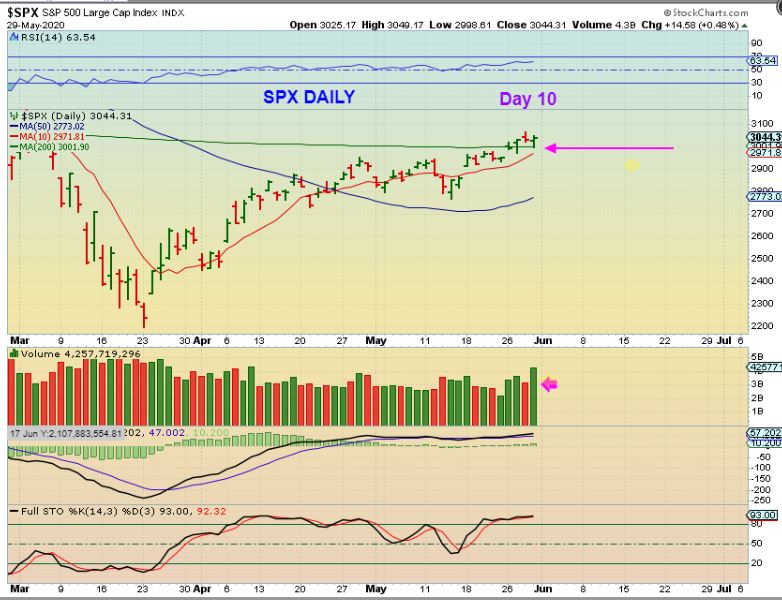
SPX DAILY – On Friday, day 10 of the second daily cycle, we saw a drop to the 200sma that held as support. Price reversed and that is short term bullish.
,
SPX WEEKLY – I have been saying that I want to review price as it gets to the 3200 area, and this could possibly be the peak of the 2nd daily cycle.

,
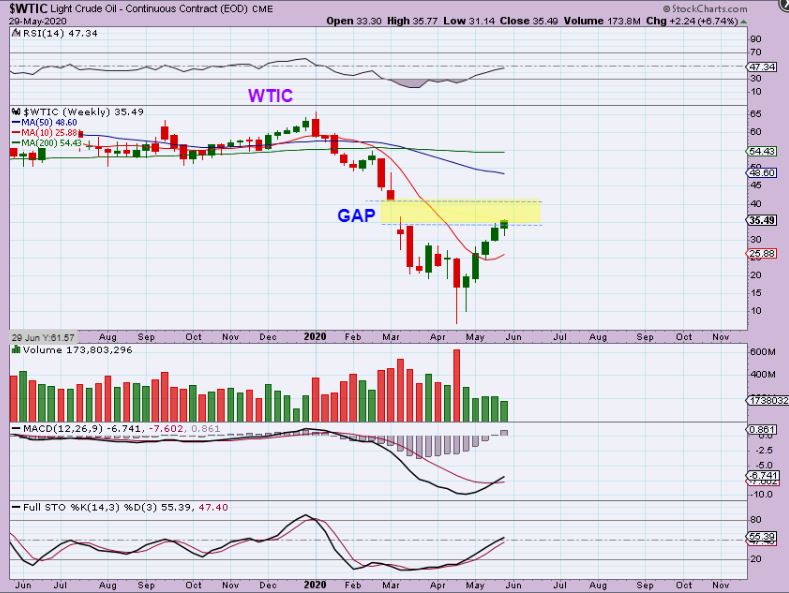
WTIC – Oil continues to rise out of the ICL , as expected. I would think that it will fill that gap on this daily cycle.
.
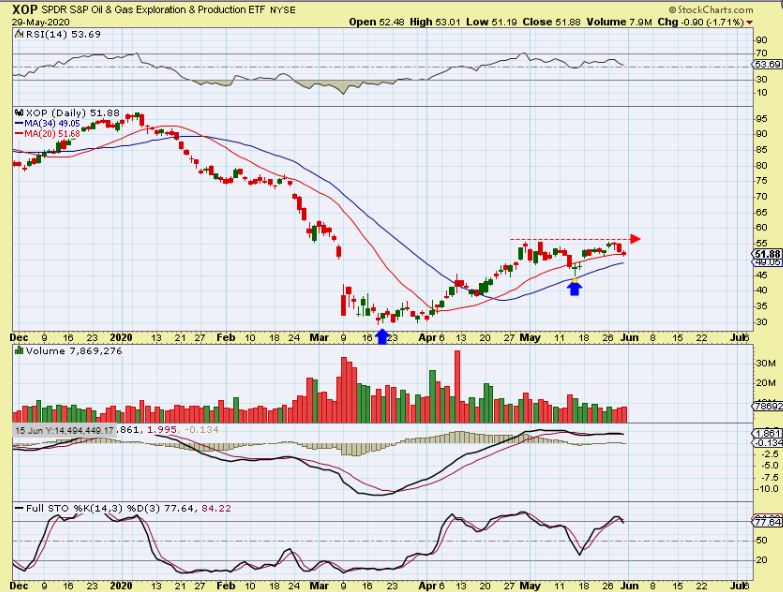
Oil stocks bottomed weeks before oil, and now that Oil is rising, some Oil stocks ( and XOP, XLE, OIH) have started to chop sideways and seem to be consolidating some of their gains.
,
USD WEEKLY – The USD dropped last week and even though it has mainly stayed inside of the BLUE CHANNEL, it does have room to drop down to the red line. The weekly stochastics has room to drop, the MACD is crossing down, and the RSI dipped under 50 ( and could drop to 30). The last time the USD was at the red line was the March crash.
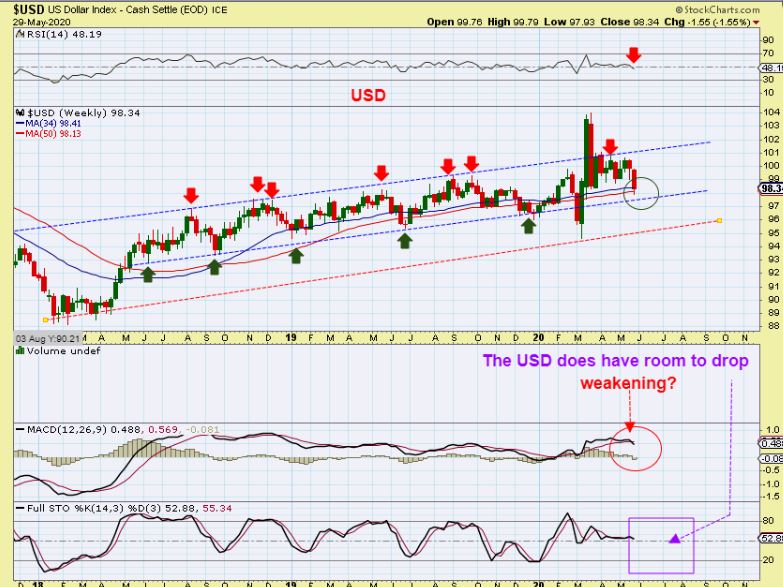
I’ve already been expecting Gold to push higher, but a drop in the US could help Gold to push even higher.
.
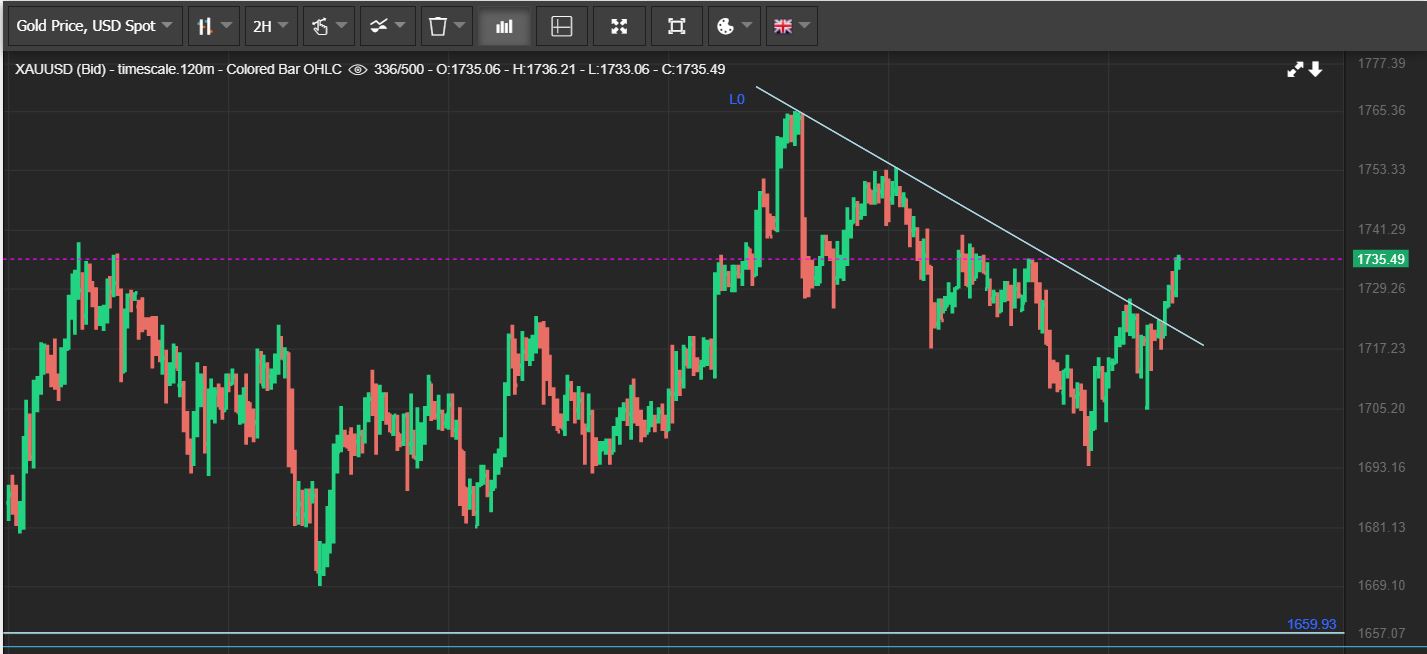
GOLD – On Thursday morning I used the 2 hr chart to show that channel close up. A break out from here would most likely gain follow through buying.
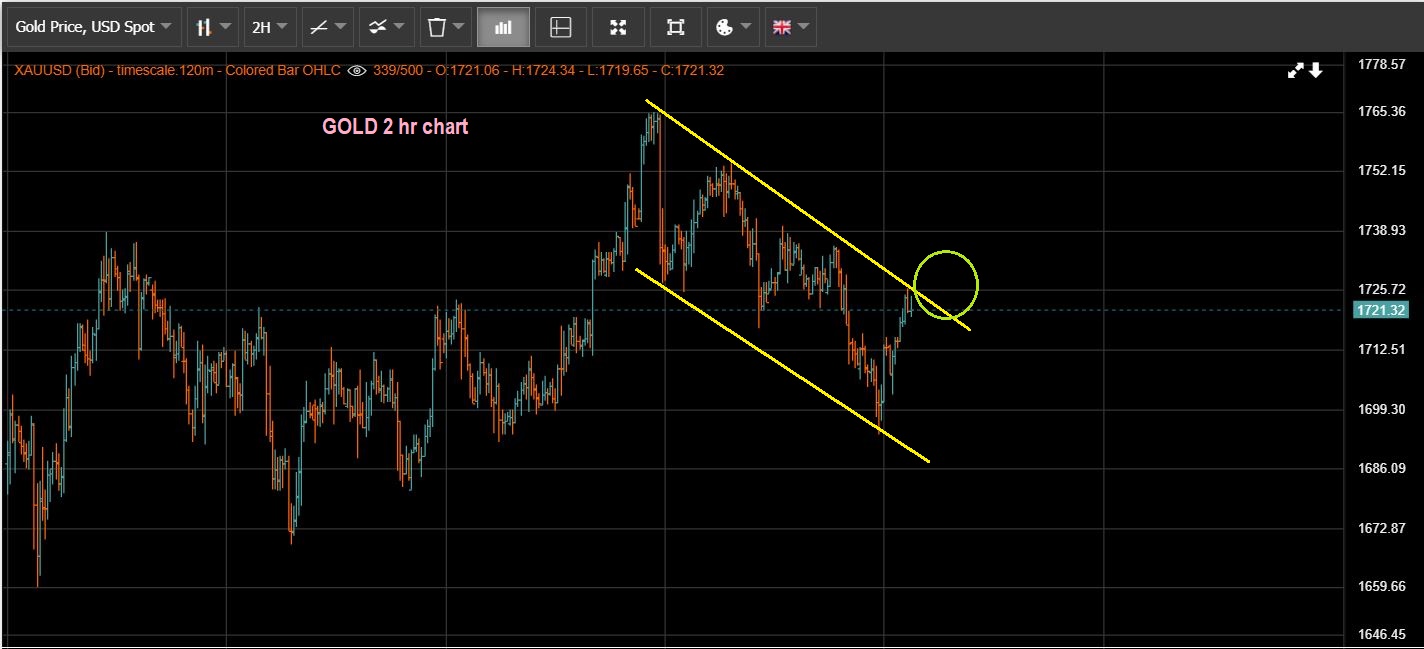
It broke out Friday.
,
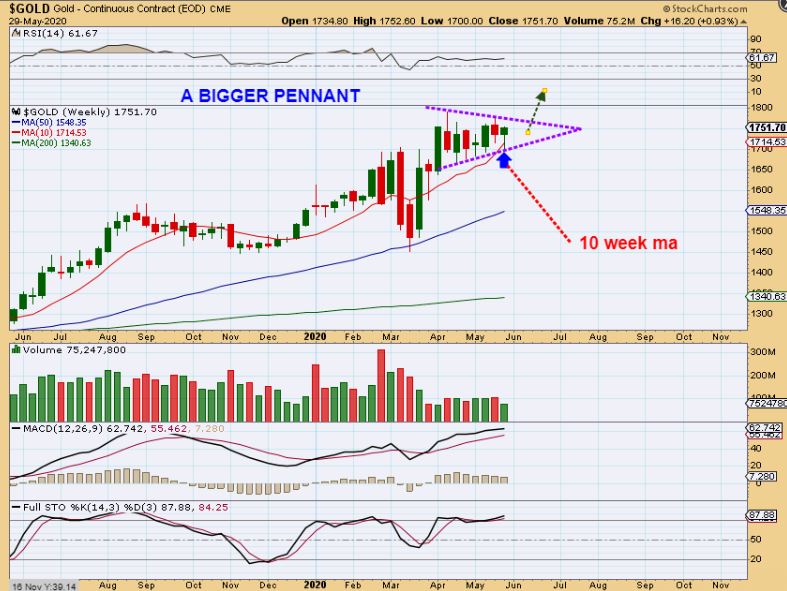
That gave us a reversal candle off of the 10 week ma on the GOLD WEEKLY CHART. That is bullish. We also now seem to have a new longer pennant.
,
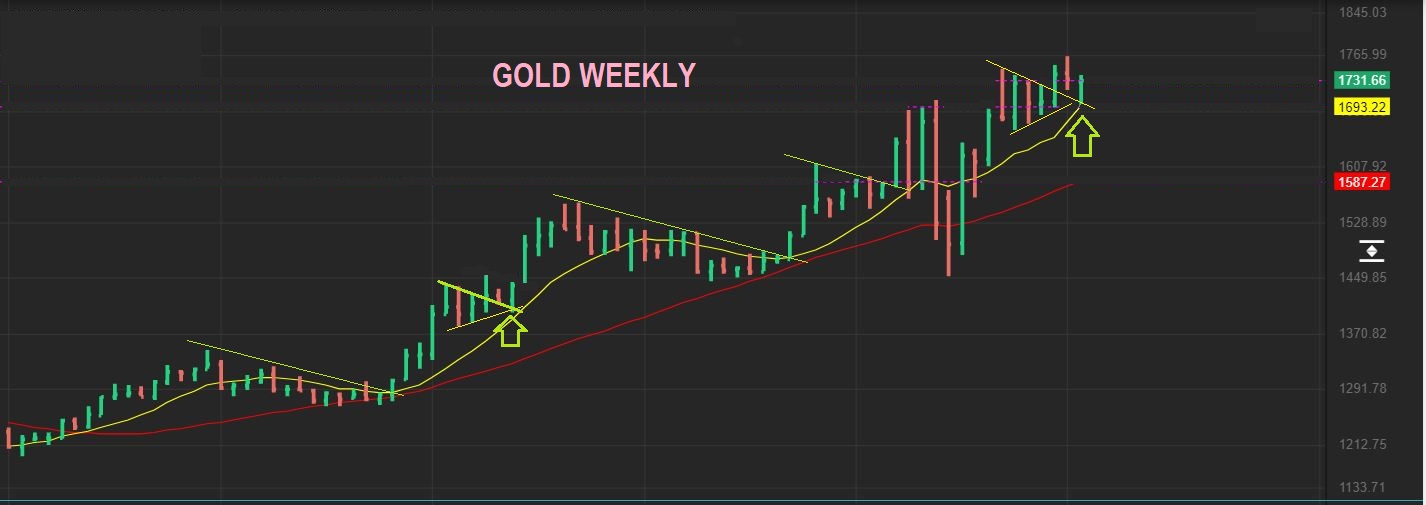
Similarities continue on the 2 triangles that I have been comparing ( 2019 & 2020) , so next we would expect higher price to continue. The arrows show both pennants moved to the yellow line & then popped. That was followed by a rally.
.
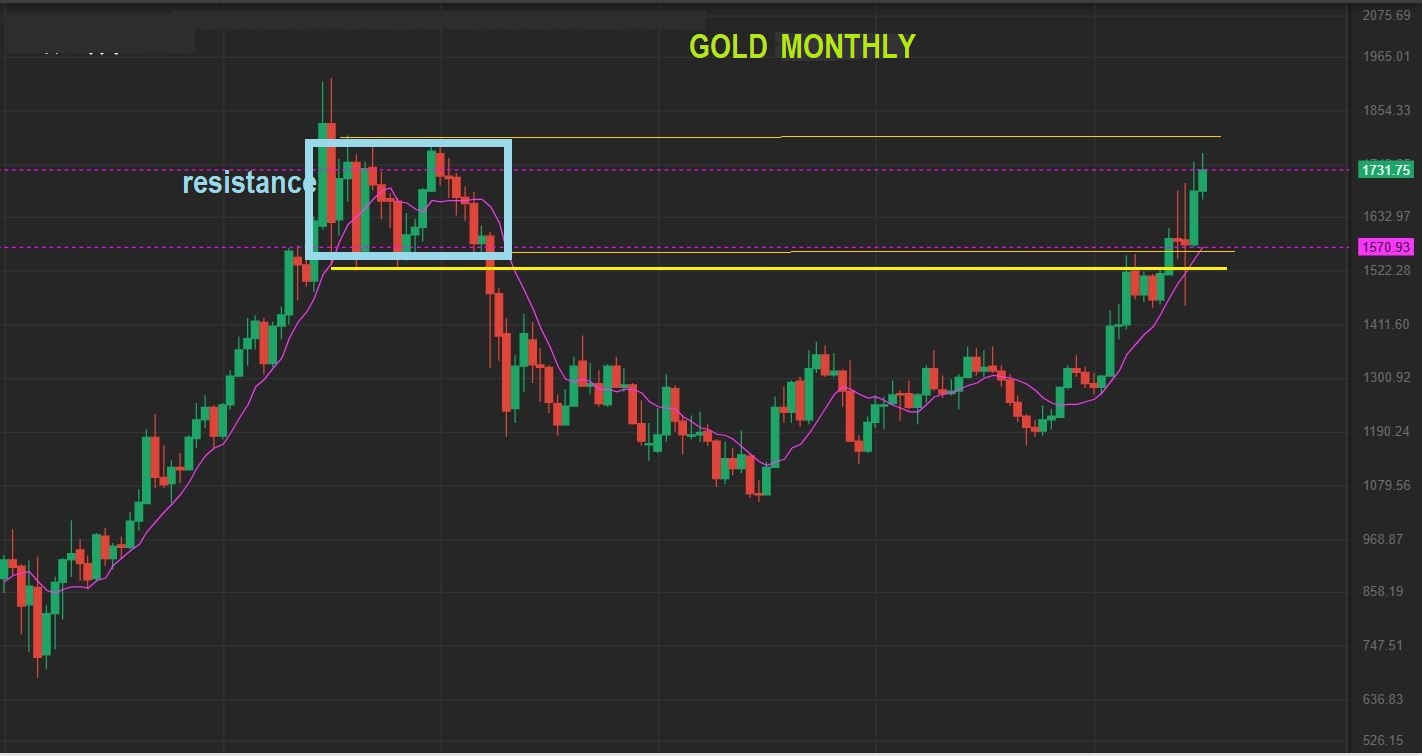
GOLD MONTHLY: The really Big Picture shows us how Gold paused at resistance and then started to chew through that area in 2020. Gold is finally headed to all time highs.
.
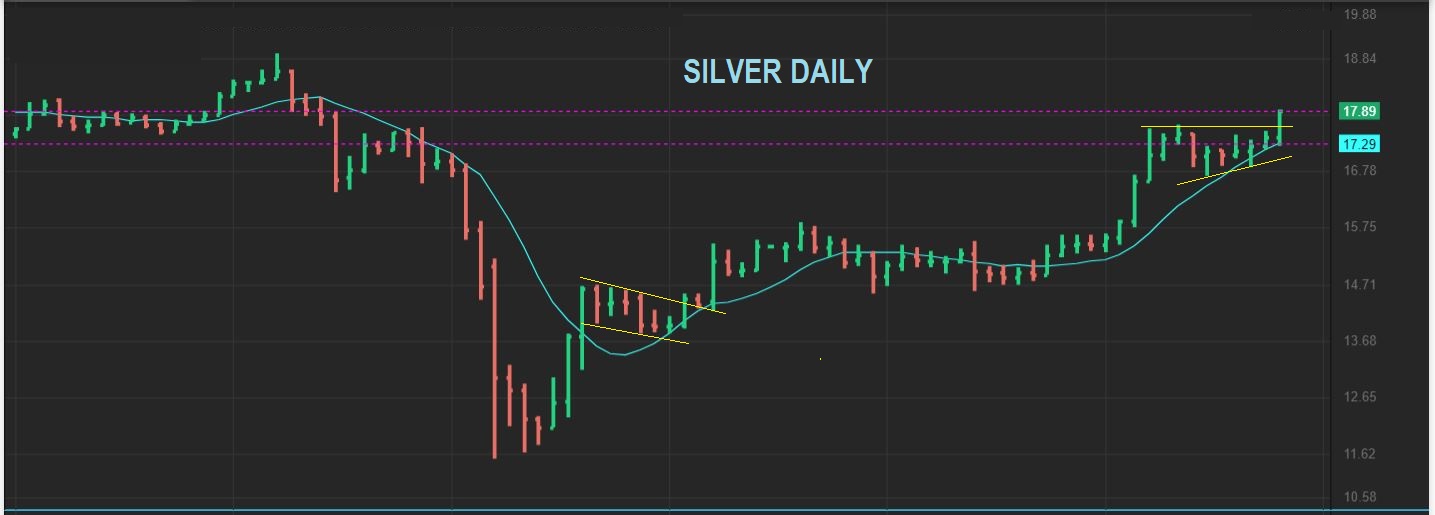
SILVER broke out Friday on the daily chart. Silver stocks did well, and that is what I have been saying that I am focused on.
.
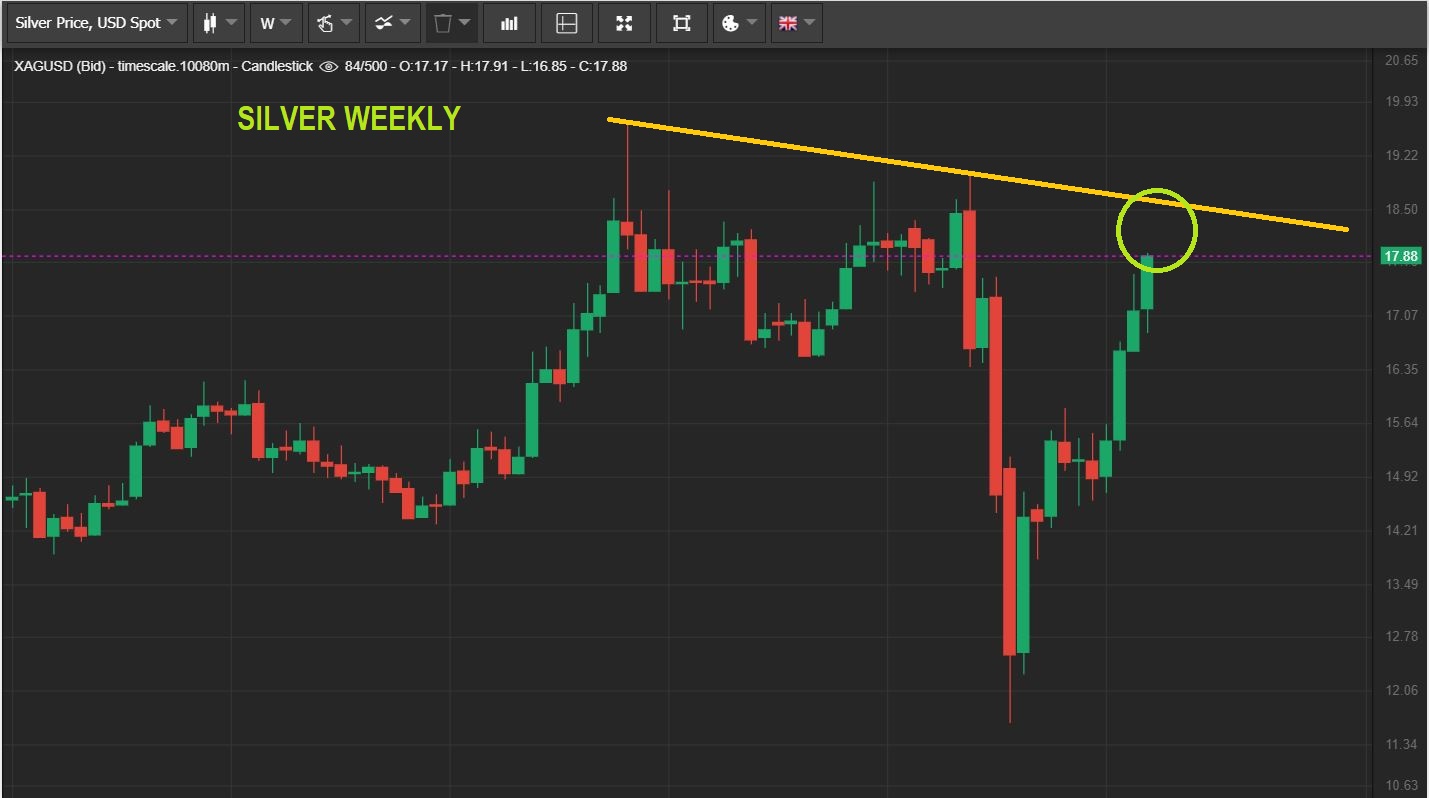
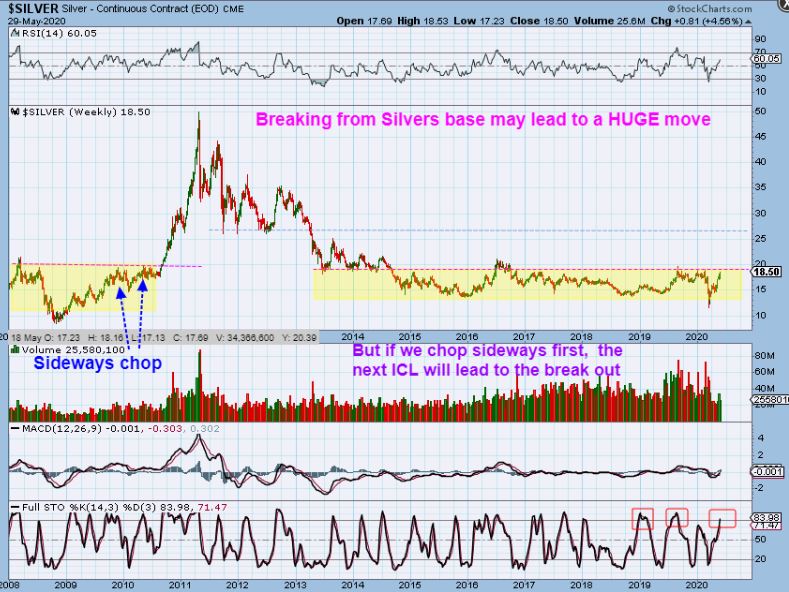
SILVER – The weekly chart has been rather relentless as the 2nd leg higher surges up to a resistance area near $19.
.
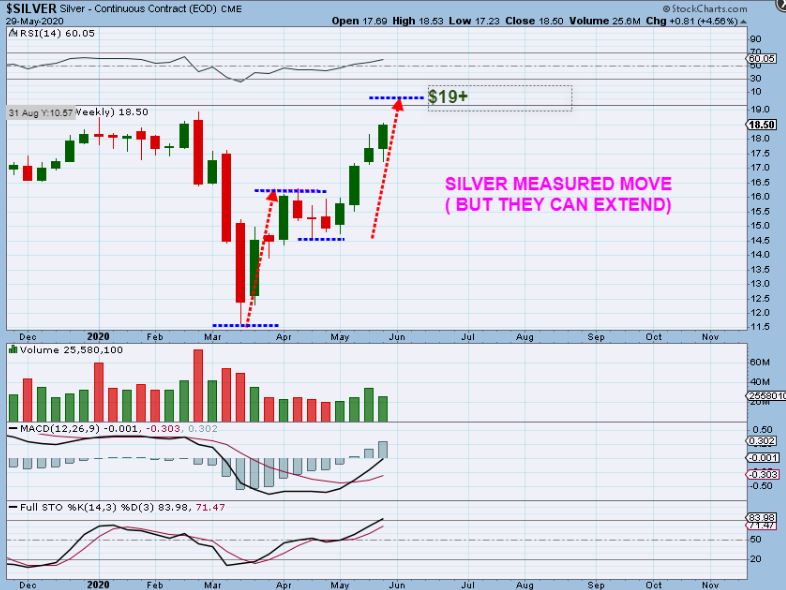
I have been saying that I expect Silver to get to the $19+ area. We have now had 4 straight green weeks for Silver, and many of us have been riding USLV since the $40 area all of this time. USLV is almost at $80.
.
That $19-$20 area is the top of a multi-year base. When SILVER breaks out from here, it should really gain some traction. Read the chart for my thoughts.
,
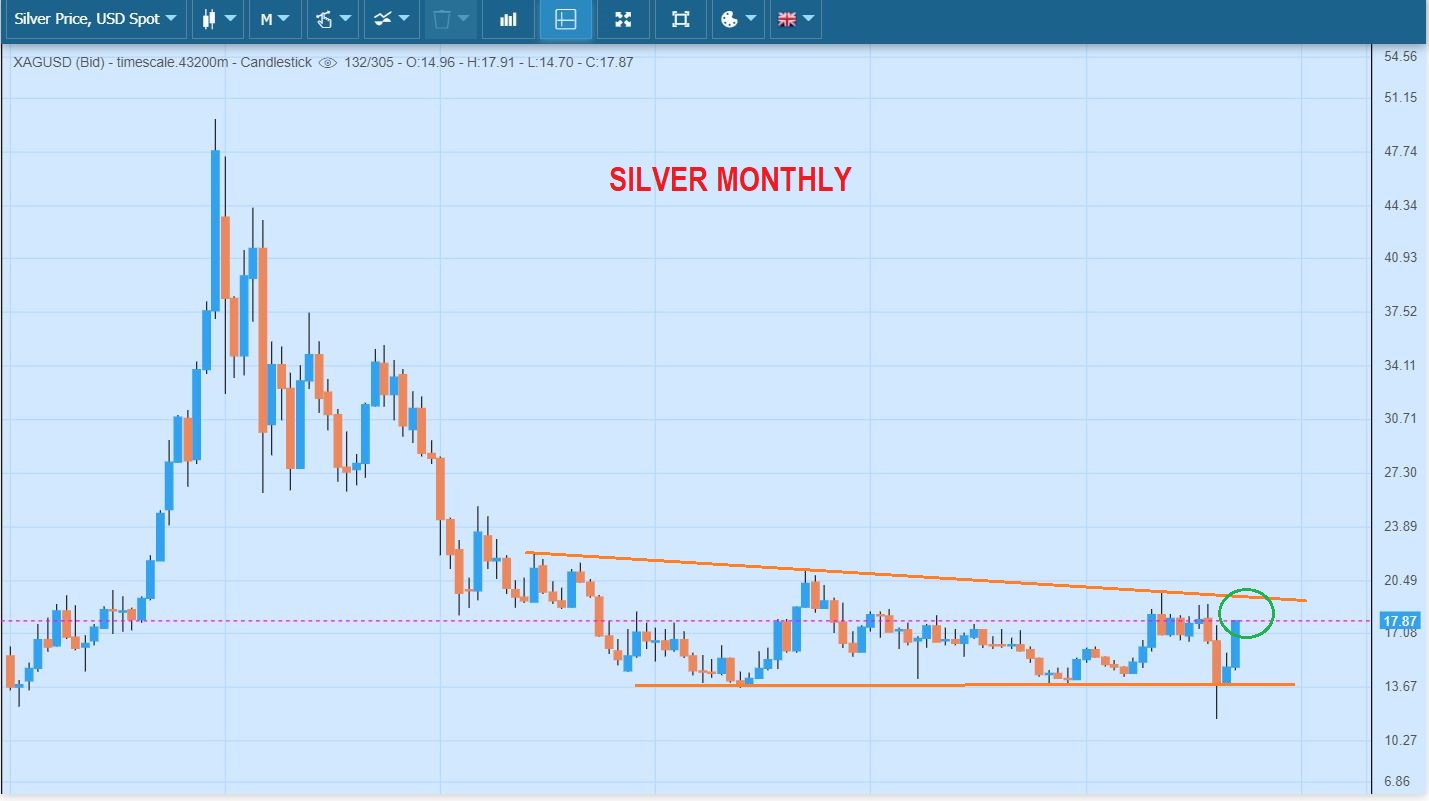
SILVER MONTHLY – The chart is very bullish, but taking it step by step means that we still view that $19-$20 area as possible resistance, and price might pause there.
,
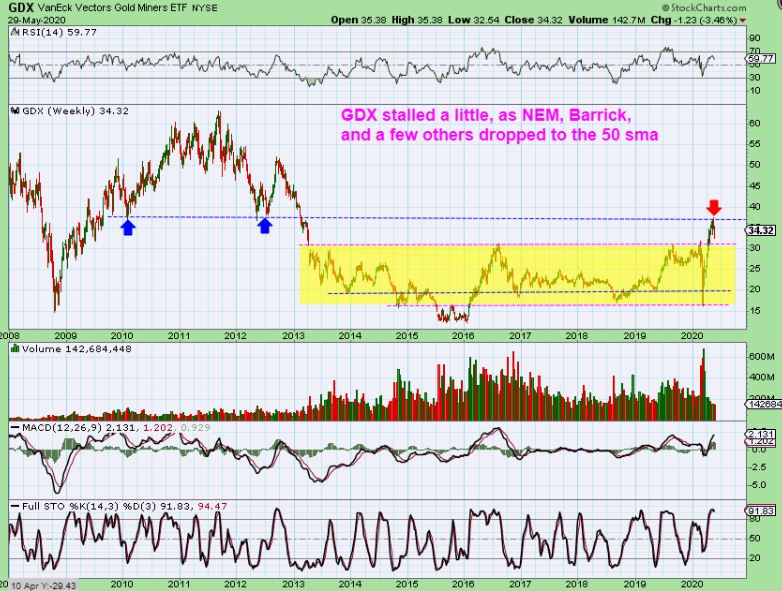
GDX broke out from the Miners multi-year base and ran to the next resistance area, where it has paused and pulled back.
.
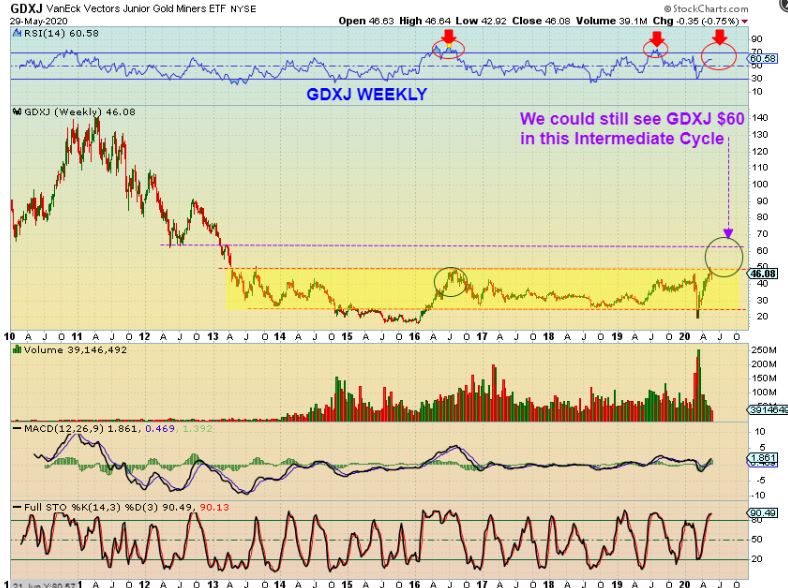
GDXJ – The Juniors have been on fire too, and now they have reached the upper edge of their multi-year base. A run to $60 is not out of the question, because the weekly RSI is only at 60. In a BULL RUN, the intermediate cycles usually top with a strong RSI number above 70.
.
We had another great week of trading and there is a good chance that Gold and Silver will continue higher next week, since they just broke out of consolidations.
.
Enjoy your weekend and thanks for being here at Chartfreak with me!
.
~ALEX
.
ANATOMY OF TRADE IN PRECIOUS METALS:
.
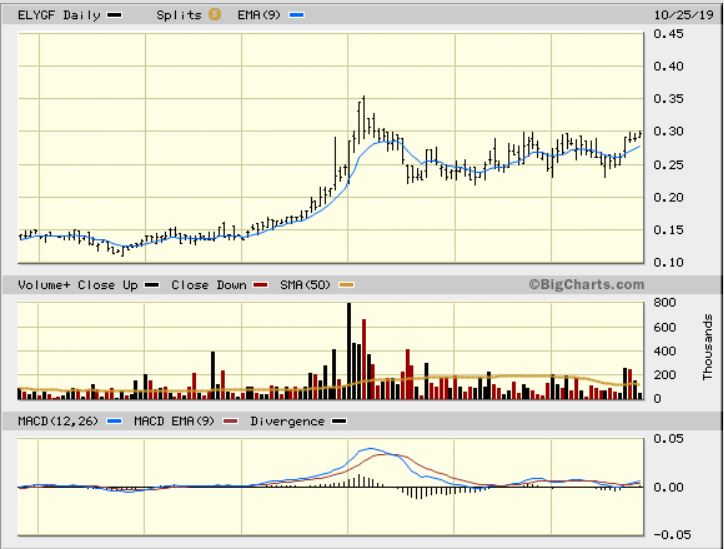
ELYGF -If you have been here for the past year, you may recall ELYGF. I loved the long 10-15 cents base and it then ran higher in 2019 summer rally. I used this chart to encourage accumulation in the 25-30 cent area.
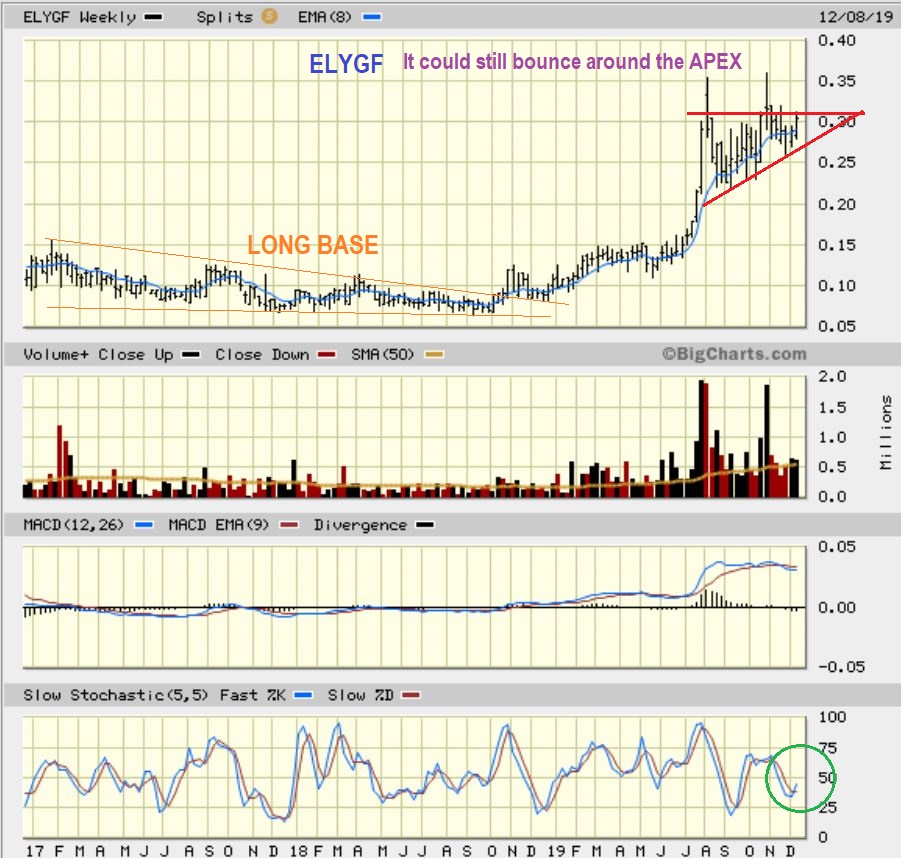
ELYGF This Bullish Wedge pattern on the weekly was forming too
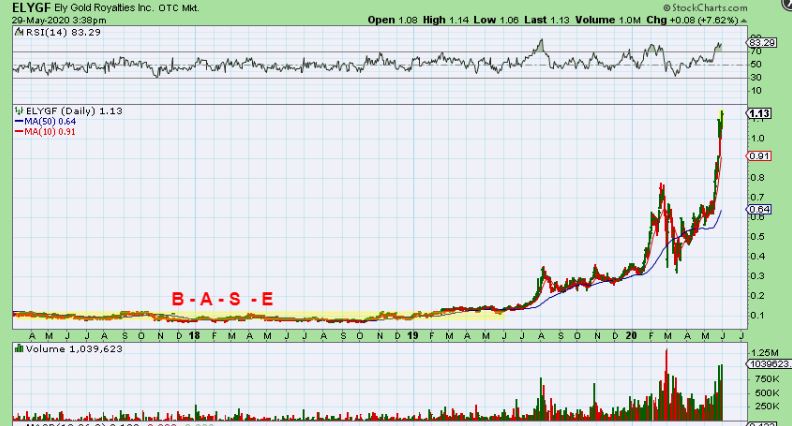
ELYGF jump forward to today and ELYGF hit $1.14 this week. Was it an easy ride for those that did a BUY & HOLD purchase? Not if you look at price movement in Feb, March, and April, but this chart shows a 10 cent company run to $1.14 in just 1 year. I just wanted to point out again that the sideways chop and consolidation can be very bullish in a bull run. This Also shows that some of these Juniors are going to run 500%, or 700%, or 1000+% .
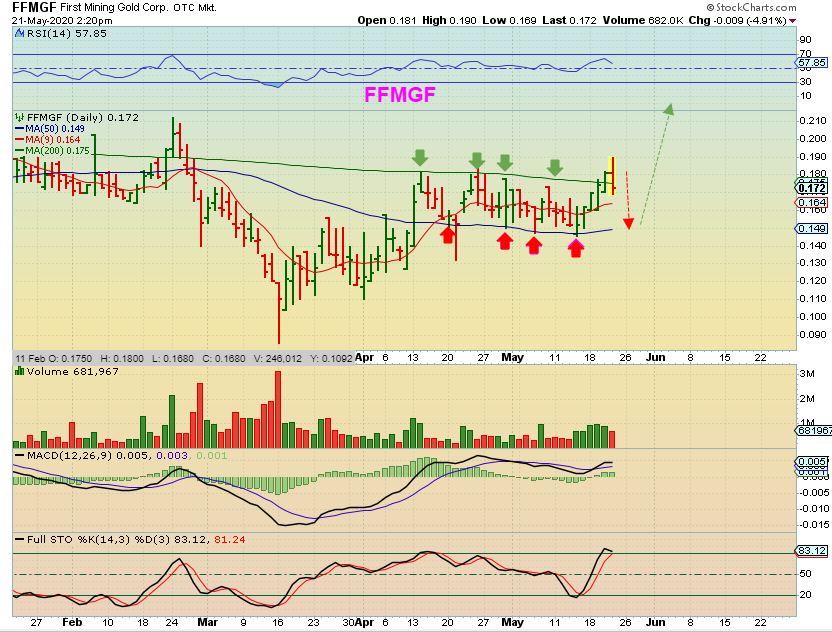
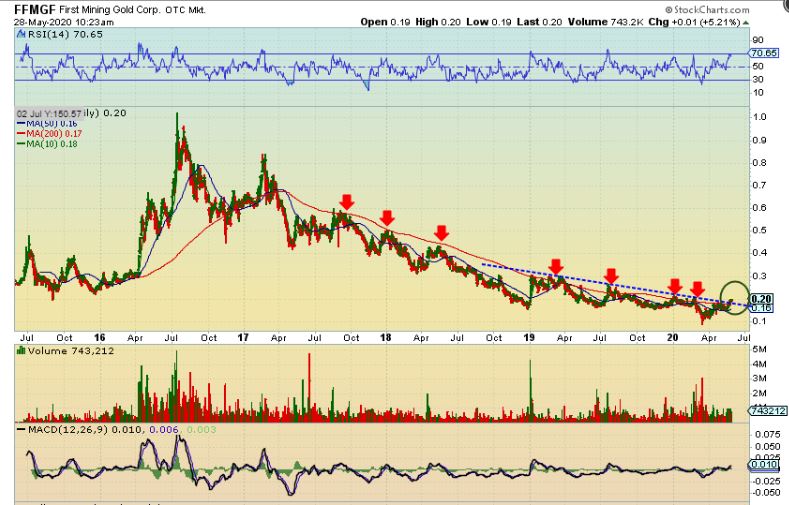
So I have been pointing out FFMGF as one that I have accumulated. Here it was bouncing from 14 cents to 17 Cents, and a break higher was looking like a real possibility. That was good because…
.
FFMGF Breaking that down trend and 200 week ma in a bull market could lead to a nice upside rally. FFMGF is now 20 cents and did break above that 200 ma at 17 cents. A run to prior highs could be $1 over time.
.
3 STOCKS BY REQUEST: After posting Uranium charts of UUU, URA, CCJ, DNN, NXE, etc, I was asked to look at the next 3 charts too.
.
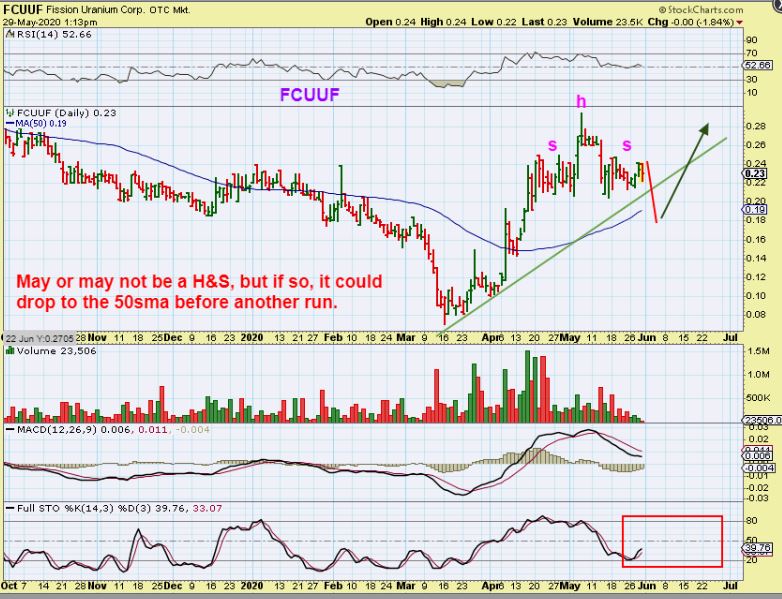
FCUUF URANIUM – I see this as a possible H&S after a great run, so it is possible that this could continue to dip down tot he 50sma area, then it can be reviewed to see if it is reversing as a buy. If it just breaks higher from here, above the shoulders, that also could be a buy. (Cautionary note: This has Extremely light volume at times).
.
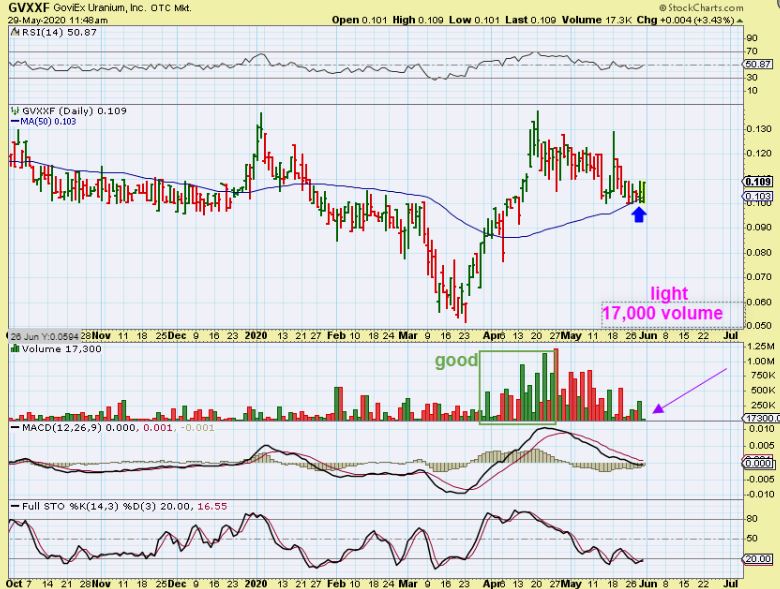
GVXXF URANIUM – Reversing on the 50sma is bullish and it is oversold, so this could be a buy . It also has Very Light volume at times.
.
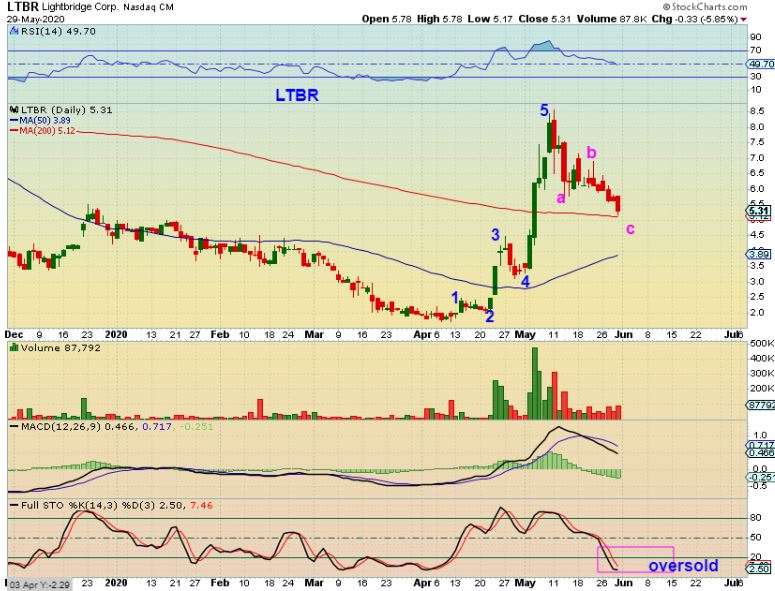
LTBR could also be a buy at the 200 sma, since it is oversold, a stop gives low risk / higher reward, and a 1-2-3-4-5, a-b-c seems to be complete.
.
ZM – I had recommended ZM near the 50sma in the past, but this has NOT been an easy ride. That said, it has doubled since February. We are at the highs now, so it could break out. ZM benefits from the video conferencing that it offers during time of ‘stay at home’ recommendations & ‘quarantine’.
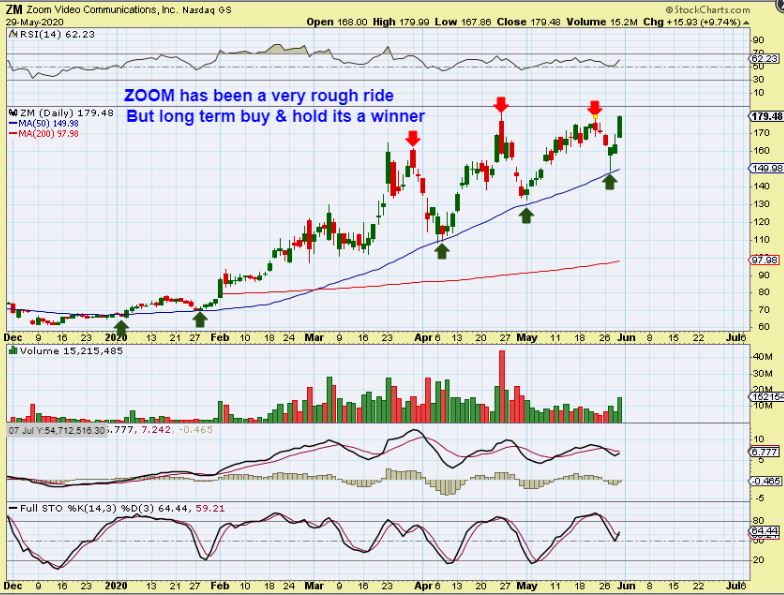
,
ZM honestly looks like it will be north of $200 on this run, but the weekly chart looks due for a pull back, so it may only be a short trade idea.
.
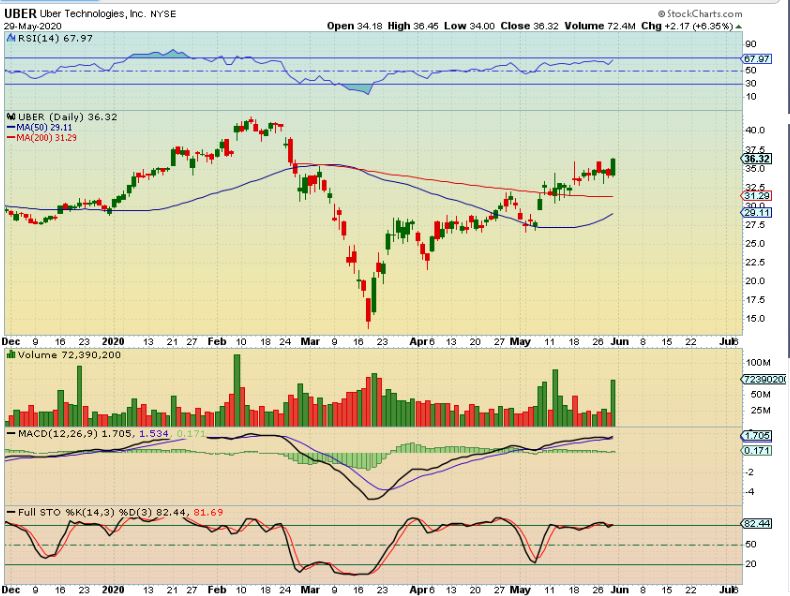
UBER – Stocks that may benefit from the current conditions are still climbing. Uber is a nice option when compared to public buses or crowded Subway / Rail services. It had a nice high volume pop Friday and could be heading to recent highs. From there it could break out.
.

