
May 23 Weekend Report – Slowly Morphing
I decided on this Theme Title, because over time things do gradually change. It is the little changes that can gradually change the Bigger Picture, and our weekend reports are usually focused on the Bigger Picture. This week I took note of a few small changes that could affect the short term outlook, but it didn’t really change the Bigger Picture . Let’s go to the charts…
.
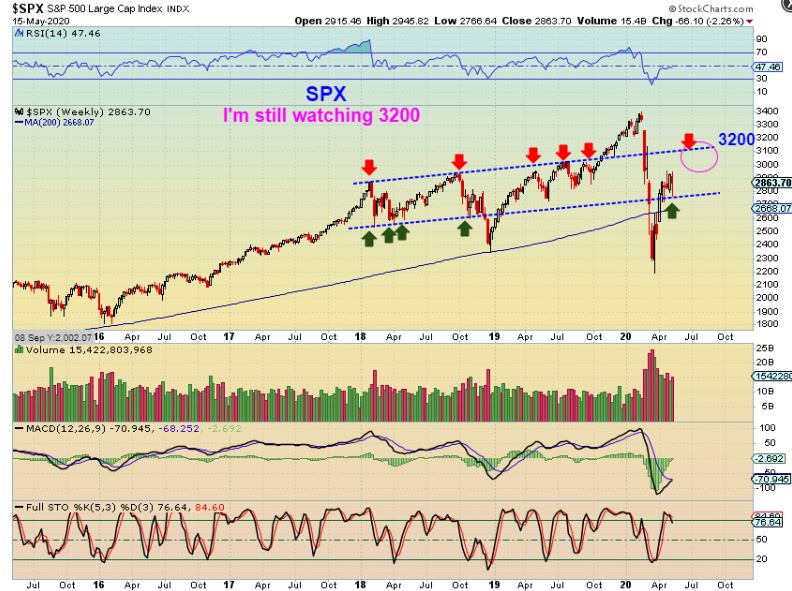
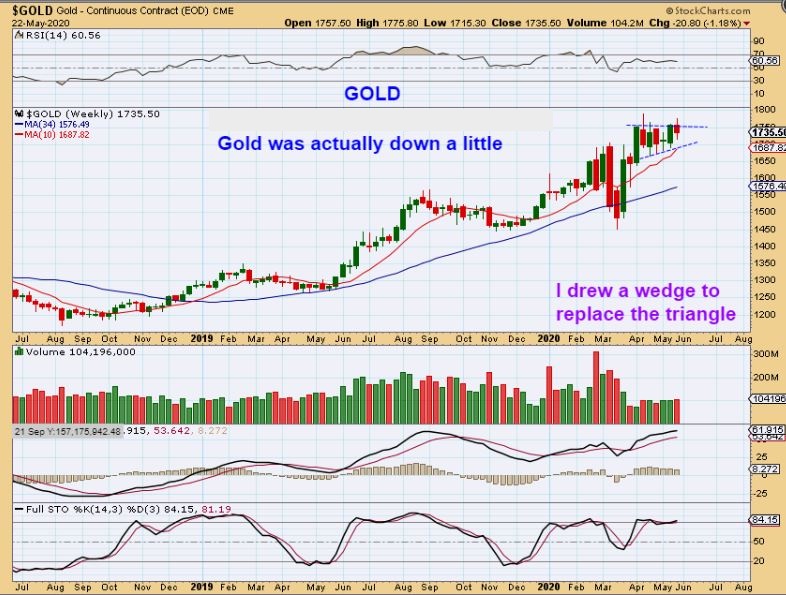
SPX WEEKLY LAST WEEKEND: I was looking at the SPX as possibly getting to that 3200 area. We saw our first daily cycle out of the ICL run almost straight up and then chop into a dcl.
.
SPX WEEKLY – The SPX stalled at the 3000 resistance area, but it is only day 6 of the second daily cycle and I still expect this to break above 3000 and push higher.
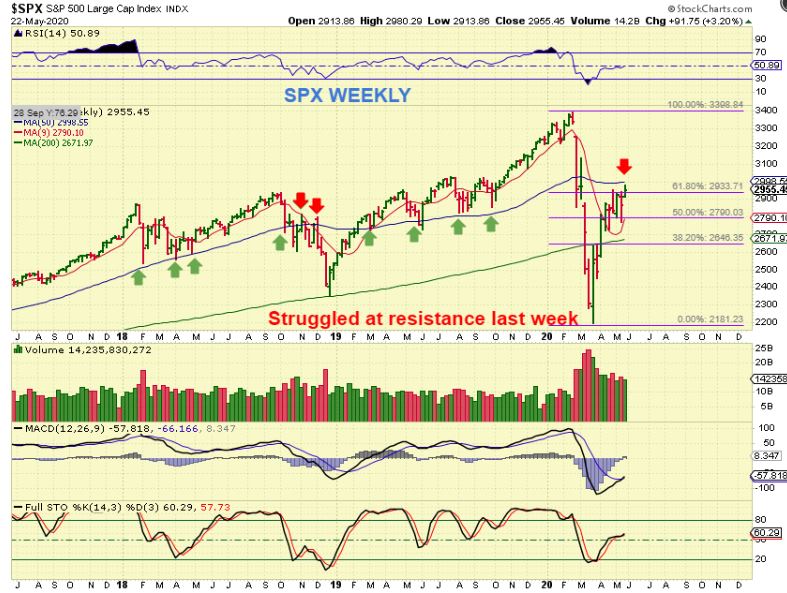
NOTE: IF THE GENERAL MARKETS ROLLED OVER BEFORE DAY 15 OR SO, IT WOULD BECOME L.T. (a Left Translated daily cycle) AND THAT WOULD BE BEARISH, BUT SO FAR THE SET UP IS FINE EARLY IN THIS 2nd DAILY CYCLE.
.
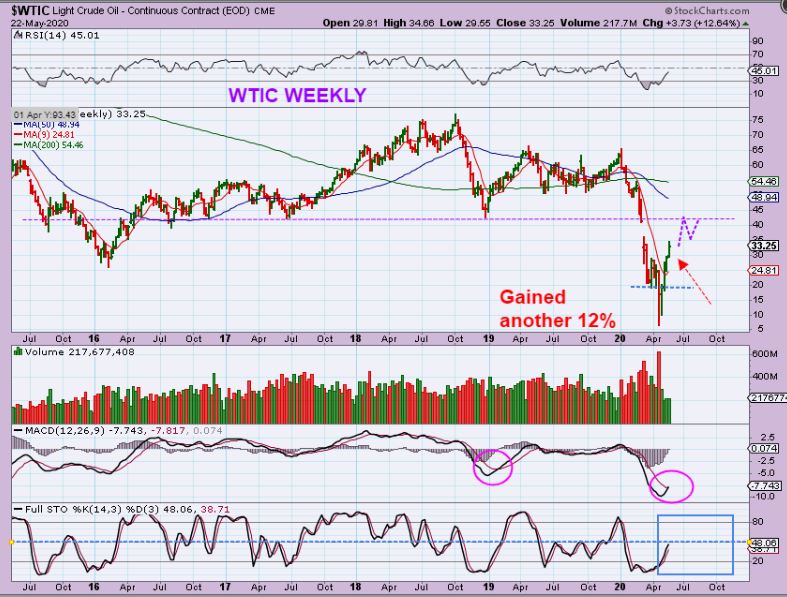
WTIC WEEKLY – Oil moved another 12% higher. It is still in the first daily cycle out of an ICL. We may tag that resistance area before pulling back into a dcl. Oil is moving ‘as expected’ .
.
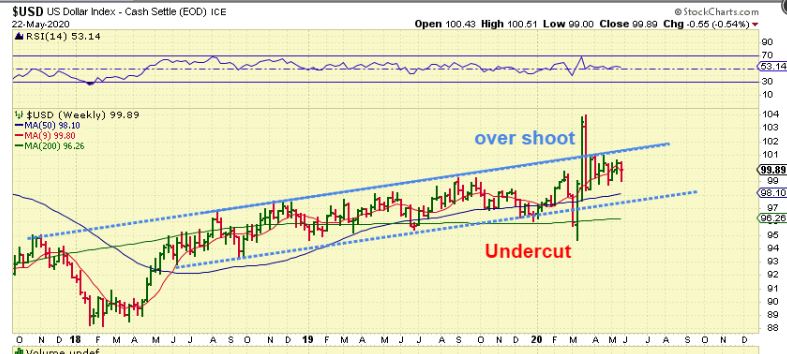
USD – The USD is in a channel and has been choppy, but it doesn’t seem to affect Gold as strongly as it has in the past.
.
PRECIOUS METALS – small changes
.
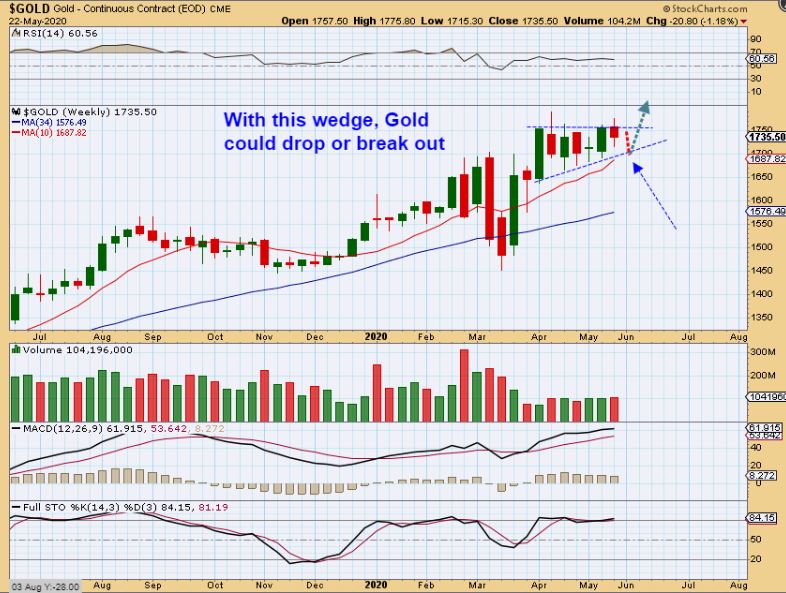
GOLD WEEKLY – GOD DROPPED 1.18% LAST WEEK. Since Gold broke from a small triangle, but did not see a strong follow through higher, so it may be starting to form a bullish flat top wedge here. This view would give Gold the possibility of dropping to the lower blue trend line on the wedge & 10 weekly ma next week, or breaking higher. So basically, Gold is still chopping sideways. Lets zoom in…
.
GOLD close up : Next week would be a drop or pop, as explained above.
.
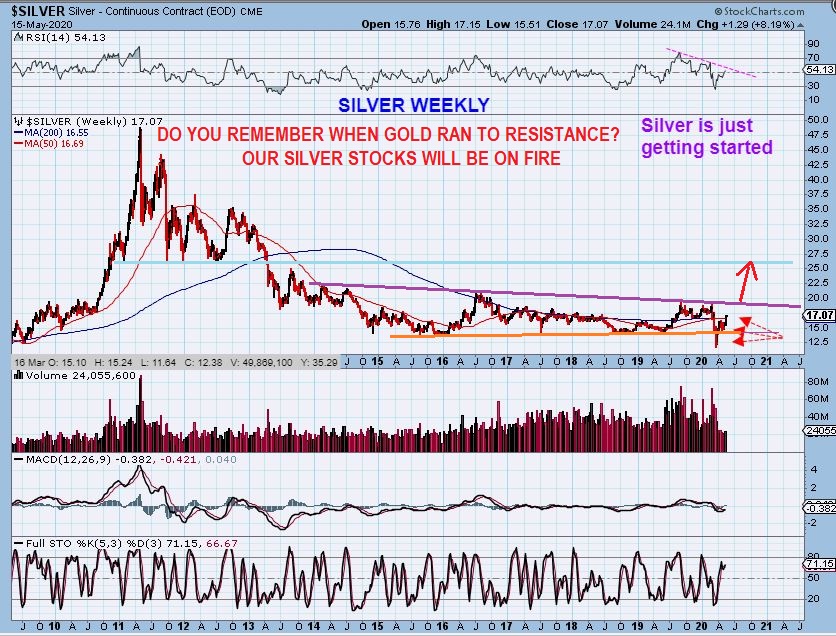
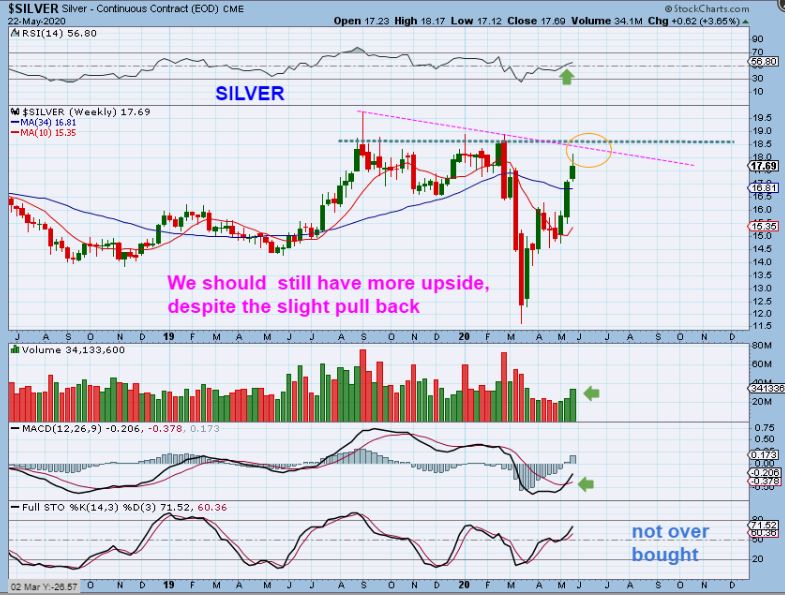
SILVER BIG PICTURE FROM LAST WEEK – We broke above the 200 week ma…
.
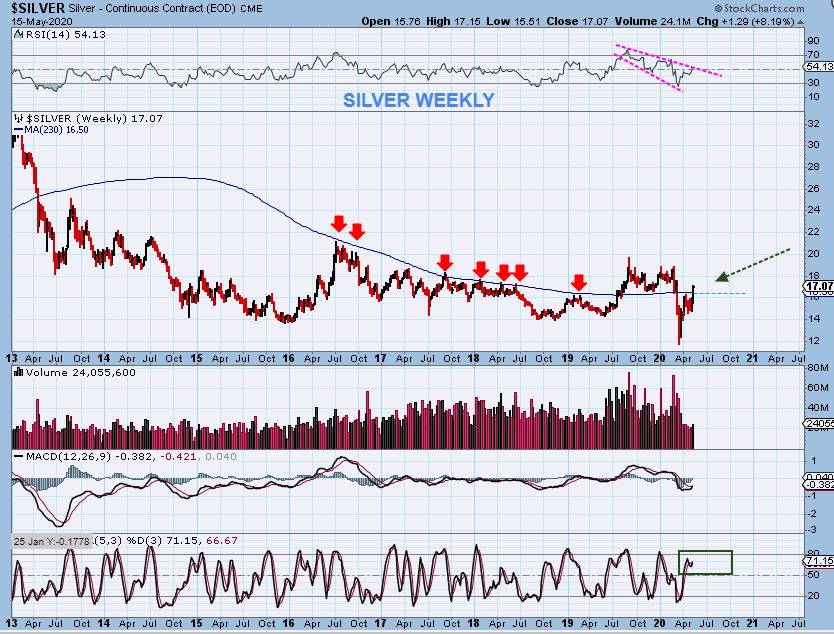
SILVER ZOOMED IN & CLOSE UP
.
SILVER was up another 3.55% for the week, while Gold was down, but it did sell off a bit at the end of the week. That looks like a possible topping candle, but when I see Silver moving 3.5% higher with increasing volume, that’s bullish and I still feel that this should get to overhead resistance.
,
SO GOLD DROPPED ( -1.18%),
SILVER GAINED (+3.55%), AND
MINERS POPPED & DROPPED (-2.79%).
.
GDX WEEKLY – A reversal candle shows up on the weekly chart. You see why I chose that morphing theme? Gold was down 1.18% last week, Silver was up 3.5% , and GDX was down 3% with a reversal candle. The week before last was a Strong green candle, so does this reversal now mean that we just drop from here? …
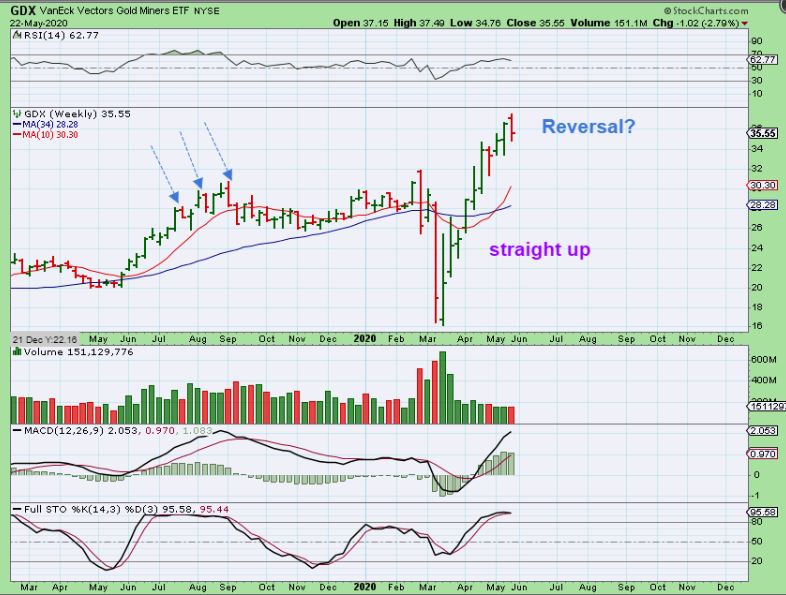
Same chart: When I look at the left side of the chart. I see similar reversals where we had 2 weesk up, 1 week down, 2 weeks up, the following week down, etc. as it chopped higher to the real top. That may happen here too, but we just have to wait and see.
.
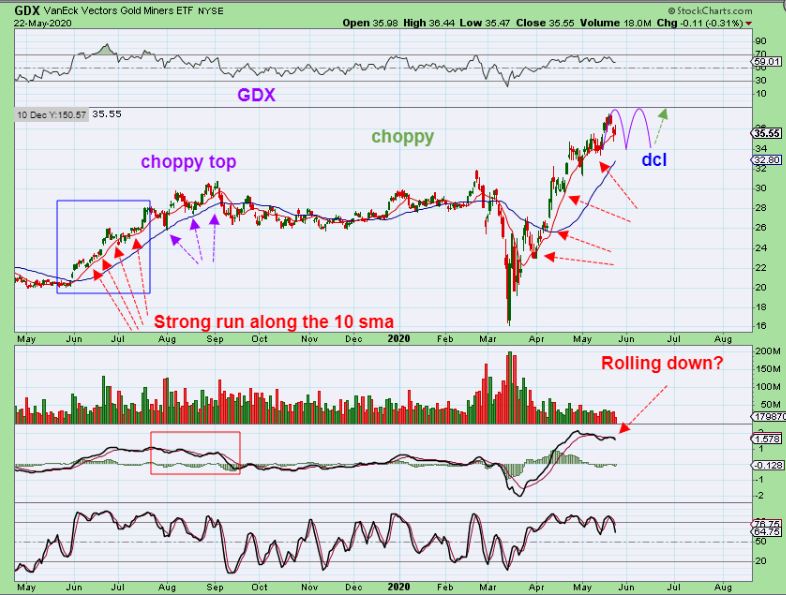
GDX DAILY VIEW – So last May-September, it was a strong run out of the lows that turned into a choppy top. We could see that as the 2nd daily cycle ages.
.
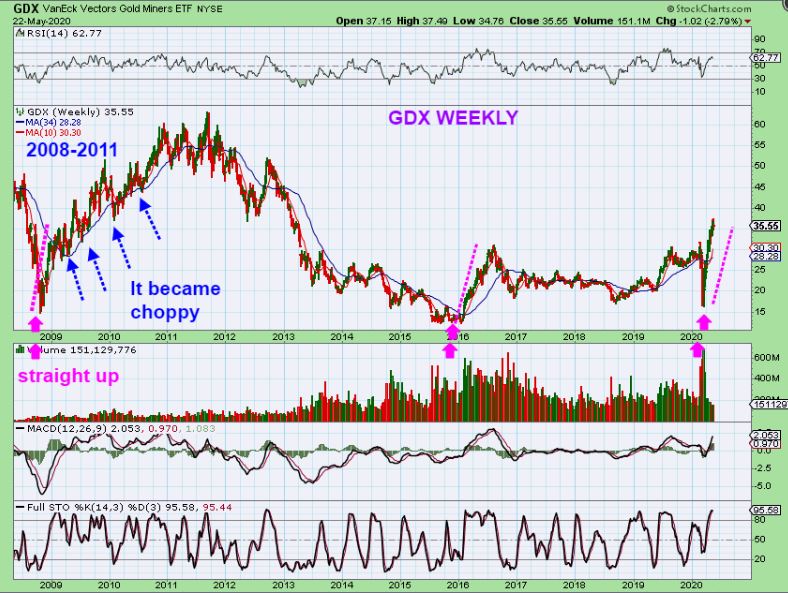
GDX WEEKLY BIG PICTURE – On this chart I just wanted to point out that out of the 2008 bear market lows, GDX shot straight up at first, then it got choppy, but it still became a bull market for years. It was just a lot choppier with all of the daily cycles and ICLs over time. In 2016, it was rather straight up too, and then rolled over. Right now, we have seen a similar straight up run out of the ICL. We are waiting to see how this unfolds, but it remains bullish at this time.
.
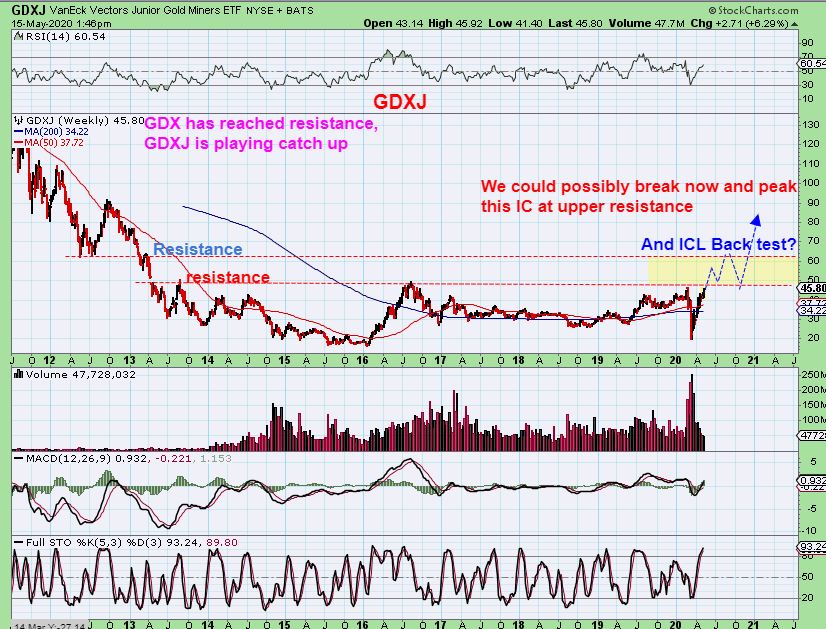
LAST WEEKENDs GDXJ MAY 15 – I drew a Red Resistance line over to the $50 area. I drew this showing that we could eventually break above it and back test.
.
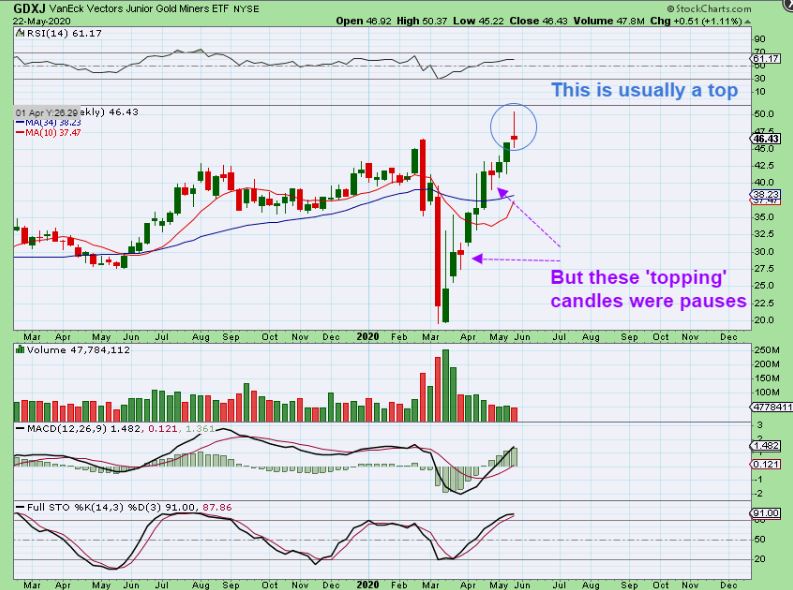
GDXJ WEEKLY – We hit that $50 area and pulled back last week. This ‘tiny’ change gives us a weekly topping candle at the $50 resistance. It may ‘stall’ & chop sideways . This doesn’t change the Bullish Big Picture View, but it was a change that I had to take note of as the charts continue to morph. Let’s look at the daily chart…
.
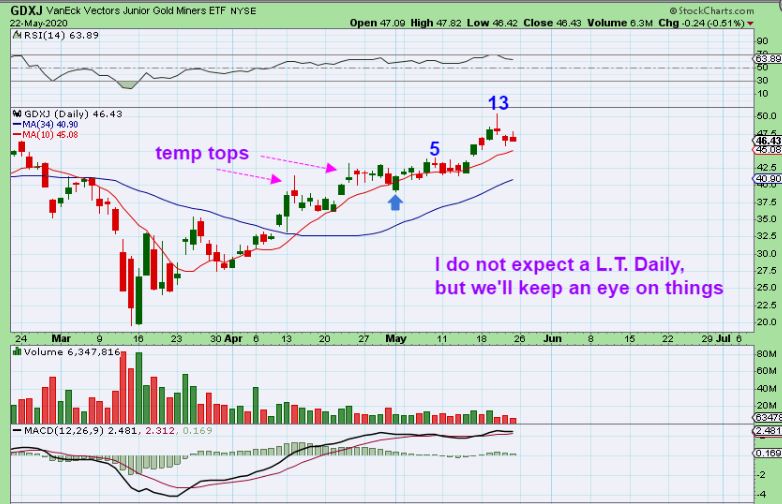
GDXJ Daily – Breaking it down, the daily chart also had a short term topping candle Wednesday, and we felt the drop on Thursday. I just want to point out that we also saw this in the first daily cycle as shown with Magenta arrows. At that time, price continued higher after a week of choppiness. Next week may be choppy.
.
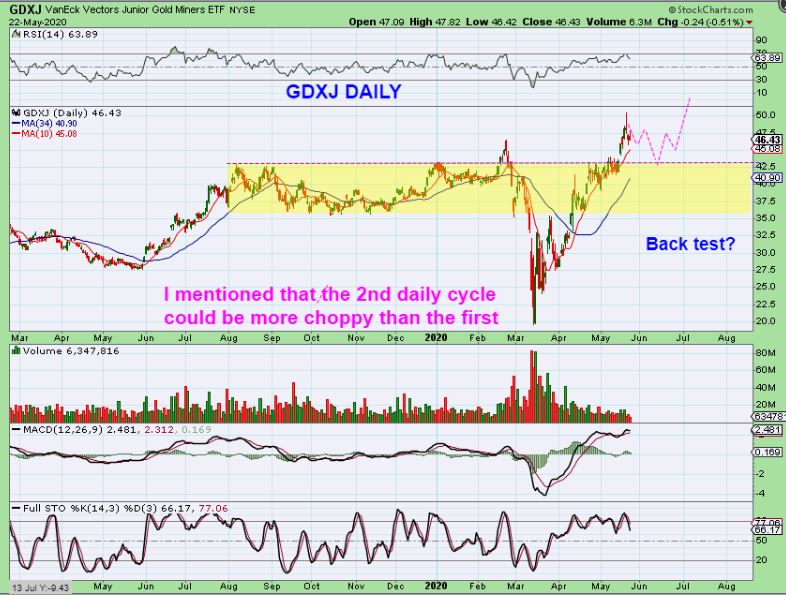
GDXJ Daily. This seems less likely, but a bigger chop & drop could give us a dip into an early and short daily cycle that back tests a recent break out. Then the 3rd daily cycle would continue pushing price higher.
.
GDXJ WEEKLY – So back to last weeks Big Picture Bullish Chart. Any choppiness going forward would not change the big picture, but it may be paving the way for price to break through the resistance area.
So as you can see, the Big Picture remains Bullish with a few minor changes at the resistance areas. That may cause some choppiness next week, but in recent times, that choppiness was just a pause in the upward action. We’ll just have to see how this plays out.
.
Enjoy the rest of your weekend, and in the U.S. we have a 3 day weekend, so we’ll see you on Tuesday Mornings Trading.
.
~ALEX
.
JUST A REMINDER WORTH REPEATING – The daily chart already had short term topping candles in the first daily cycle as shown with Magenta arrows. At that time, price continued higher after a week of choppiness. Next week may be choppy.

