May 9th Weekend Report
I found a few interesting things in the charts this weekend, so let’s get right into the report…
,
SPX – I have expected the SPX to top its first daily cycle here ( 61.8 Fib), or maybe after a tag of the 200sma. It is getting late, but these daily cycles can run for 40 or so days, so I don’t think we saw a dcl on day 29.
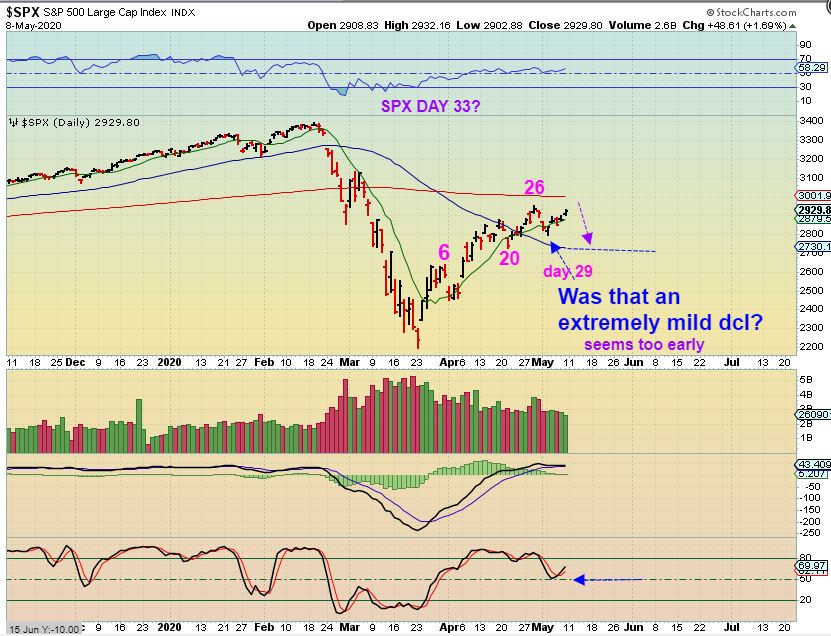
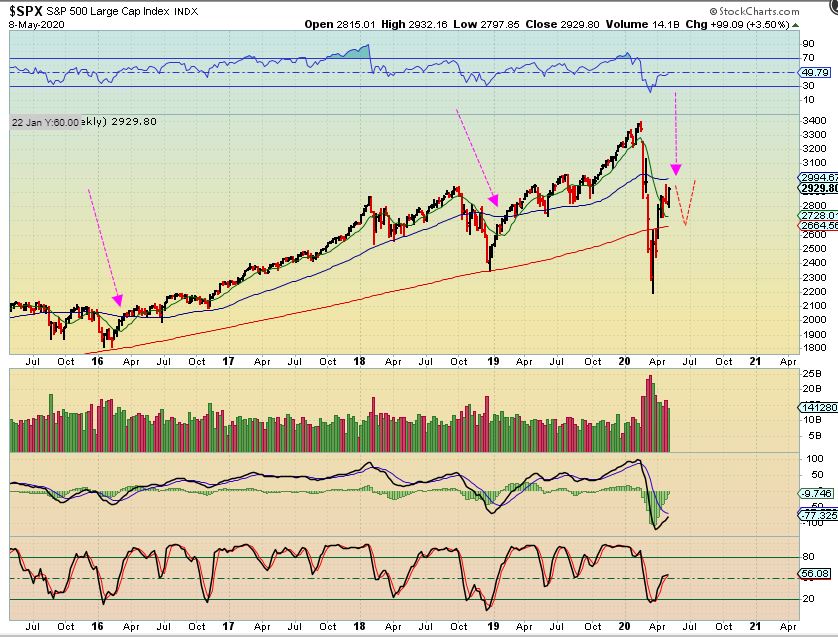
SPX – I found it interesting that we have almost recovered the 50 week MA on the first daily cycle. I honestly thought that we would get there in the first 2 daily cycles. Let me show you what else I’m finding interesting...
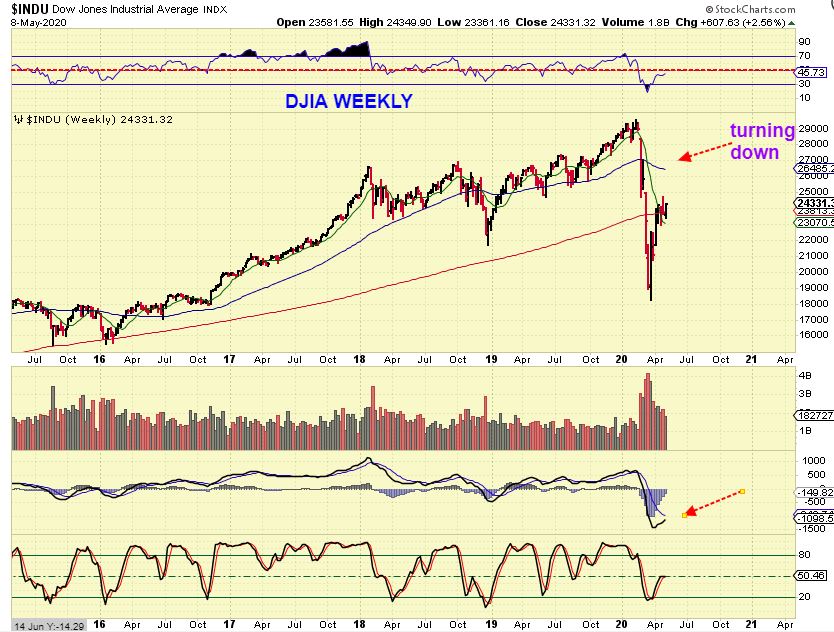
DJIA – The DOW is lagging, just now starting to recover from that break of the 200 week ma, however…
;
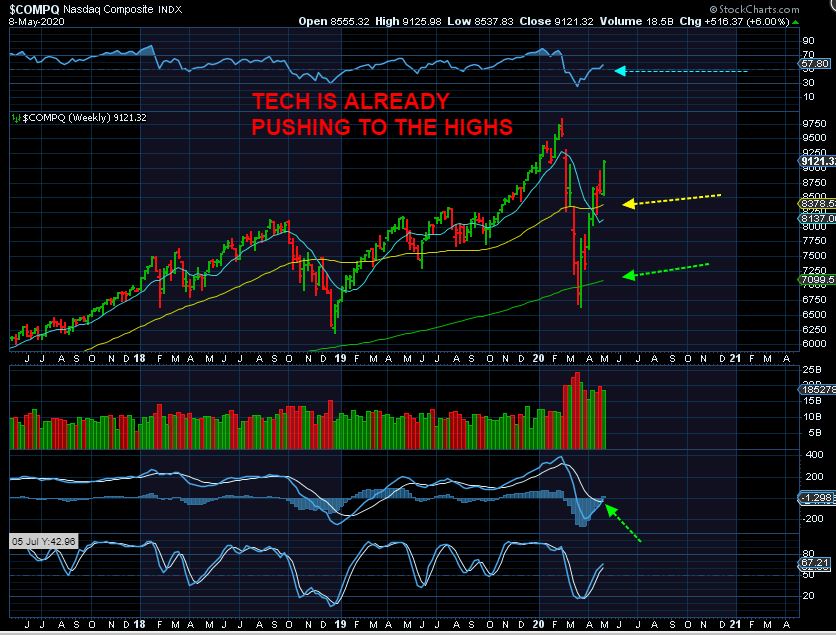
With this weeks rally, The NASDAQ has swiftly regained a lot of ground. In fact, it not only recovered that 50 week ma, but it is nearing the 2020 highs. So Tech has recovered better than the SPX & The DOW, and this is something that I’ll be keeping my eyes on as the second daily cycle unfolds.
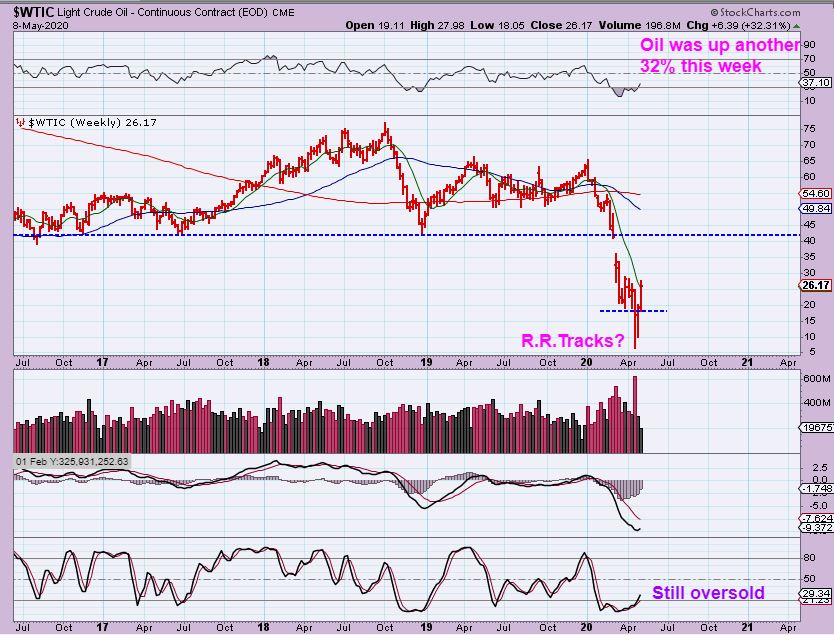
WTIC has bounced as expected, I mentioned that this was probably an ICL, and now I see that this could be a final low in place with a set up very close to R.R. Tracks. Oil stocks have done exceptionally well off of the lows ( many doubling & even tripling).
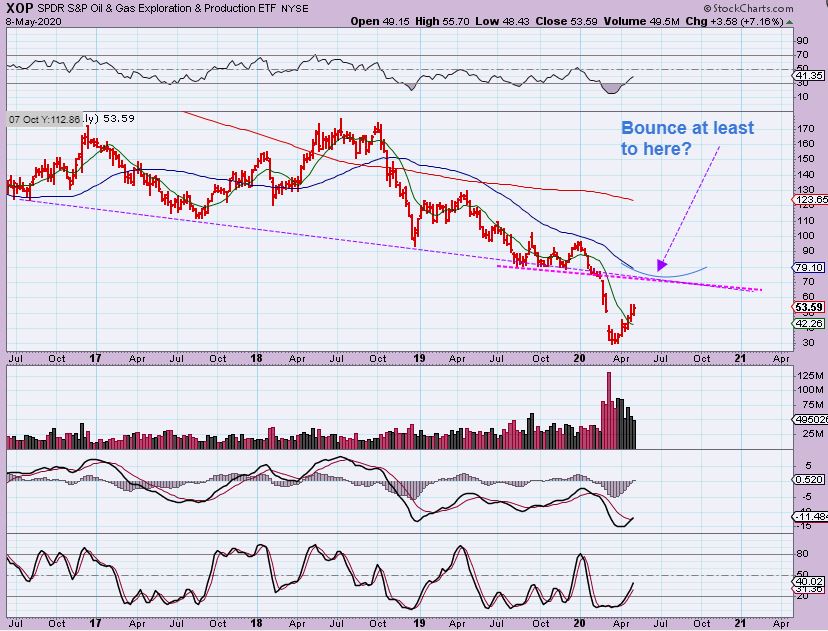
XOP – I’m expecting the bounce out of the lows to continue, we’ll just have to wait and monitor how good it looks as it moves higher. We have traded many energy stocks like OKE, APA, CLB, BE, PUMP, TUSK, WTI, CVI, OAS, PVAC, DNR, etc.
.
We have really been focusing on the Precious Metals recently, because a dcl has come due in this sector. Since the First daily cycle was exceptionally strong coming out of an extreme sell off, the 2nd daily cycle is of interest to us. Will it bee equally as strong, or might it chop sideways? I have a few charts below to explain the things that I am seeing here..
.
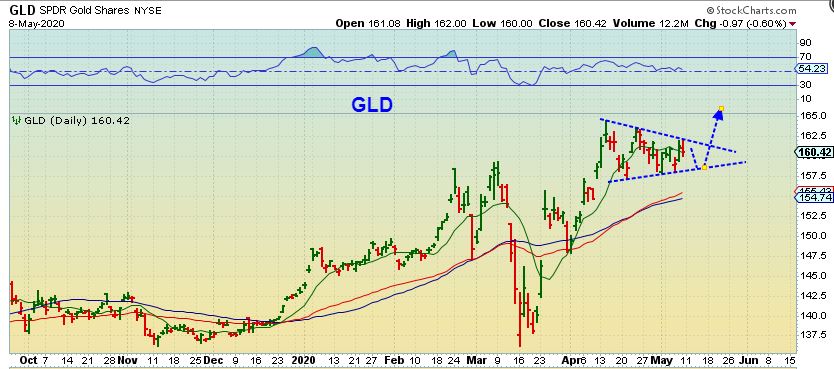
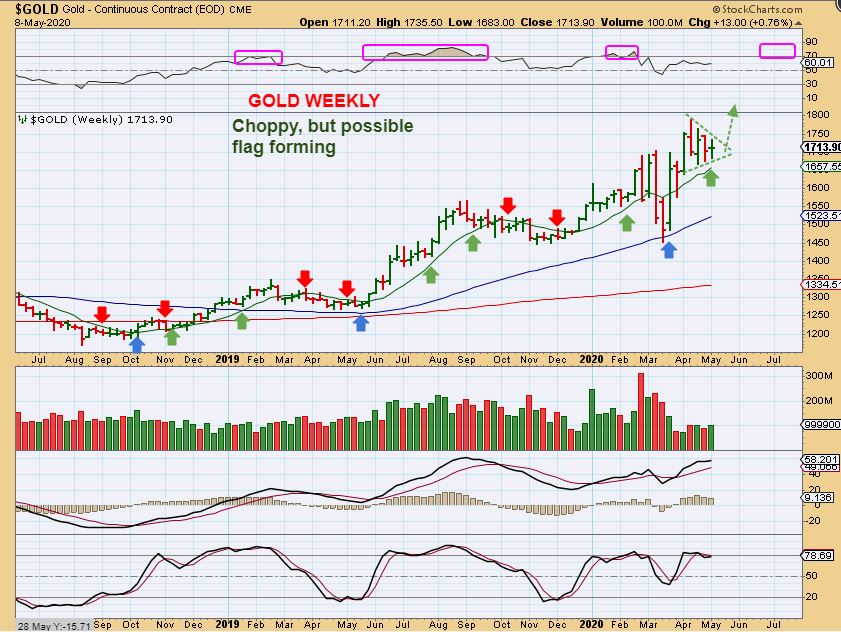
GOLD (GLD) is choppy, but this sure looks like a bull flag , and time is running out for it to break out. This should lead to a move higher.
GOLD Weekly also looks like a triangle or flag.
,
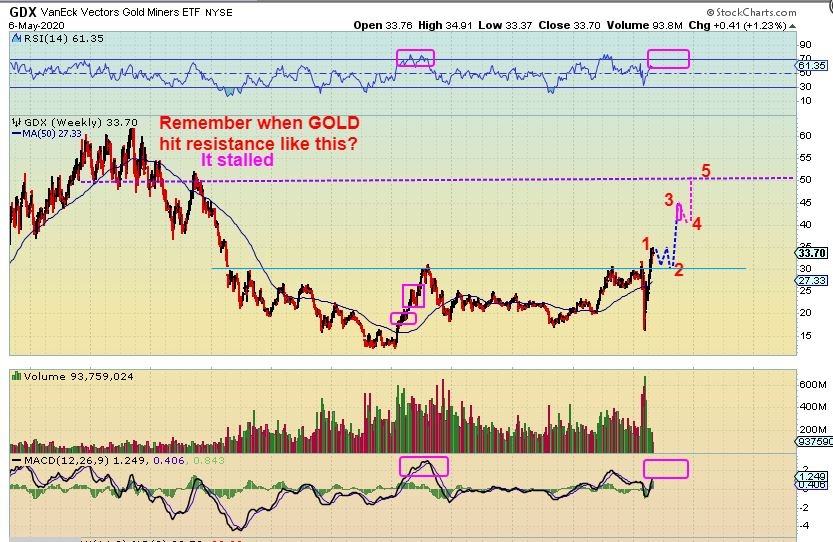
GOLD WEEKLY – In Dec & Jan I was pointing to that $1550 area out as the bottom of resistance where we could stall ( Pink shaded area). We did stall and dipped into an ICL and then started breaking into that area.
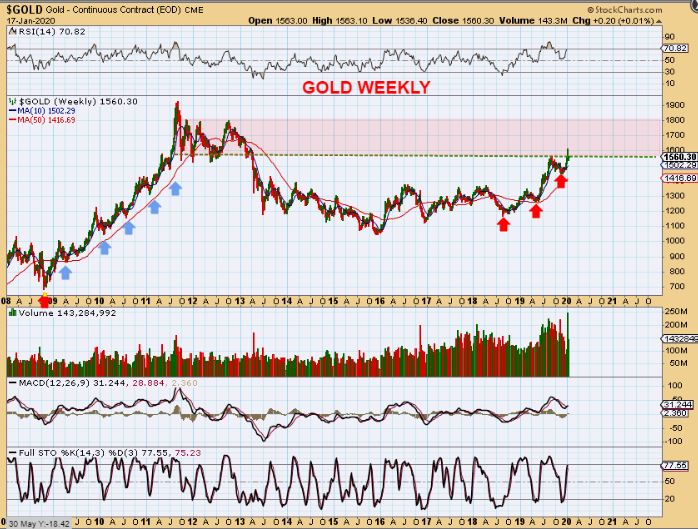
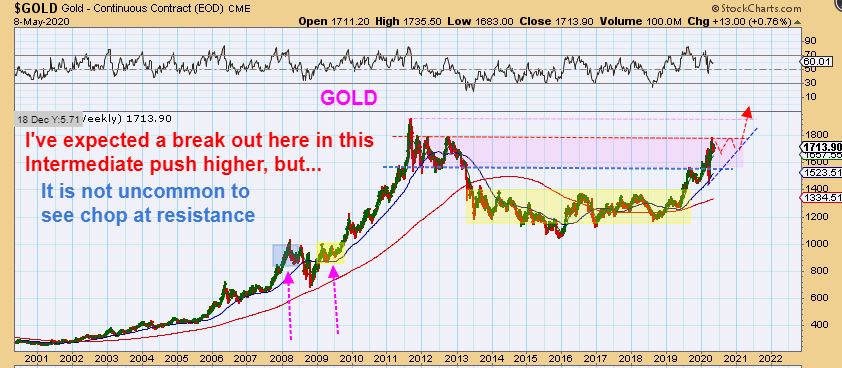
GOLD WEEKLY – We are now at the top of that range, and the flag / triangle could be the result of that upper resistance line too. A break from here can run to prior highs in the $1900 area. One idea that I thought of, but hope is less likely, is that…
,
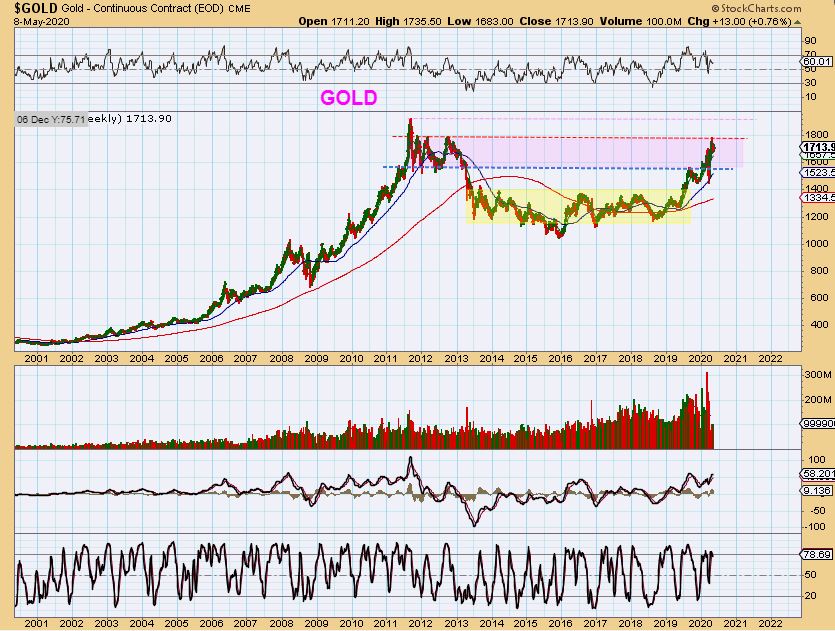
GOLD – One idea that I don’t like is that in 2008 we v-bottomed and then chopped sideways at the prior highs resistance area ( see the blue & yellow shaded areas). Chopping sideways here , like we did in that yellow area is not out of the question. In fact…
,
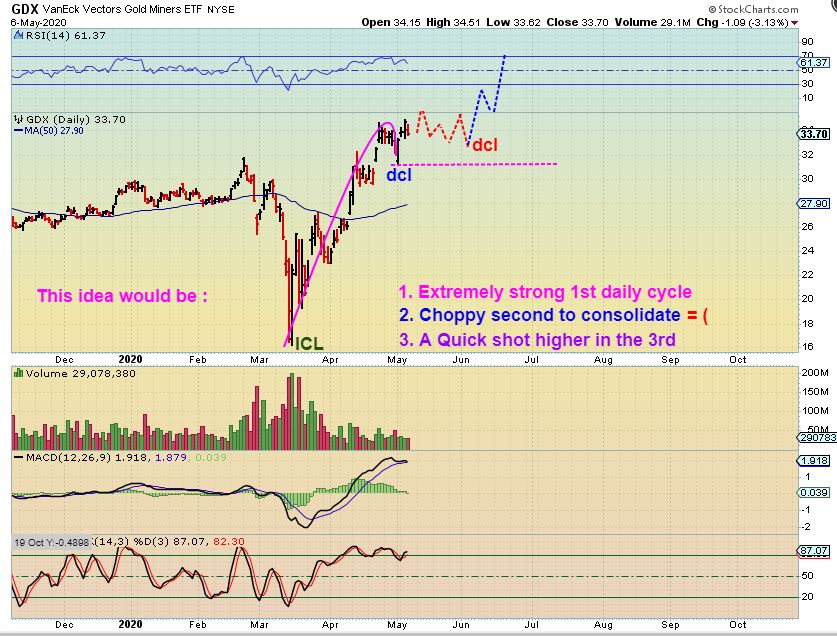
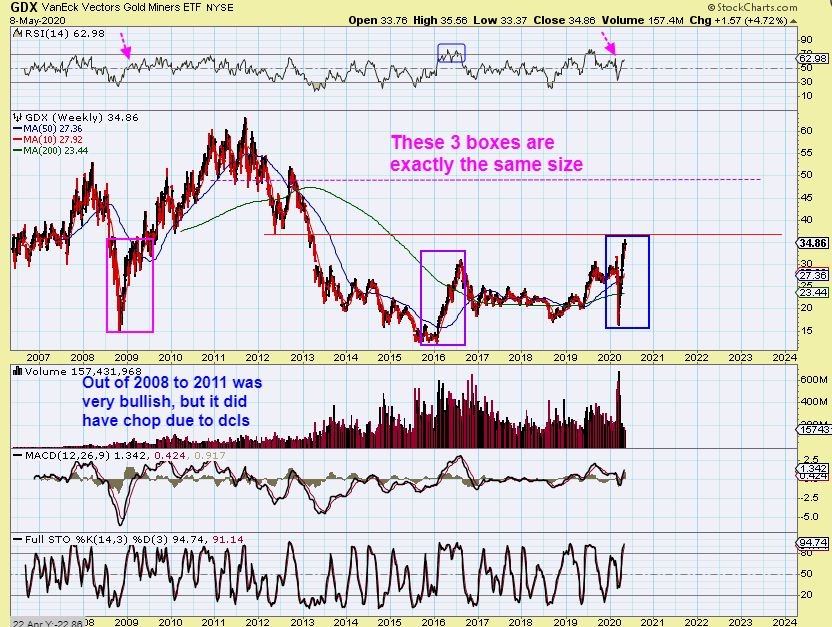
You may recall me using this chart last week to say that GDX could get choppy in the second daily cycle to consolidate gains from the first run up. Run, Chop, Run. We’ll have to wait and see, but I want to keep this in mind if we don’t just keep ramping higher. It doesn’t mean ‘something is wrong’, it just needs to consolidate.
,
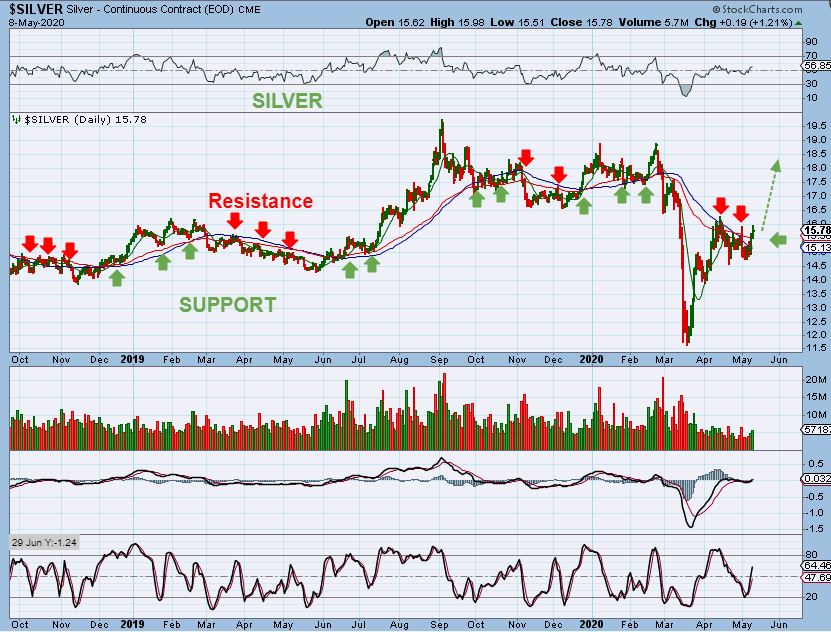
SILVER has been crawling along under the 50sma & broke out higher. This is most often bullish action. Add to that that we were heading into a 2nd daily cycle, and that is even more bullish price action. This can run to $19.50 and hopefully our Silver stocks play catch up to some of the Gold stocks like NEM, GOLD, NG, KGC, etc.
,
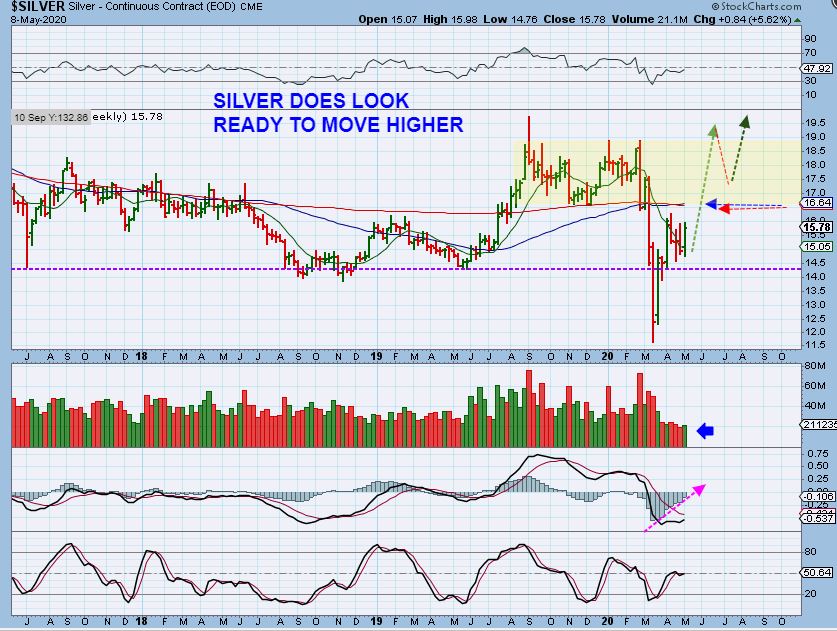
SILVER WEEKLY – There is overhead resistance in those moving averages, but I would think that this should be able to break through after this consolidation.
THIS NEXT CHART REFLECTS A NEW IDEA, SIMPLY BECAUSE I NOTICED A FEW THINGS WHEN LOOKING BACK AT PAST BULL MOVES. IT IS JUST ANOTHER POSSIBILITY, SO IT MAY PLAY OUT EVEN MORE BULLISHLY THAN THIS PORTRAYS.
,
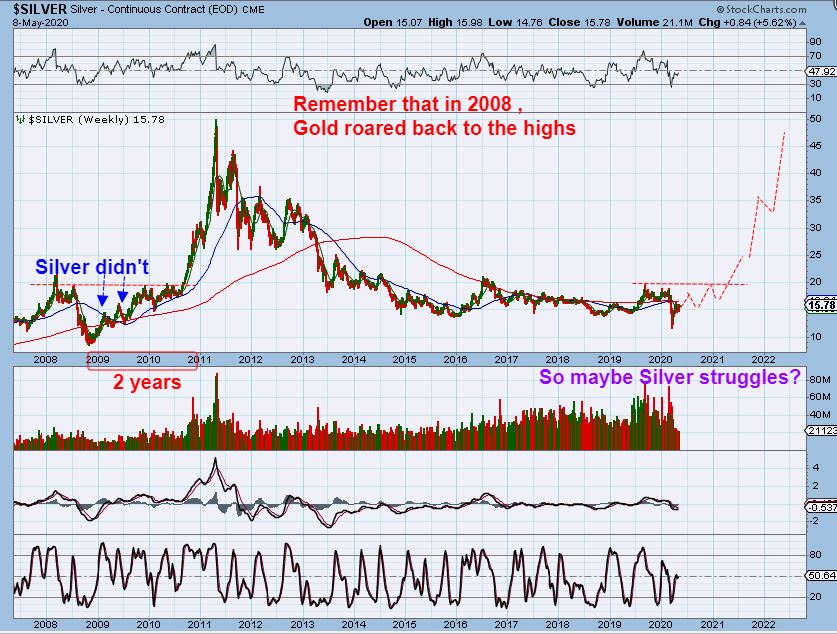
Look at Silver 2008 & Silver Now– I looked back at 2008 and after that slam down in Silver, the recovery looked a lot like today. That was choppy sideways. Then I realized another important similarity…
1. In 2008 GOLD ran right back to the recent highs. In 2020 Gold ran back to the recent highs too.
2. In 2008, Silver lagged & Chopped around the red 50 week line closer to the lows, and in 2020 it is doing that again.
3. So looking back at 2008, Silver gradually chopped up to prior highs and then went sideways. A long V or inverse H&S formed. If we do that now, it reaches that $20 area that I mentioned above as $19.50. Unfortunately, in 2008 that took 2 Years, so I am hoping for that run immediately this time! Silver really lagged gold then.
,
GDX -I discussed this as a likely dcl, so I expect us to continue higher.
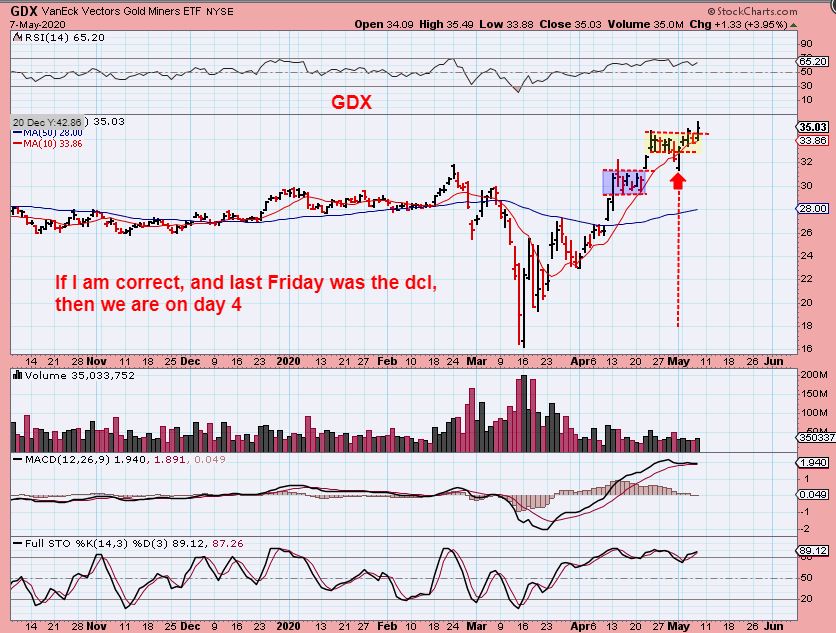
GDX – That was when I also introduced the idea that GDX could pop & just chop around during the second daily cycle and then shoot straight up early in the 3rd daily cycle. I’ll add to this idea that individual stocks seem to be moving higher after breaking out ( not sideways).
,
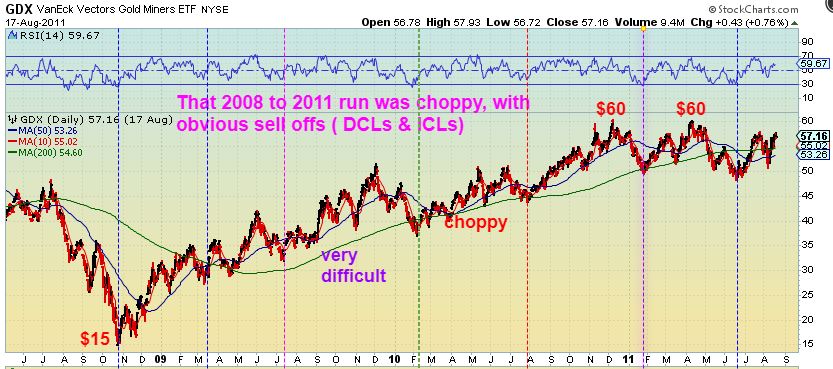
I went back to 2008 for GDX again. $15 to $60 for an ETF is awesome, but how it got there is a tad less awesome 🙂 It was a choppy sideways move at times. Each vertical line is an ICL dip, so in between are the daily cycles. Look how difficult and choppy some of those runs were. Are you mentally prepared to ride the Bull, without letting emotions overwhelm you when we get a multi-day sell off? Let me zoom in…
,
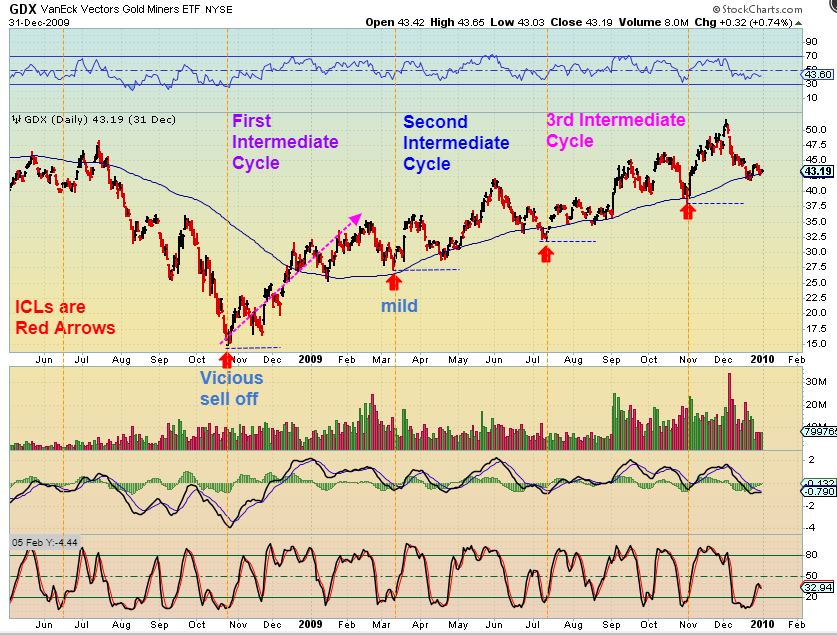
Let me zoom in to the first year out of that deep 2008 ICL.
.
GDX –
The 1st Intermediate cycle chopped higher back then, but so far ours has moved in a steeper incline. Notice that after the 1st, 2nd, 3rd daily cycle, the dip into an ICL was Mild.
The 2nd Intermediate Cycle ramped up, crashed, and then ramped up again, and then kind of crashed. THAT WAS DIFFICULT( And only $27.5 to $32 ICL to ICL).
The 3rd Intermediate Cycle was very choppy at first for 2 months, and then chopped higher. So breaking it down that way, you can see that this was hard to ride, but it still ran $15 to $50+ in the first year.
,
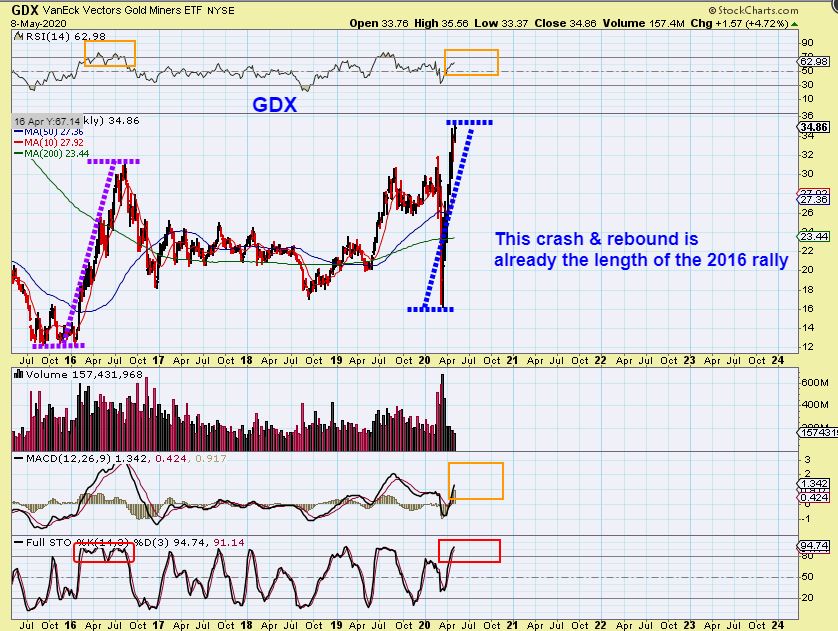
GDX – These 2 lines are actually the same length, so this rally already actually equals that 2016 rally, though individual stocks haven’t done as good as when CDE & AG ran from $3 to $18. The action has been too fast. What about that 2008 rally?…
,
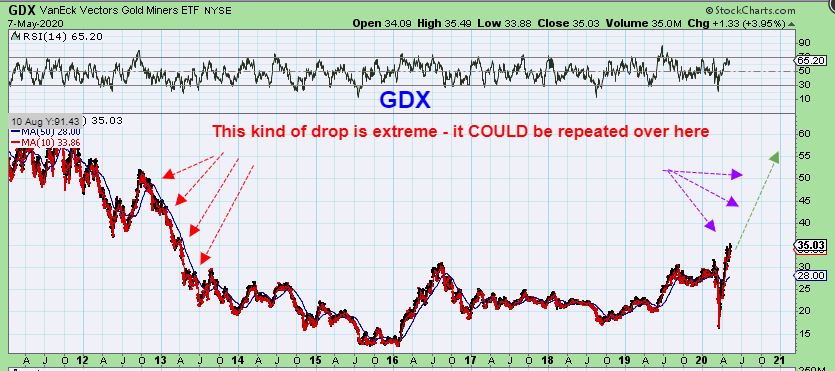
So here we see that choppy 2008 run on the left, and the steeper 2016 run in the middle. I noticed that the start of the 2008 run actually looked steep too, and then it started getting choppy with deeper dcls. Even with all of this review, I still hold out the idea that …
.
Even with all of this review, I still hold out the idea that I put in Fridays report can play out, and that was …
.
Notice how ABX just quickly found buyers that chased it all the way up to the highs. It ran up in the same way that it dropped on the left side. Let’s go back to GDX now…
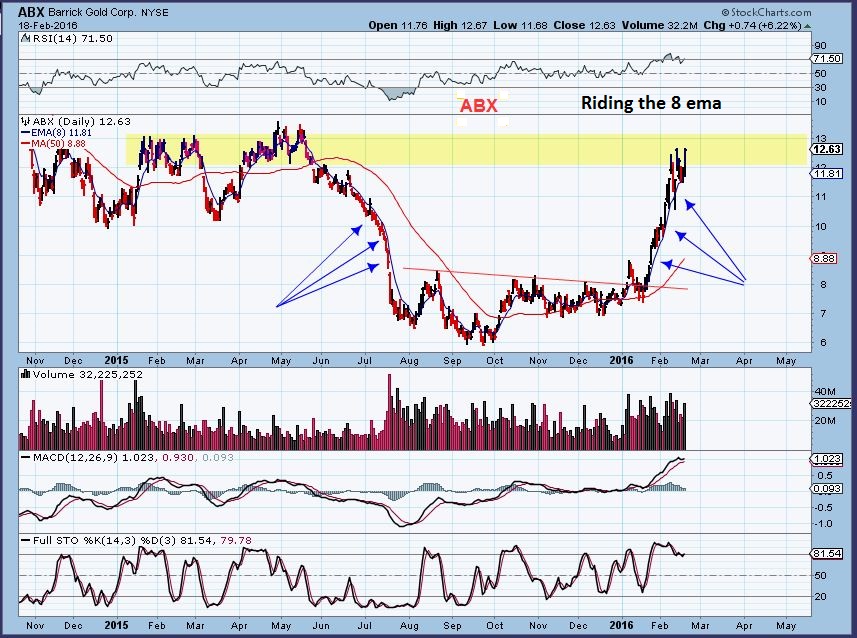
We can hope for something more like what happened there in GDX now. It happens as a point of recognition. Buyers see the Bullish break out and want to get in. THIS COULD RAMP UP RATHER STEADILY TOO . I’m hoping for & expecting that now in this intermediate cycle.
,
And even if we got a 2nd daily cycle of sideways chop, this can still move quickly to the upper resistance if buyers flood in.
.
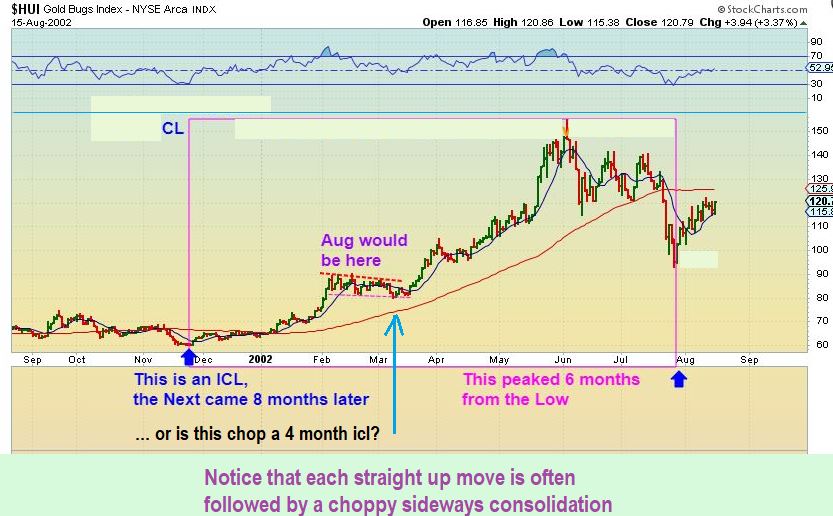
AND FINALLY: Let’s look at the start of the Bull for HUI in 2001-2002 – This is an older chart, ignore the writing on it. All I wanted to show on this chart is that for 6 months, even with sideways chop, the Bull run was a money maker for 6 months. Notice here that…
1. All of Dec was sideways.
2. Feb-March was sideways /slanted down. Yet…
3. After the periods of sideways chop, rallies were strong.
m
So whether we take off higher right now as expected or whether we chop sideways for a while, I still think you want to be in Miners for the 2nd and 3rd daily cycle. After a little chop sideways we could ramp up and rally to the next resistance area, and as I have pointed out in prior reports, individual Miners can rally on their own and carve their own path during sideways chop.
.
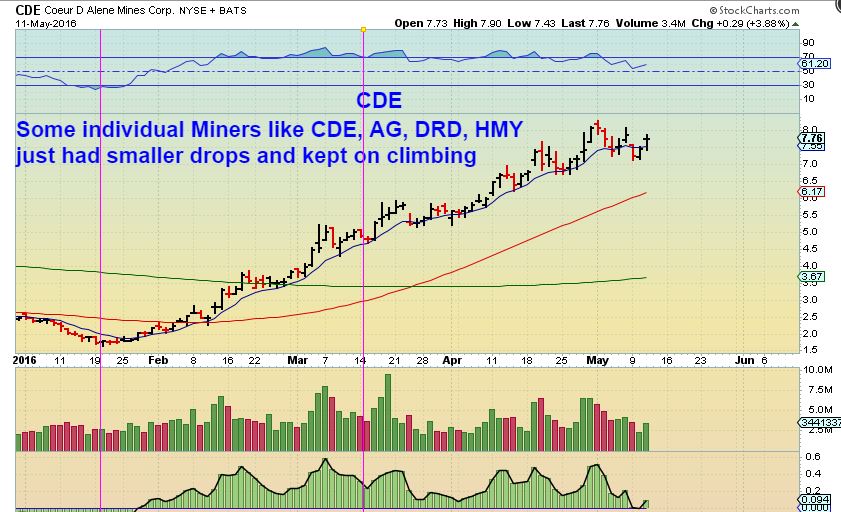
I showed how CDE was an example of a Miner that was strong during that choppy sideways GDX action in 2016. CDE barely broke the 10sma for months, even though GDX & GDXJ ran sideways at times!
.!~
Enjoy your weekend, and thanks for being a Chartfreak with me!
.
~ALEX
.
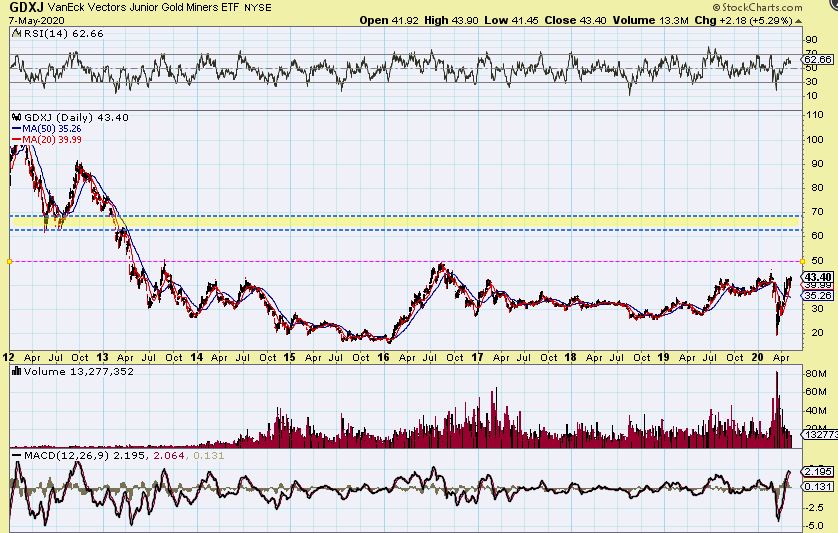
GDXJ Daily Chart – This chart makes me think that GDXJ can run to that 50 area quickly. If it just breaks through that minor resistance area, GDXJ has a target of over $60. This is a MASSIVE 7 YEAR BASE and breaking out of here will really draw the attention of longer term & short term technical traders. 😉