May 2nd – Weekend Report
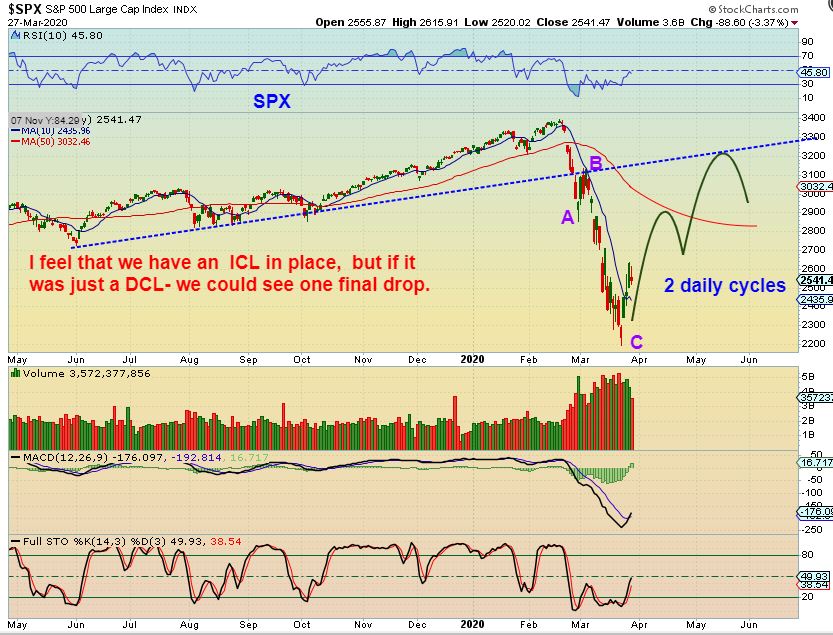
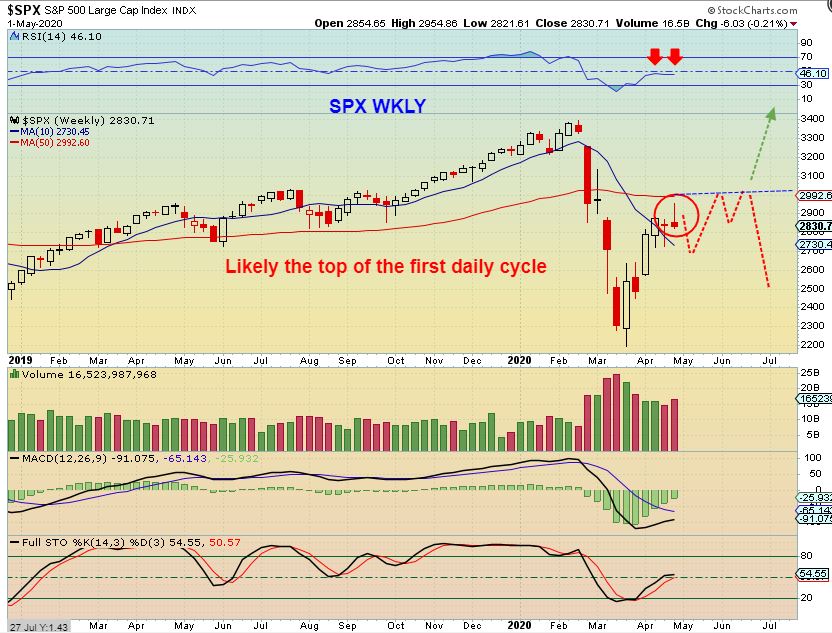
SPX – when the move out of the ICL started, I drew this in March to show that I expected 2 daily cycles higher. It could rise as high as the lower trend line as a back test…
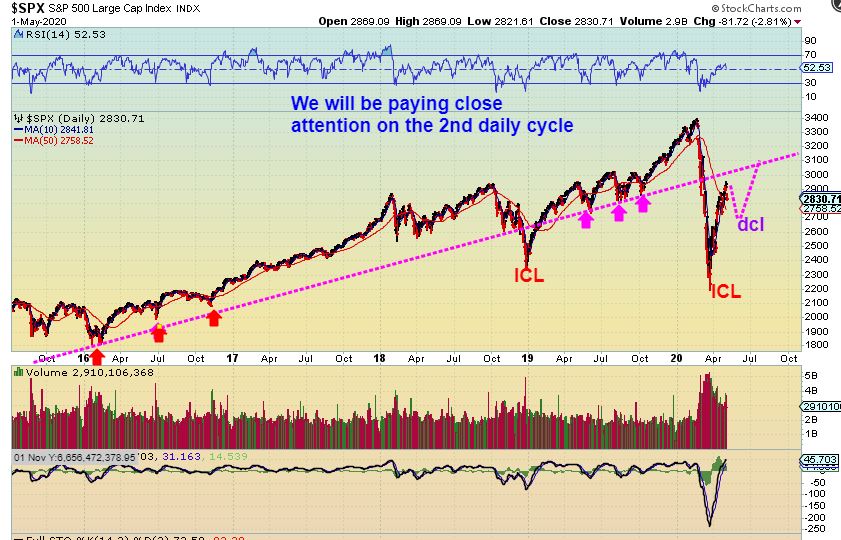
SPX –The first daily cycle is finishing up. This should now dip now into a dcl, and then run up & tag that trend line. We’ll see what it looks like at that point.
SPX WEEKLY – We now have a weekly reversal candle as of Friday, so that sell off into a dcl most likely has begun.
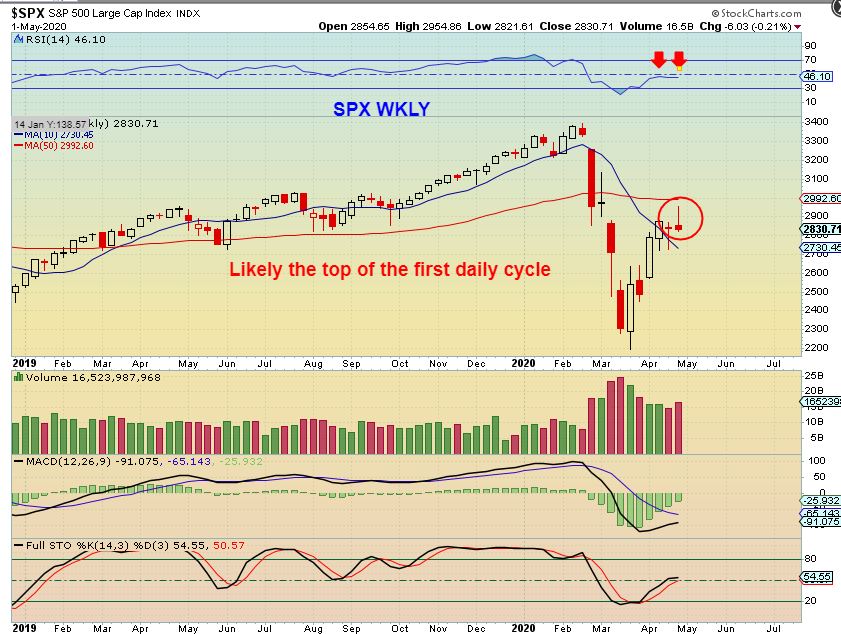
SPX – So we could see that dip to a dcl, and a weak bounce to the 50 week ma (Shown here) or a stronger bounce up to that trend line shown above. So far the move out of the lows has been on the stronger side.
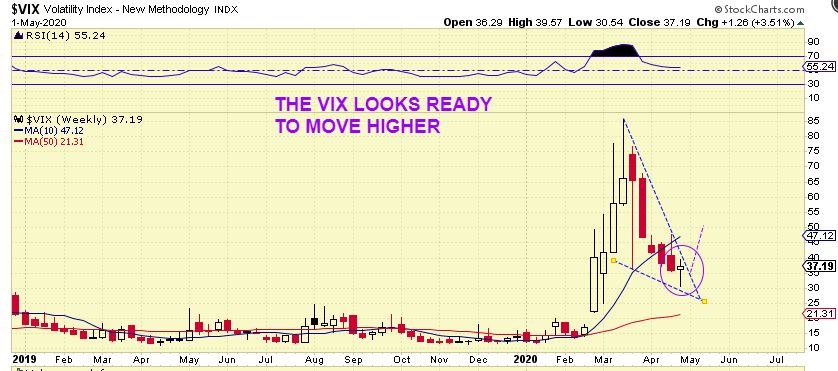
VIX– Adding to the idea that the markets look ready to dip is the VIX looking ready to move higher.
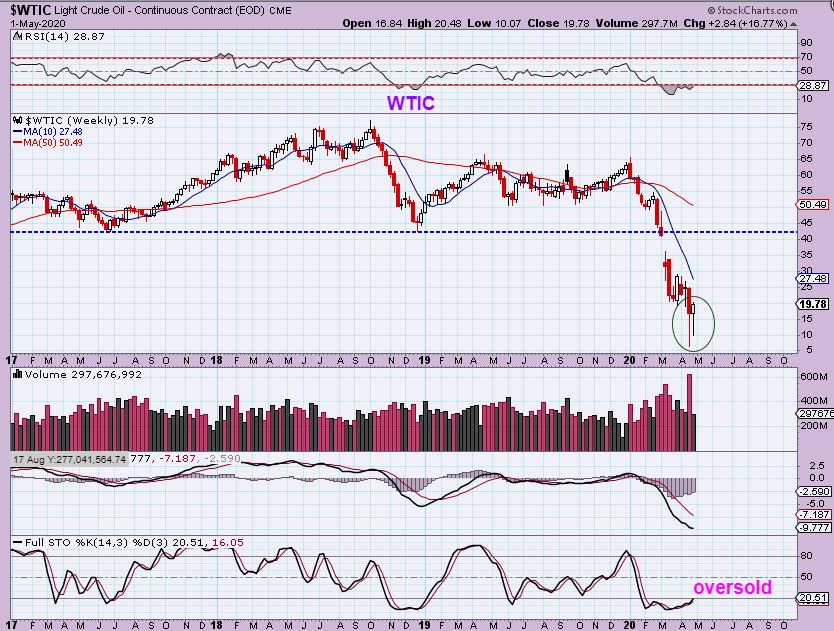
WTIX – Oil has finally bottomed, pretty much within the normal timing of a 52 day cycle, but the steepness of the drop within that time was certainly extreme.
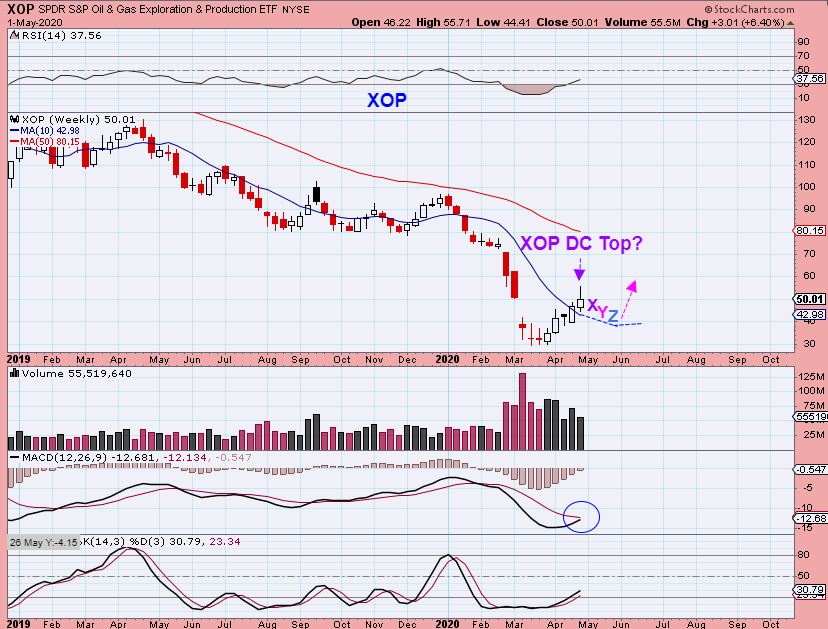
XOP – Oil Stocks bottomed weeks ago and now I see a ‘possible’ reversal candle on the weekly chart. A sell down here may be Mild with Oil rising, so I drew a drift along the 10 week ma. 38.3 or 50% Fibonacci drop?
.
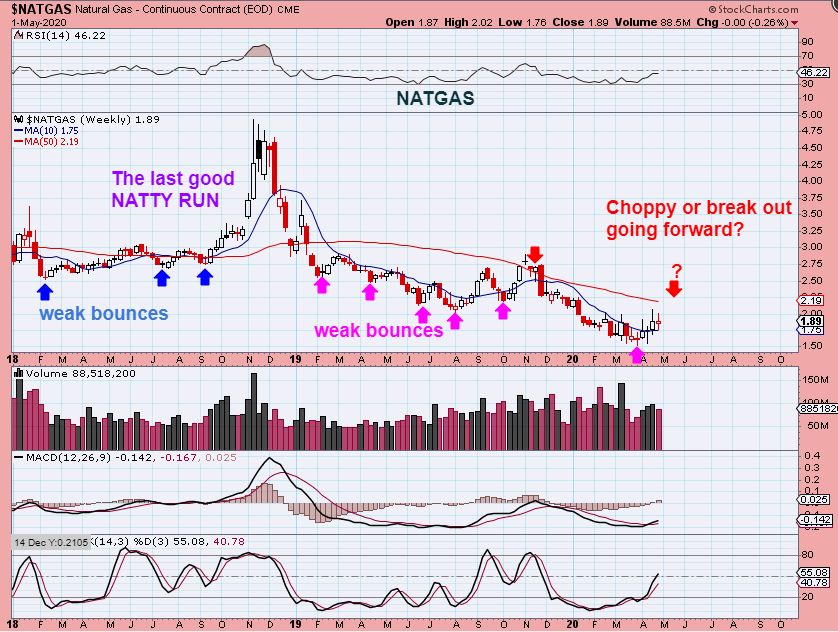
NATGAS WEEKLY – I think we finally have an ICL, but it has been choppy. You can see that many of these ‘Lows’ only rallied for a week or 2, maybe 3, so it is tough to know how far NATGAS will get out of this low. Let’s go to the daily…
.
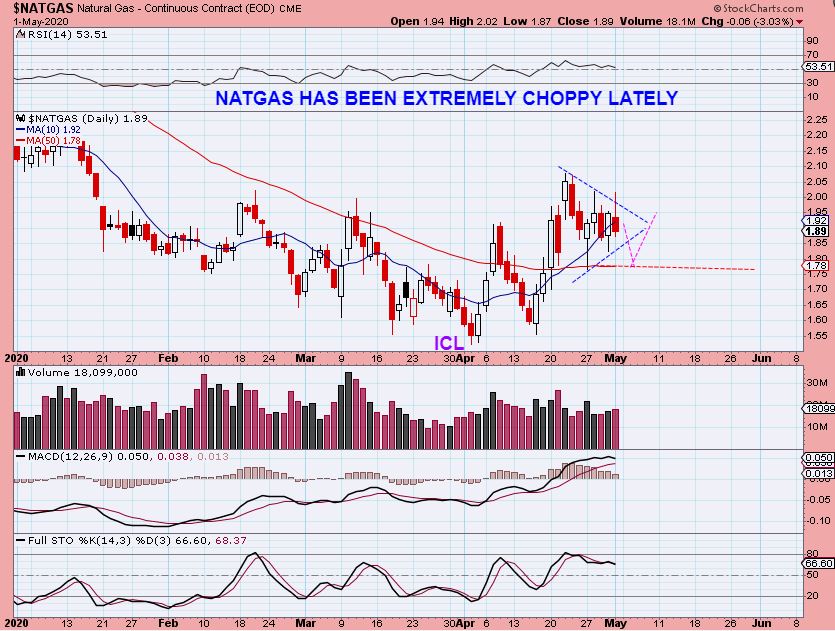
NATGAS DAILY – Look how choppy and difficult NATGAS has been. 3 days up and then drop. 2 days up, then drop. Putting funds in a little late on some of these rallies was like putting ants in front of an anteater- it just gets sucked away.
Currently: This could be forming a bullish triangle or it may drop to the 50 sma. It is still choppy day to day.
.
I AM GETTING AN EVEN MORE BULLISH FEELING ABOUT GOLD, SO LET ME SHARE THAT WITH YOU.
.
Do you remember when we bought that ICL in May 2019 and it ran to Aug/Sept? It had a strong rally and then when we were waiting for a dcl, I warned against losing position – “Don’t sell out of your miners, because you may not get in lower”. This was…
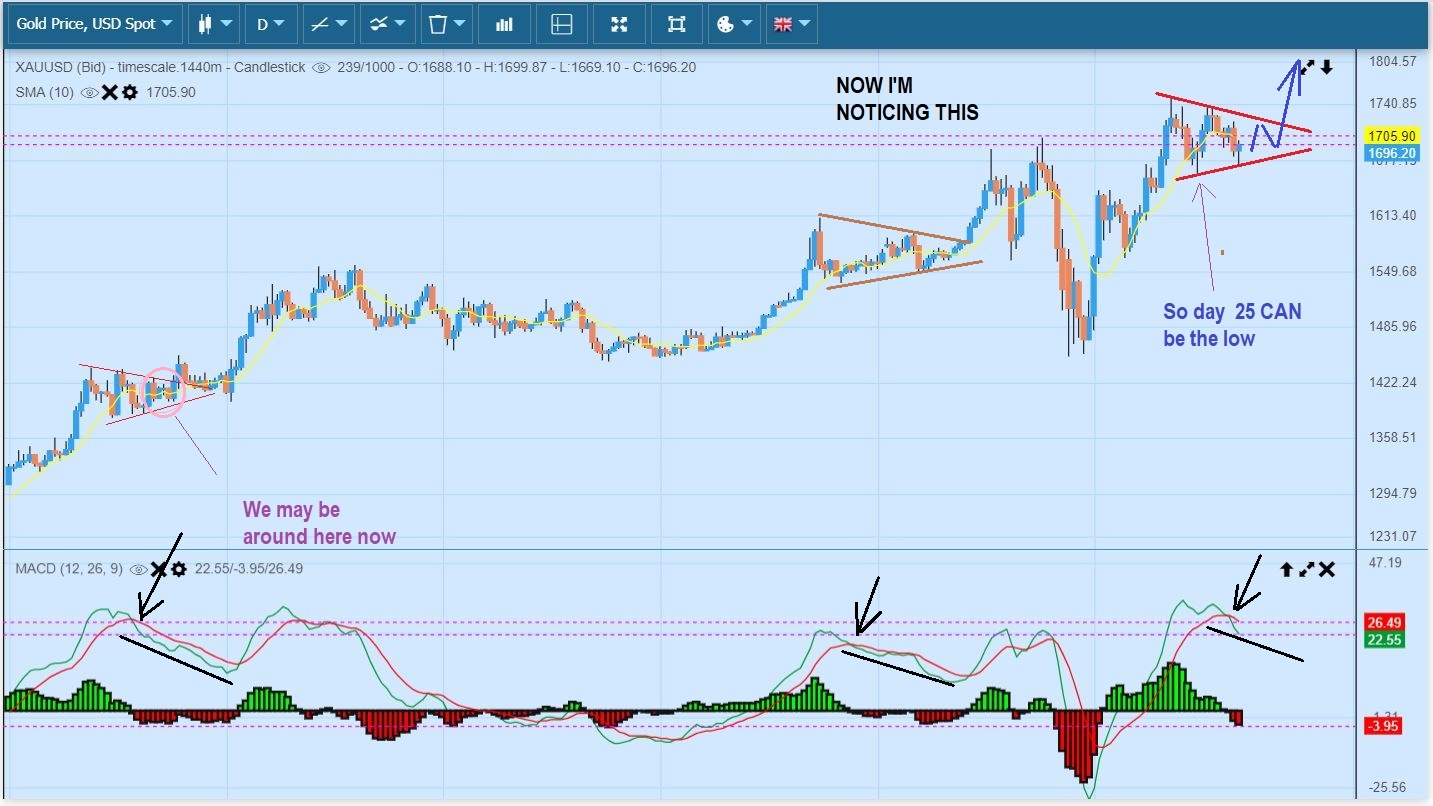
GOLD at that time. Notice the cycle count at DAY 28. As this ran sideways , I said…
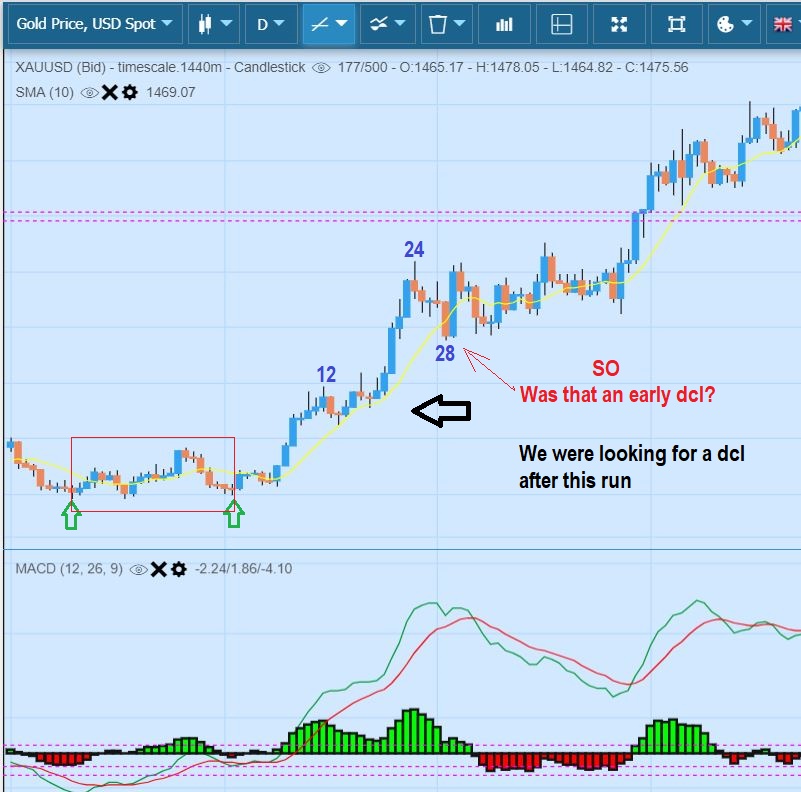
As this ran sideways , I said…
.
“I am seeing a triangle form. Triangles ignore or hinder Cycle counts and the lows aren’t broken due to the strength of Buyers.” I then added, ” If this triangle breaks, it is a BUY in ‘Technical Analysis’. I ignore cycle counts when patterns in Tech Analysis break out.” It broke out as seen below, chopped sideways, & ran.
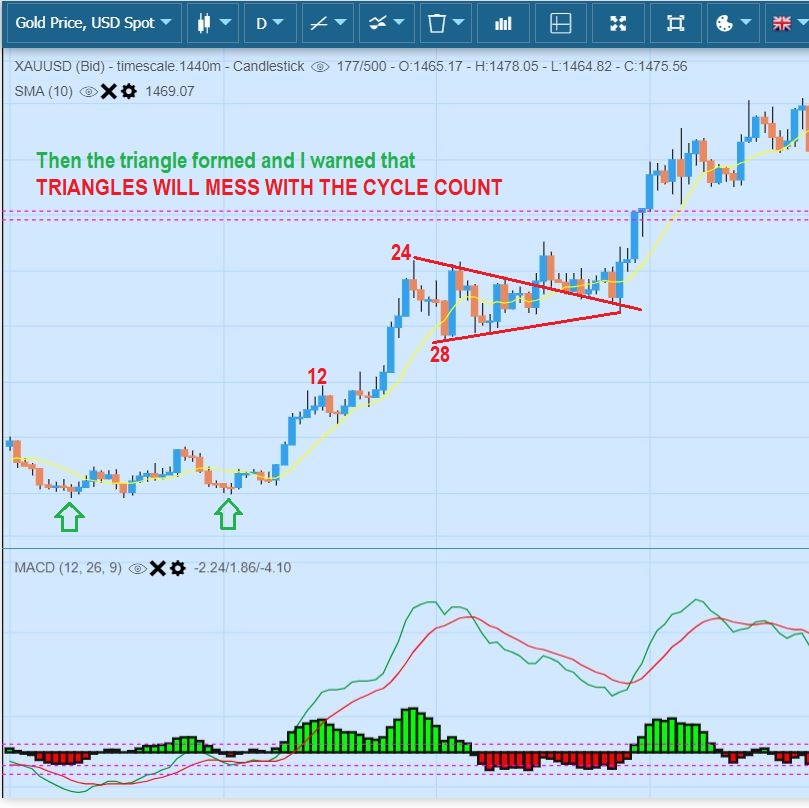
Well guess what I am seeing now? GOLD is possibly forming a triangle. You can compare on this chart that 2019 triangle with the current one. I circled where we look to be now. That triangle had a day 28 low. This has a day 25 low (so far).
GOLD WEEKLY – This can look like a topping candle, but I am pointing out areas where it wasn’t in the past, so I am ignoring it as a topping candle for now, and…
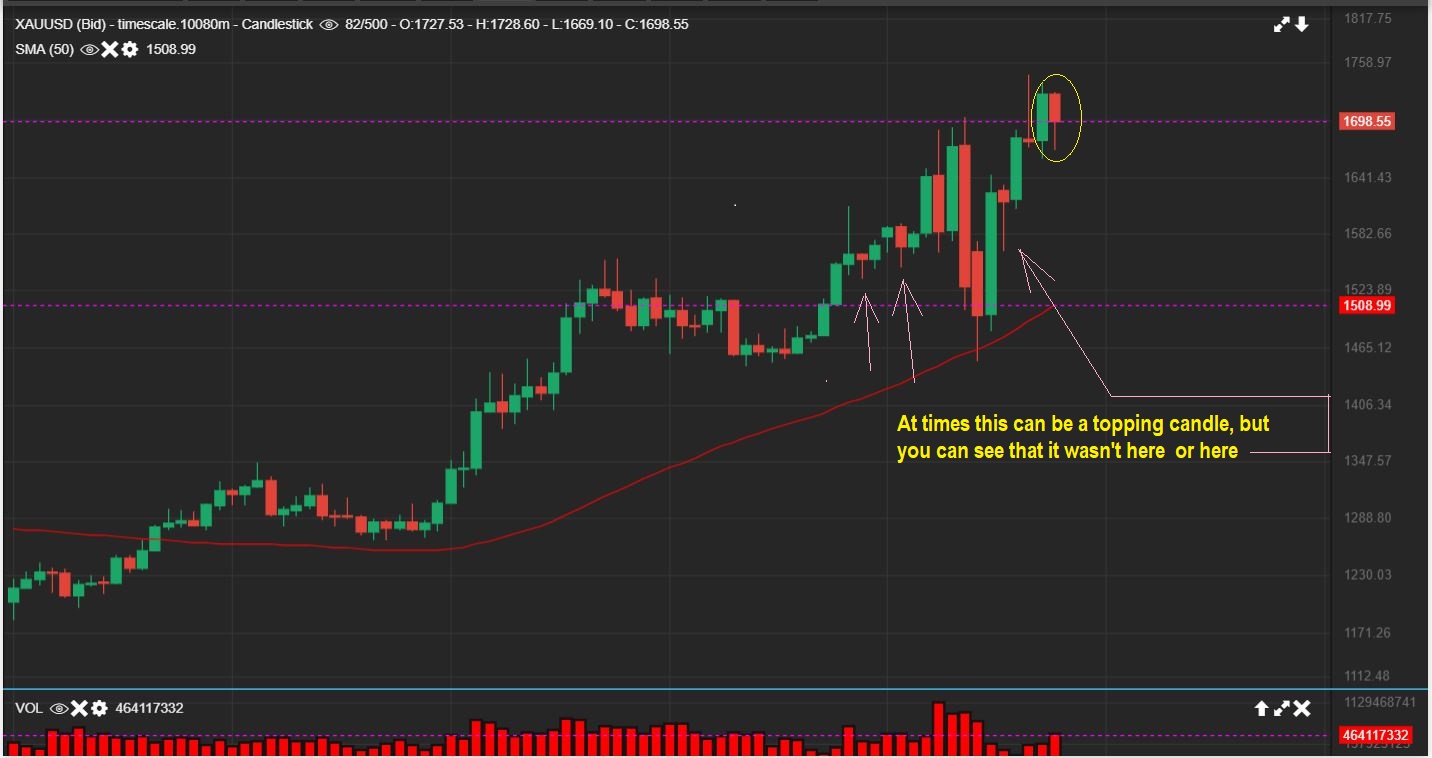
GOLD with that candle looks like a possible bull flag could be forming on the weekly chart too.
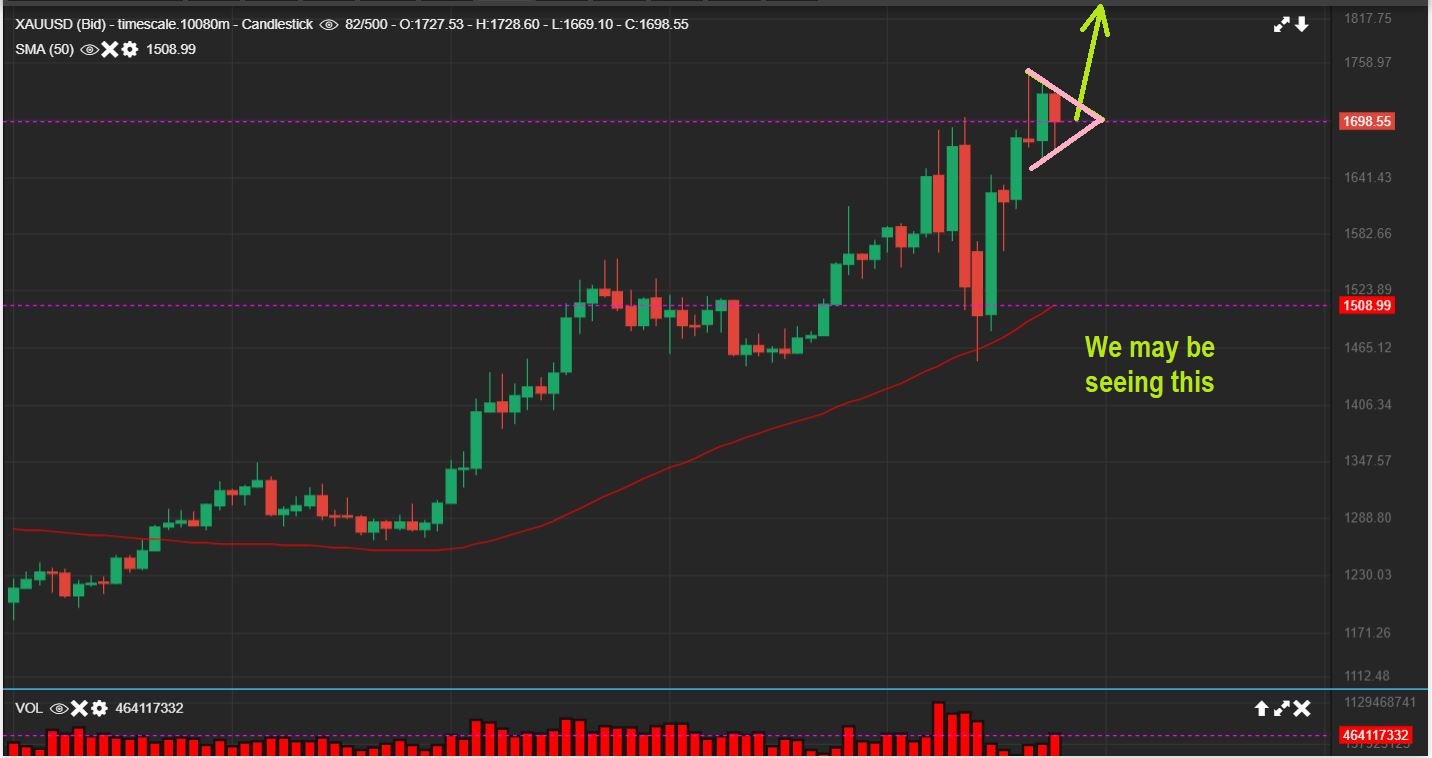
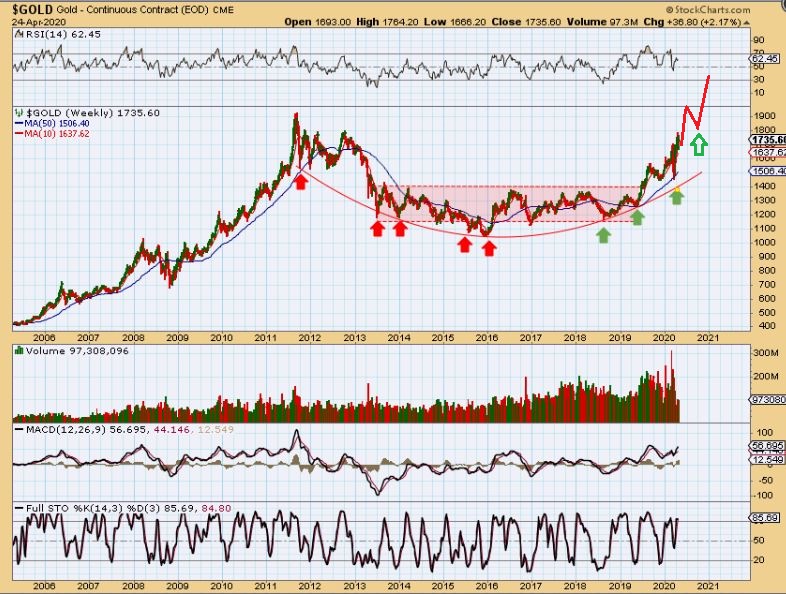
The important thing is the Big Picture for GOLD. I expect a run to the highs or new highs and then the next ICL can be a handle or back test. This has been a very bullish set up coming out of that base.
.
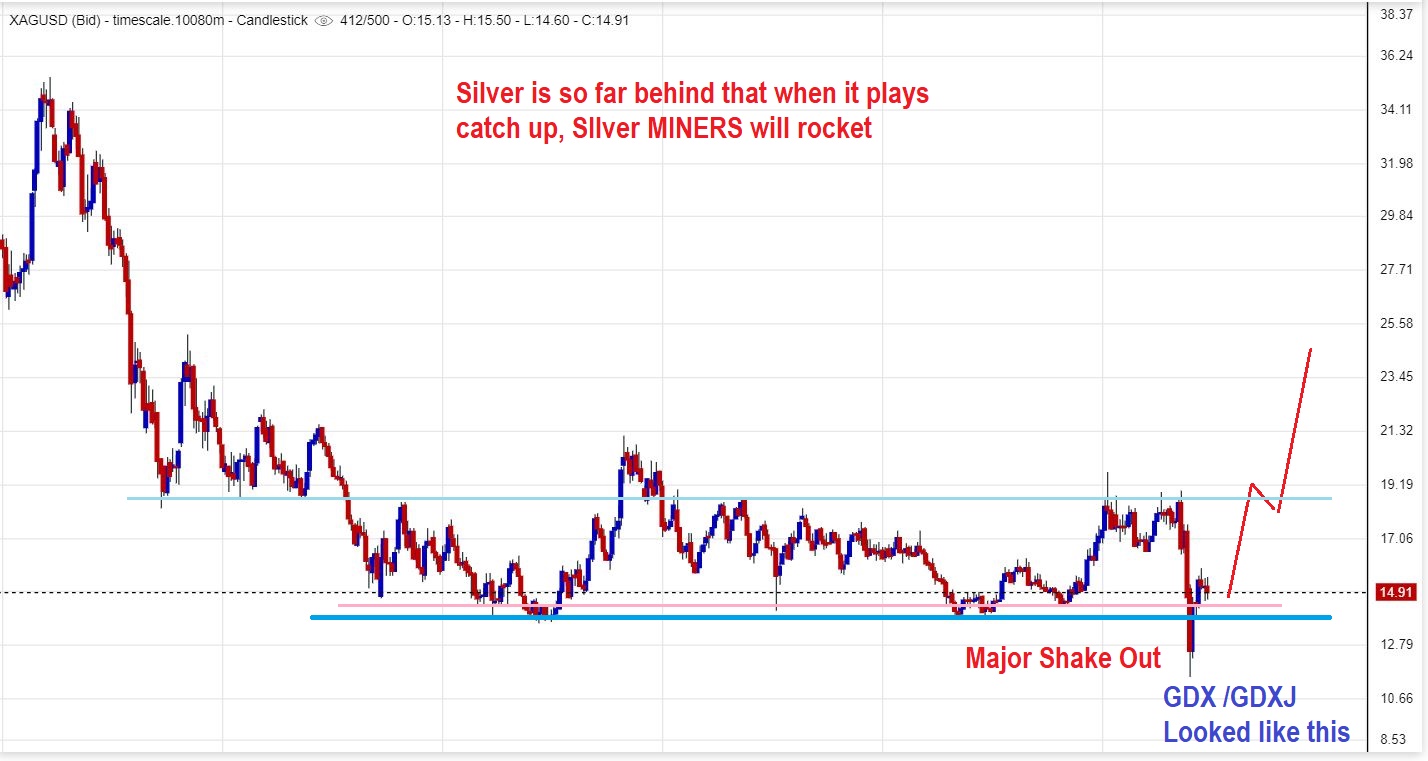
SILVER – Scroll up to that big picture Gold chart vs this Silver Chart. Do you see how much Silver can run here? Silver is still at the Base with tons of upside! Read the charts.
Let’s look at Miners now that I have possibly identified a triangle forming in Gold ( Bullish).
,
GDX broke the trend line and recovered Friday. It finally has a day 33 low (and reversal) under the 10sma. DAY 33 is right in line with a dcl, so take a look at the next chart…
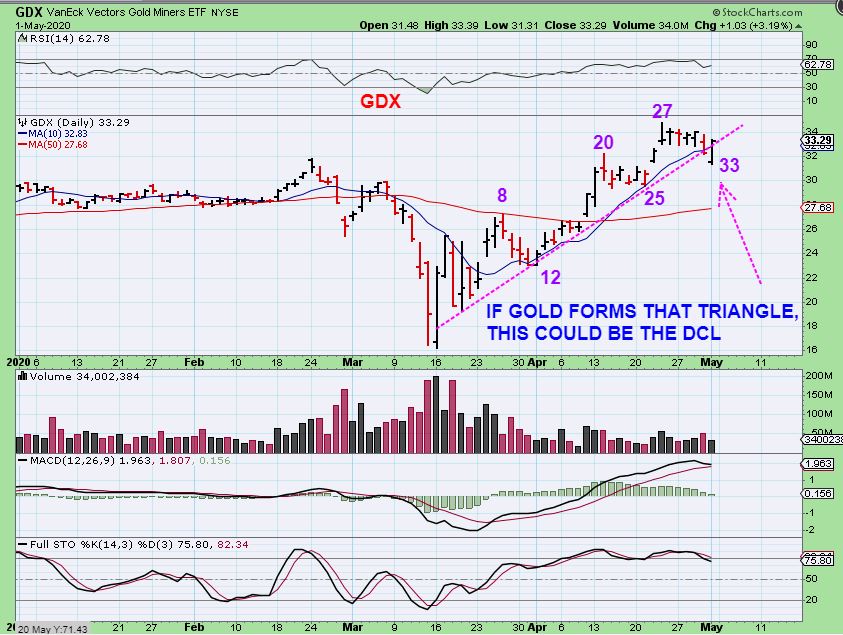
REMEMBER: I just pointed out that GOLD was forming a triangle in that summer of 2019 run. GDX Slammed and reversed at that time, AND THAT WAS THE DCL. That drop was VERY similar to what we saw on Friday, while gold possibly forms a Triangle here. So using this chart and the one above it, I am saying that the Full Moon may be Thursday, but we might already have a STEALTH DAY 33 DCL as of Friday, just like Aug 2019. 🙂
.
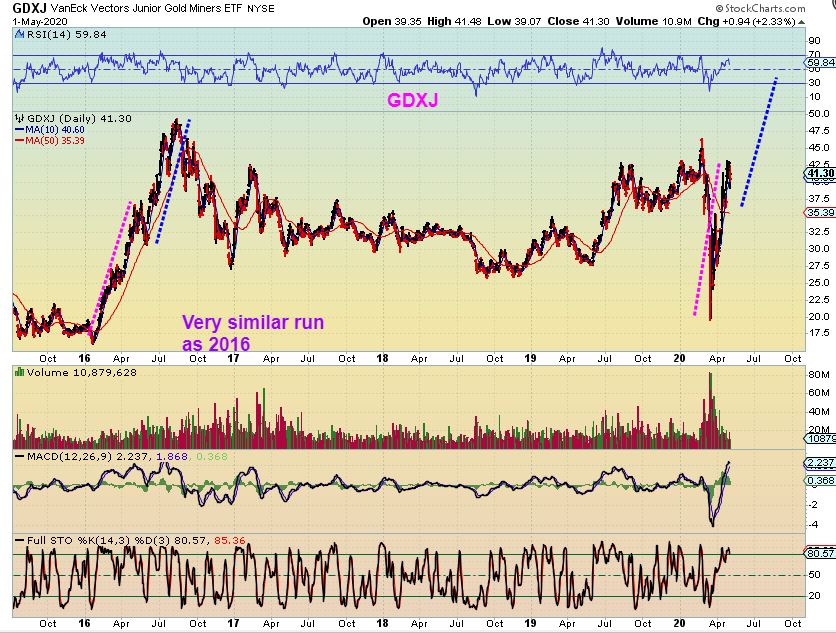
We have always said, I wish we could ride another run like we did during that 2016 Run. Well, ...
.
This run is not all that different, is it? This looks like the first 1/2 of the 2016 run, and the next daily cycle is how it would continue.
.
I wanted to keep this weekend review simple and clear, because we may be at a very important place for the Miners. We won’t know until we either get follow through higher or a drop lower next week, but to review and keep it clear in out minds:
1. GDX broke the trend line and recovered. It has a day 33 low (and reversal) under the 10sma. DAY 33 is right in line with a dcl, so take a look at the next chart…
.
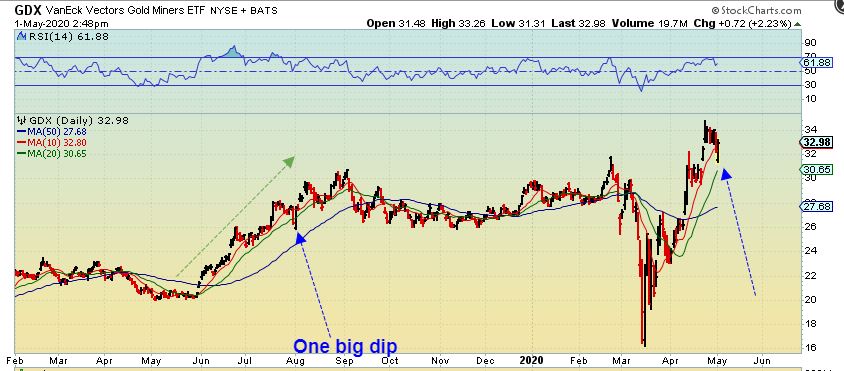
2. GDX – in July 2019 when Gold formed that triangle, GDX did a 1 day crash & recovered as the dcl. We are on day 33.
.
3. GDX – If you’ve wanted to ride that ramp up in Miners from 2016, we caught the lows with the R.R.Tracks Pattern, and now you’ll need to be in Miners for that second daily cycle too. We may be ready for that continuation run to start very soon.
.
Next week will give us the answer as to whether this was a dcl Friday or not. That is as simple and clear as I can be. We are very close to the next run in Miners, so relax, rest up, and Enjoy your weekend!! And thank you for being a chartfreak with me 🙂
.

