Friday May 1st – It’s Still Ahead
I believe we may have started to see the drop in the Precious Metals that we have been waiting for, and the General Markets are coming due for the drop too. In a report earlier this week, I mentioned that I thought that drop could start after the FOMC Mtg, and then it could end around the time of the Full Moon (due next Thursday). It has been whispered among various traders that in the same way that the Full Moon affects the tides, and in the way that it can affect personalities, the precious metals can also bottom around the time of the Full Moon.
I am not here to confirm or deny it, but I will say that I have seen Metals bottom ‘Roughly’ around the time of a full moon in the past, but I’m talking about give or take a few days. I look at it this way: Since Cycles run roughly 30+ days, it is not always going to be exactly on a full moon, but it will be close again this time. Lets get to the charts…
.
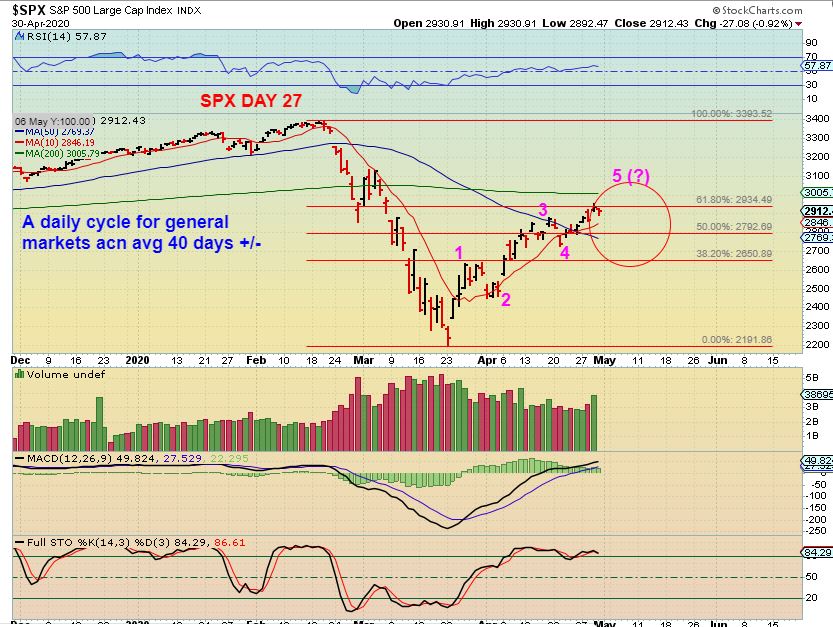
SPX – We are in the area that I expect the Markets to top or ‘peak’. We are at the 61.8% Fib area, but this COULD still make it to the 200sma. It is day 27 of possible 40 days. That does NOT mean that we will drop down for 10-15 days in a row…
m
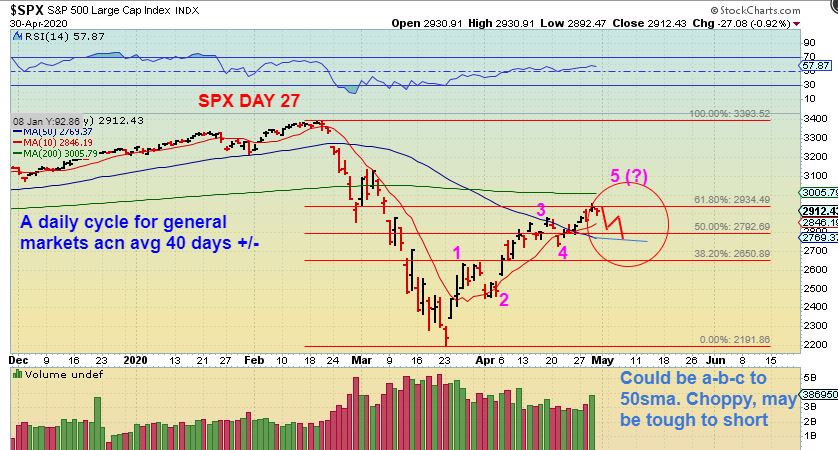
SPX – An a-b-c type of drop, for example, can simply dip down to the 50sma and it may be choppy and not straight down. It CAN break below the 50 sma, but after that first daily cycle? The ‘buy he dip’ crowd may keep stepping in. We’ll see.
,
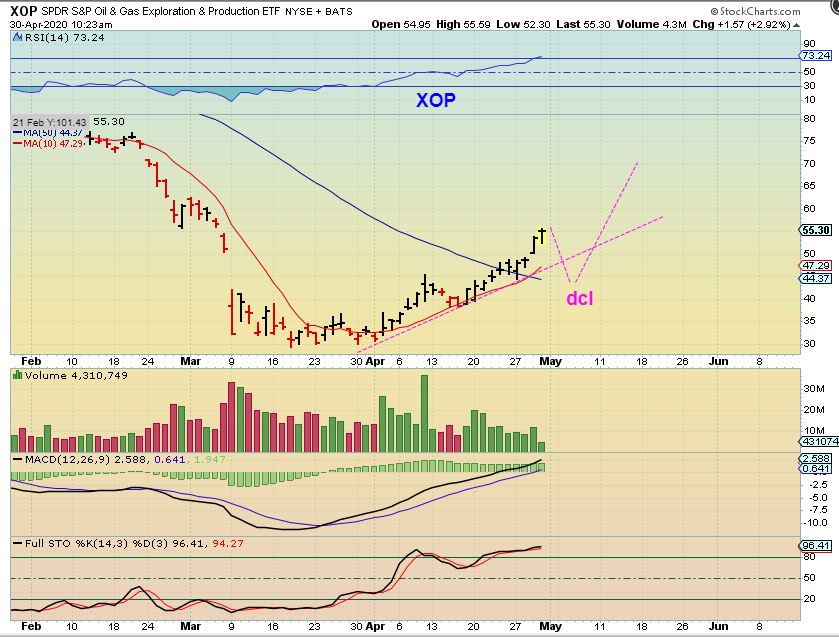
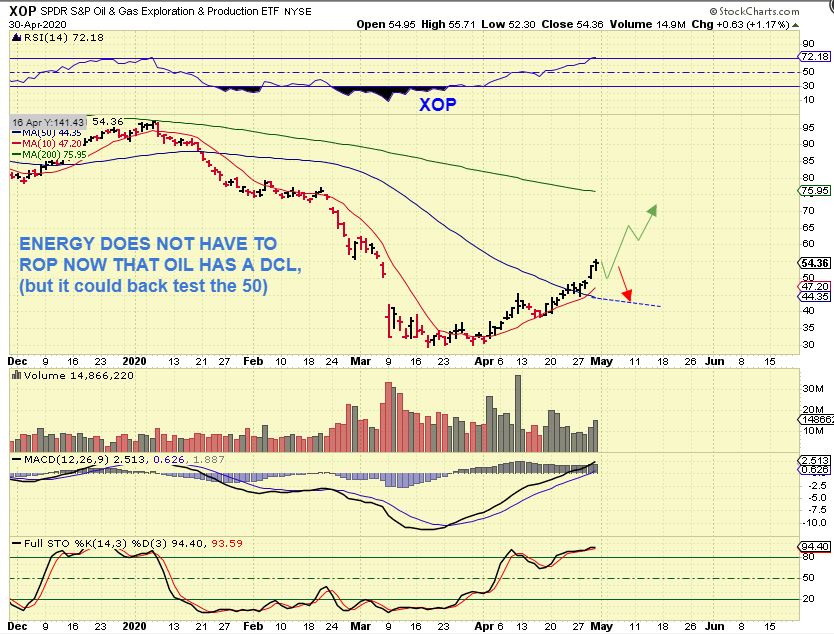
XOP – I was asked if the Energy Sector will drop too, when the General Markets drop ? It is hard to say, because Oil recently bottomed, but …
,
With Oil bottoming out, the XOP can simply continue higher too. This has been a strong move though, I see about 10 straight days higher in a row, so and that probably won’t last without at least some pause. I think that individual Stocks in this sector can continue higher. I will hold my energy trades (with stops).
m
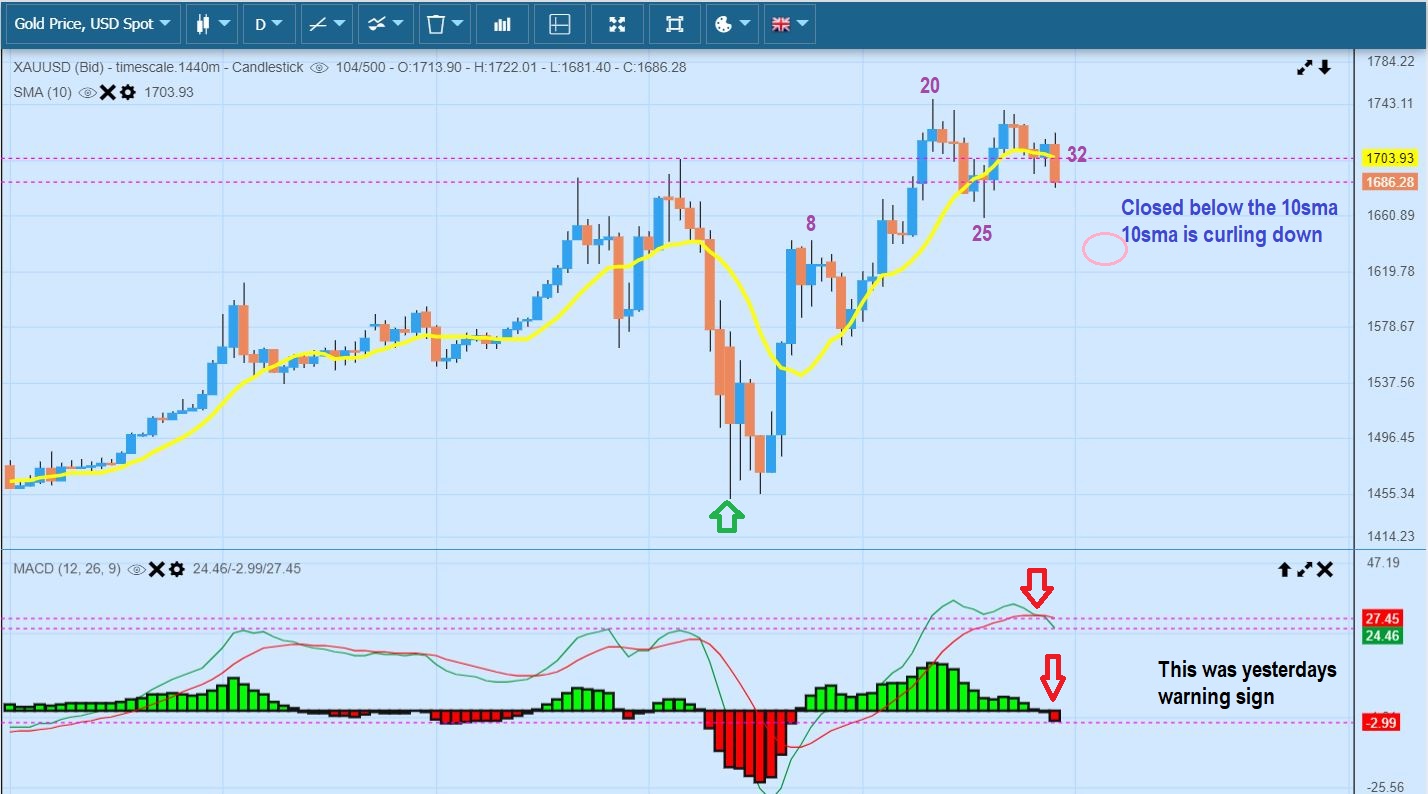
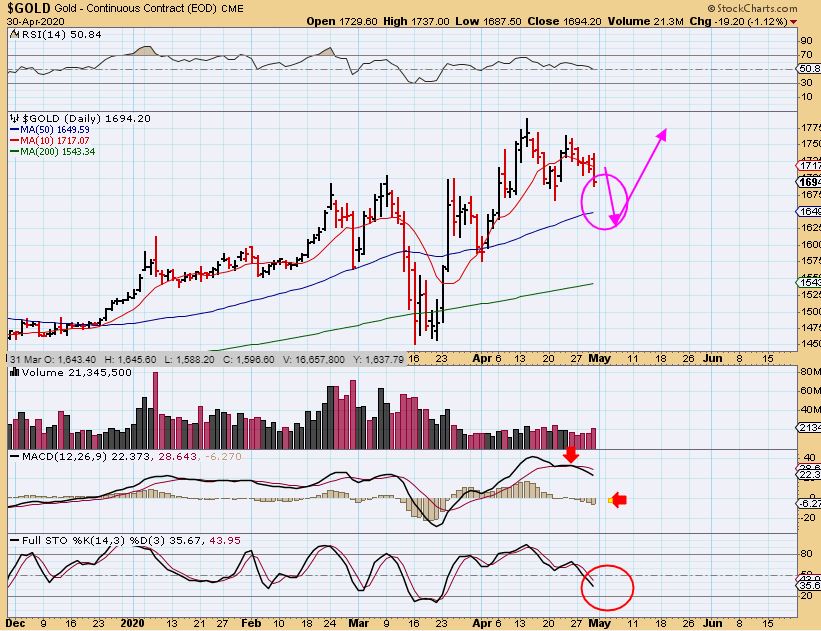
GOLD – Here is Gold on day 32 and this IS roughly the area where lows have formed in the past. Gold is now curling the 10sma downward and I’ll be looking for it to break below the day 25 lows and then form a dcl. It can happen quickly.
.
Do you remember that drop in Mid April where Gold dropped $122 in about 5 days? That could repeat. Miners basically ignored that drop, so they may drop mildly here, but I do expect them to drop at least a little this time.
,
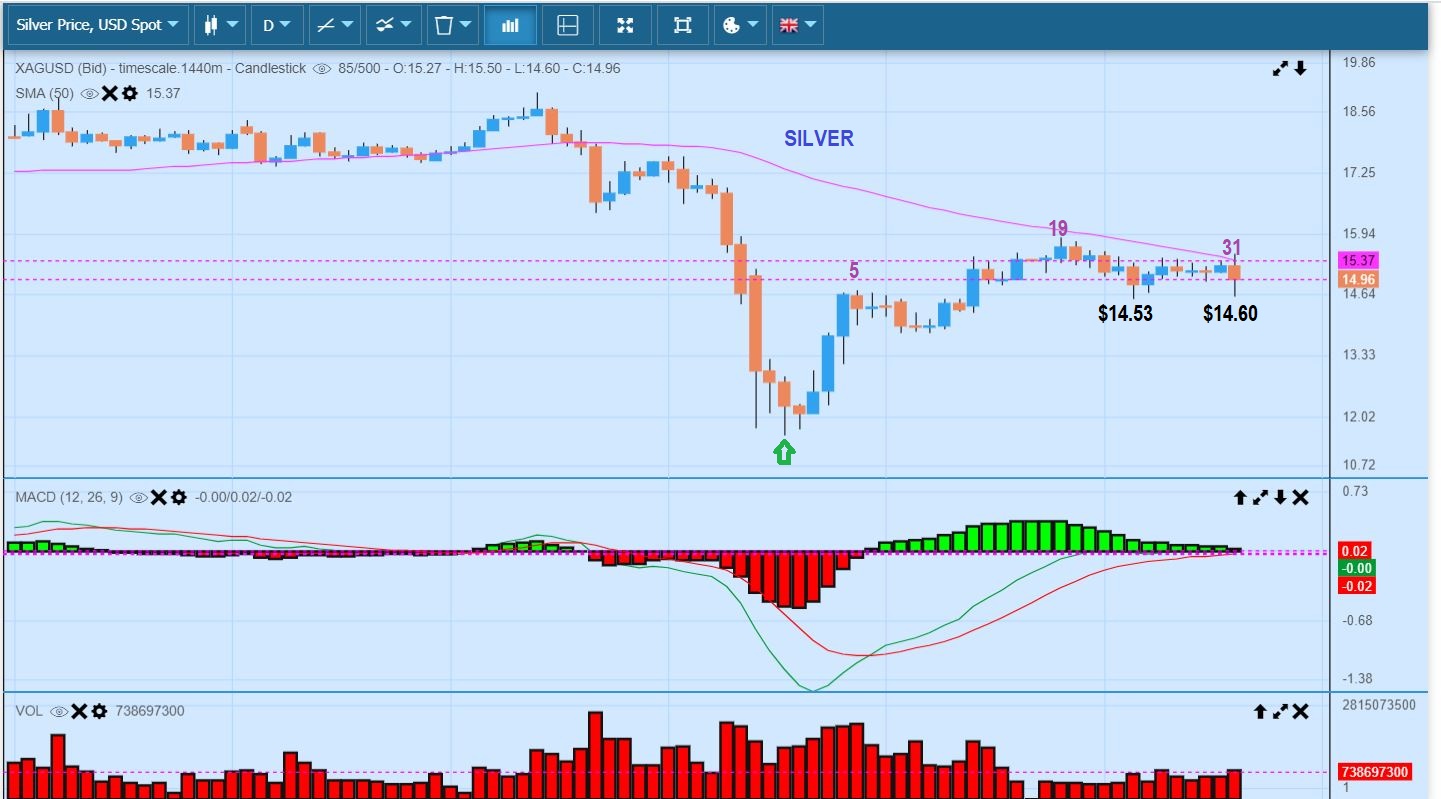
Day 31 : SILVER ‘s recent low was $14.53, and Thursday Silver dropped to $14.60, ALMOST taking out that low. I would expect Silver to break below the $14.53 low as a shake out ( run some stops) and then form a dcl.
.
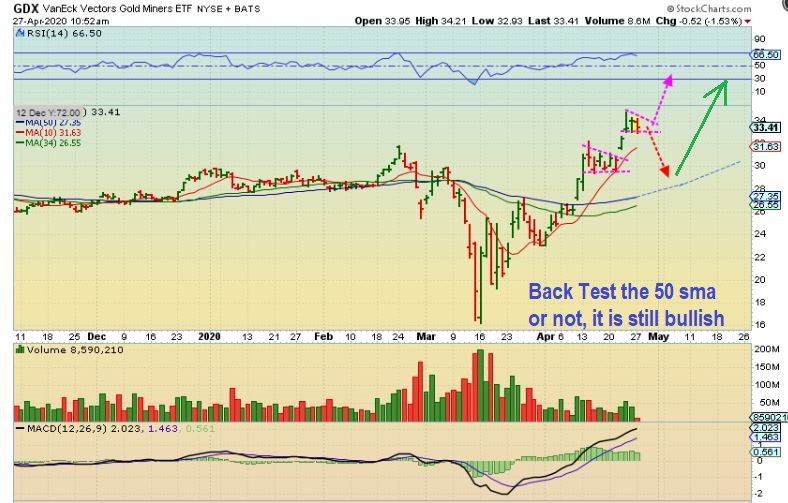
Do you remember this chart of the GDX from April 24? It would bull Flag and then suddenly sell off. It was one of the ideas that would fake people out and possibly even shake them out. Our current GDX chart is starting to look like this...
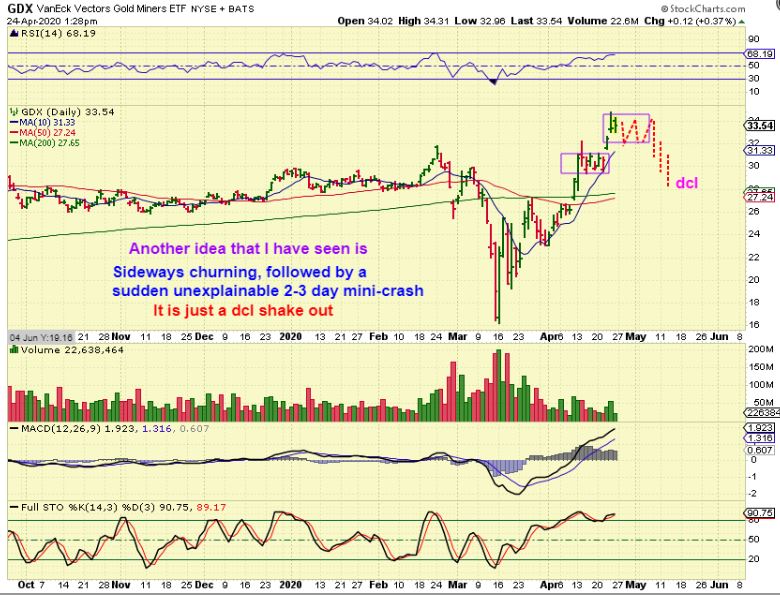
.
GDX sideways and then breaking down? Well, GDX has finally broken below that 10sma. The 50 & 200 sma are possible targets. (read the chart).
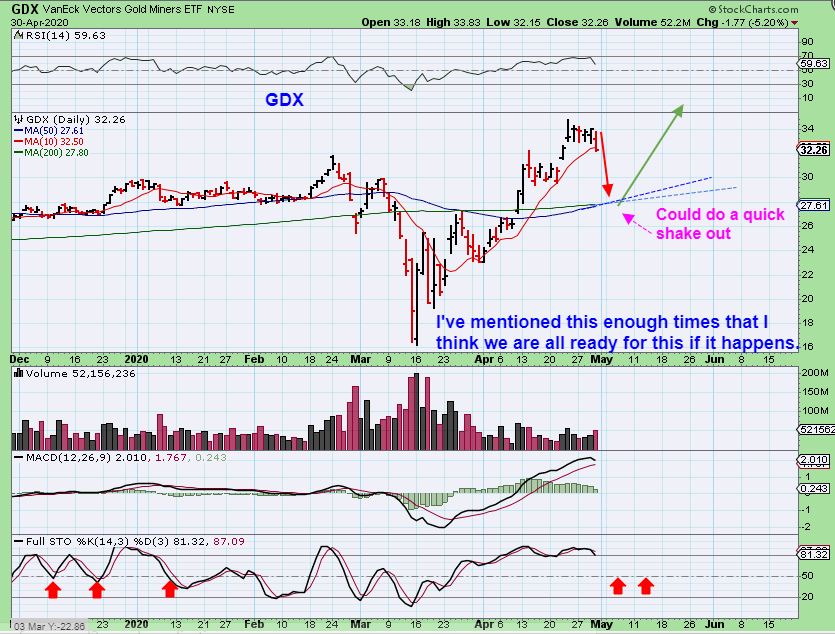
,
Again, this idea was to prepare us for what might come our way. Now Gold looks ready to sell down, GDX closed below the 10sma, so we are prepared to buy a reversal / dcl when that happens.
,
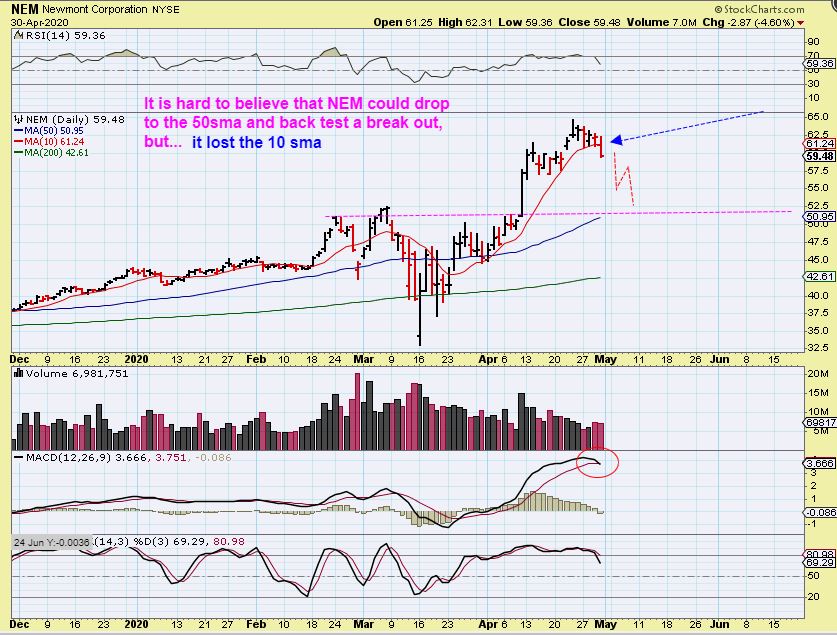
I’m not selling all my Miners, because the dip may be shallow, and we have seen Bull Flags and dip buying lately, but I did think about something today. Doesn’t an extended Miner like NEM look like it MIGHT drop a good distance? $62 to $ 52 is rather big…
.
NEM has been one of our stronger leaders at new highs. It lost the 10sma today and closed below it too, so this could really drop. Read the chart.
,
So with that in mind:
.
KGC -I started buying KGC back here in this area of $4.20-$4.30 area, and posted that I owned it in my reports. Then…
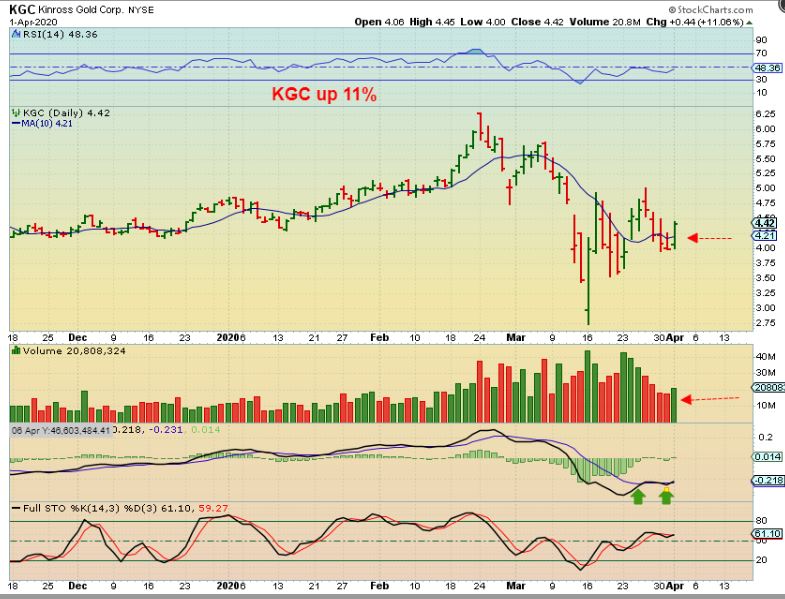
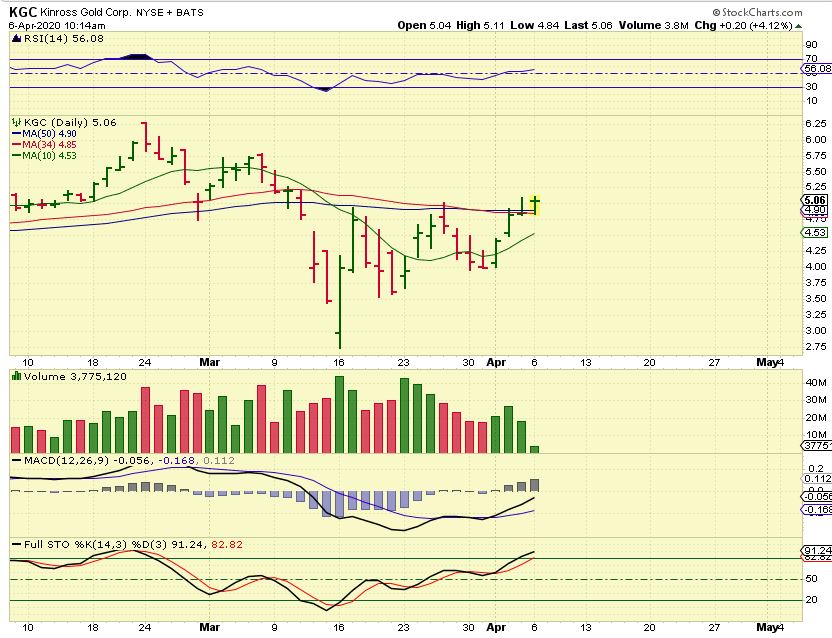
KGC jumped to the 50sma and I added again, so I was buying in the $4.20-$5 area. Now…
.
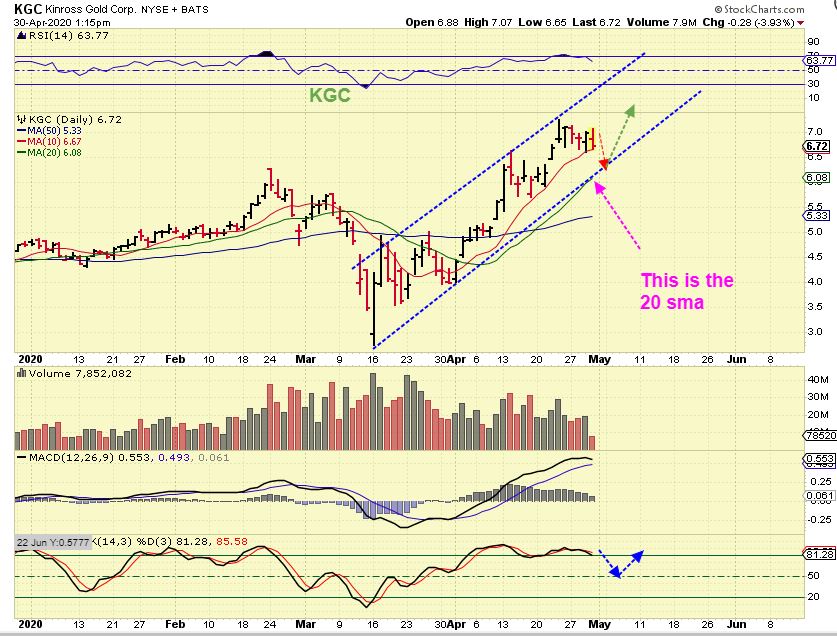
KGC hit $7 Thursday ( Almost $3/share gains) and it reversed. We have had bull flags, so that is not a problem, but
1. The GDX was breaking below the 10sma.
2. NEM was also breaking down, so KGC could too, right? That drop Might be big too.
I drew this as possibly tagging that 20sma & lower channel line, so that is nothing to worry about, but this also COULD drop to the 50sma too, right?
,
SAME CHART : I have a big position in KGC from down around the 50sma ( $4-$5 area), and a drop that far erases all of my gains, so I decided to just sell 1/2 just & lock in those good gains for now. This was JUST IN CASE this gets to the 50sma, and I will look to re-buy later this week. If this holds up and I enter up here, that’s fine. If it drops and I enter at $5.50? Even better.
b
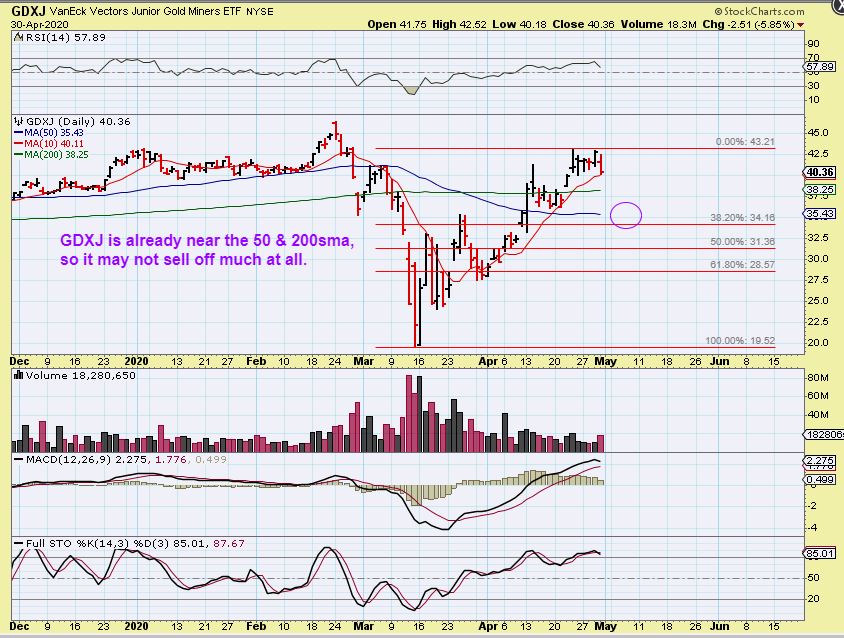
NOW CONSIDER THIS: GDXJ didn’t break to new highs, is still close to the 200sma, so it may not pull back all that much. Look where the 50sma & 200sma are, so I am not selling all my miners. I simply trimmed an extended one to avoid losing all my 1 month gains in a few days. Other Miners may hold up just fine.
.
So it is Friday the last trading day of the week. You may or may not want to adjust some of your portfolio, that is up to you. I do not expect a deep prolonged sell off, but some of these that have run up to new highs can drop and back test the 50sma or break out.
I am not going to post a load of new ‘trade ideas’ today, because I have had quite a few in recent reports and also because the ‘timing’ for a dip has arrived in Miners and possibly also in the General Markets. This can create a great buying opportunity in a week or so. I am going to ride most of my current positions out, and I am also looking forward to seeing if the Energy stocks will resists the selling with Oil early in its daily cycle.
.
Enjoy your Friday trading, stay Safe, and enjoy your upcoming weekend!
.
~ALEX
.
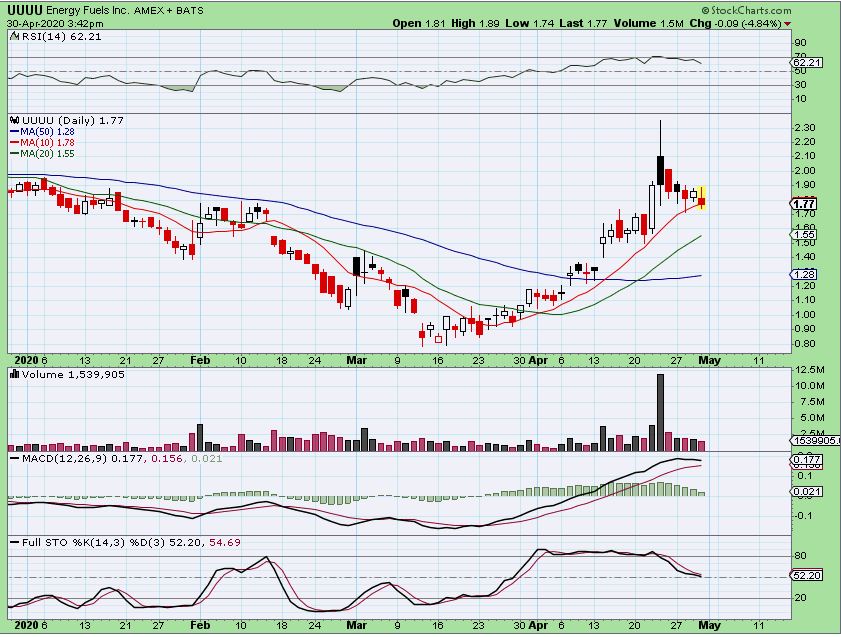
Sidenote: UUUU – Those Uranium rockets are pulling back too, so I am watching to see if they continue selling with Miners, or carve out a path all on their own. The 10 may be support?if not , watch the 20sma? Maybe the 50sma. See also URG, UEC, DNN, CCJ, NXE. Using the 10sma, they are all very similar.
.
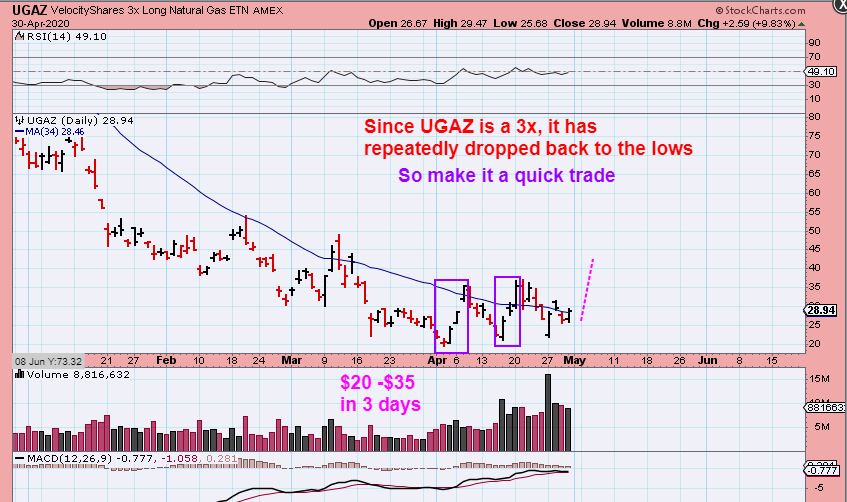
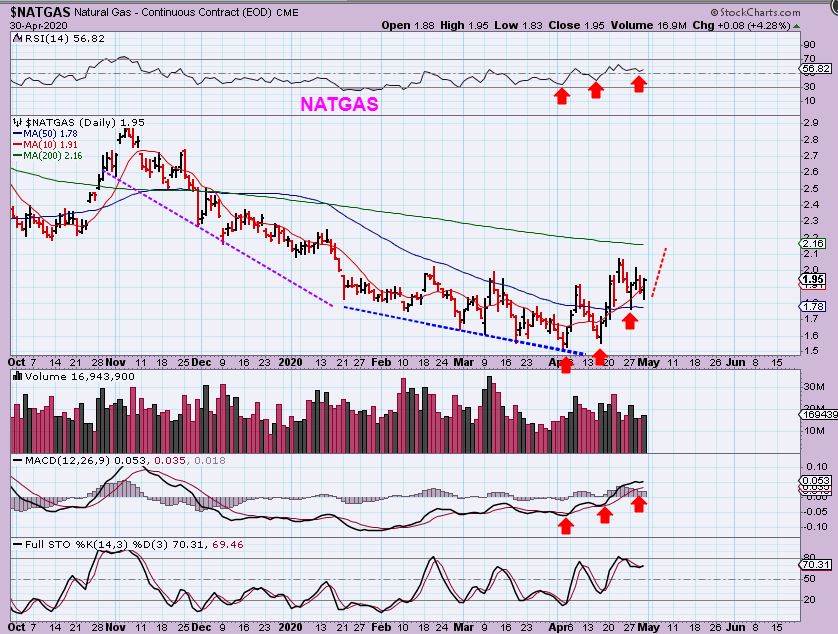
NATGAS: After many pop and drops to new lows, again and again, NATGAS has a series of higher lows now. It may make a run to the 200sma and then drop into a dcl. For the adrenaline junkies…
b
UGAZ: For the adrenaline junkies, this could be a fast trade. You can see that UGAZ has been popping from $20 to $35 in 3 days. This is one of those trades that you just put some spare cash on, use a stop, and hope for the Pop. THIS IS NOT one that you go in heavy hoping to double your money. This has been choppy, it’s tricky, but it can be rewarding if it pops. If NATGAS drops, UGAX dives. Be careful, small position.