
April 29th – F.O.M.C. Mtg Today
We will have the results of the Fed Mtg today, and then the full moon is due next Thursday. SOME PEOPLE feel that Lows or highs come in around the time of a full moon, so I figured that I would just mention it since we are still due for a dip in the general markets and Precious Metals Markets. Could the FED MTG trigger a ‘peak in the general markets? That is possible. Could it trigger a sell off in Precious metals, down into a dcl around the time of the full moon? It’s possible. Could the FOMC MTG trigger a rally from here, with the dcl being on day 25 for Gold last week? These are just some things to consider as we move forward. Let’s look at our charts…
.
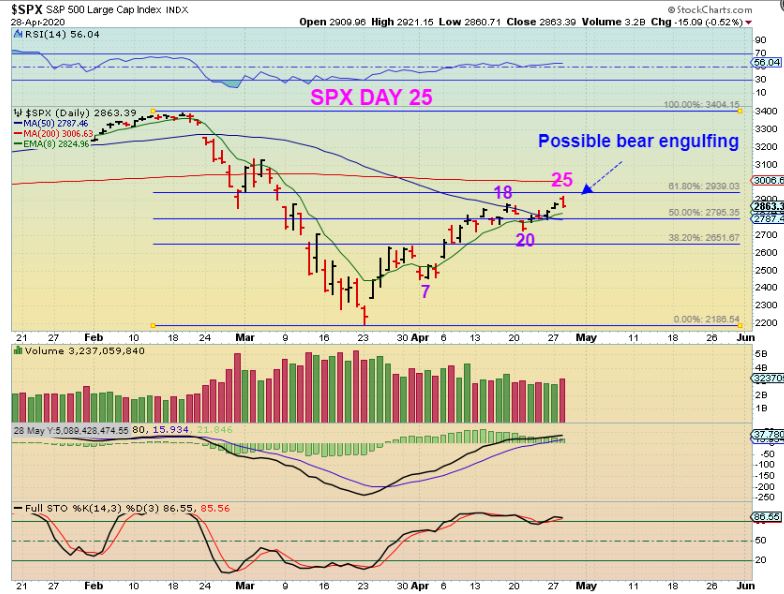
SPX – On day 25 we got what looks like a bearish engulfing. A gap open that sells off is weak. It is possible that the first daily cycle is ‘toppy’, so we’ll see what happens after the Fed release at 2 p.m. Eastern Time.
n
SPX SAME CHART – There is support possible at the 50 sma and 10sma that may hold, but volume increased on the selling and that looks like a bearish engulfing, so I would be cautious if I were long here.
.
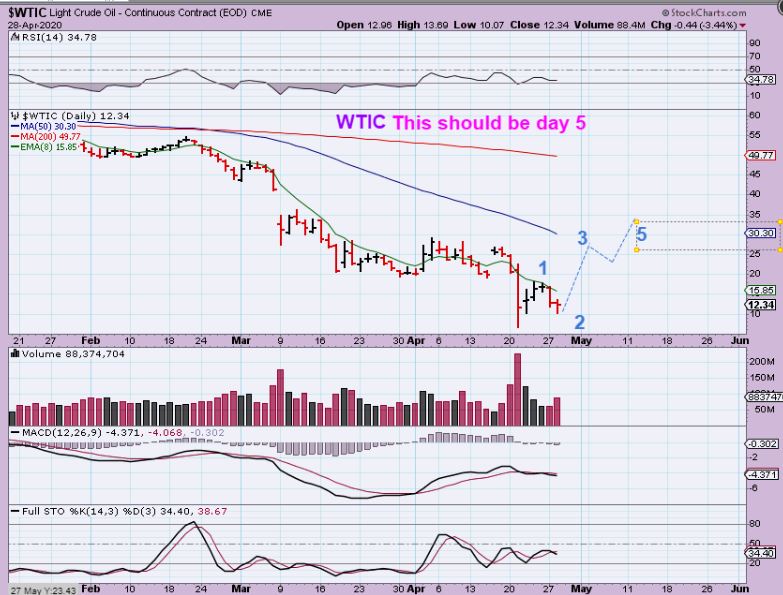
WTIC – Wednesday is the release of the Oil inventory report. I am expecting this to be a higher low, we’ll see if the lows hold. I have mentioned in past reports that…
.
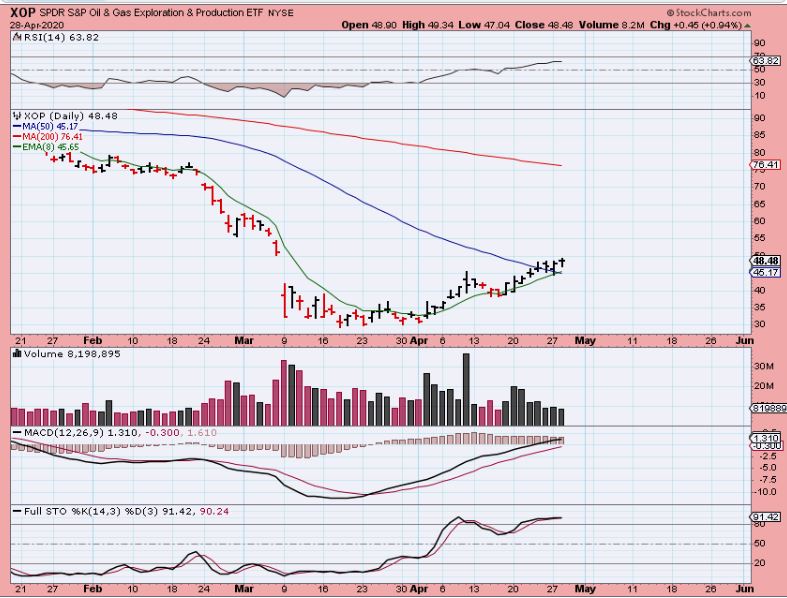
I have mentioned in past reports that Oil Stocks have been bullish for weeks, despite Oil crashing to new lows last week. We have actually been making good gains in this sector, though it is not always easy to buy & hold.
.
Wouldn’t you say that Precious Metals almost always reacts to the FOMC MTG? YES.
.
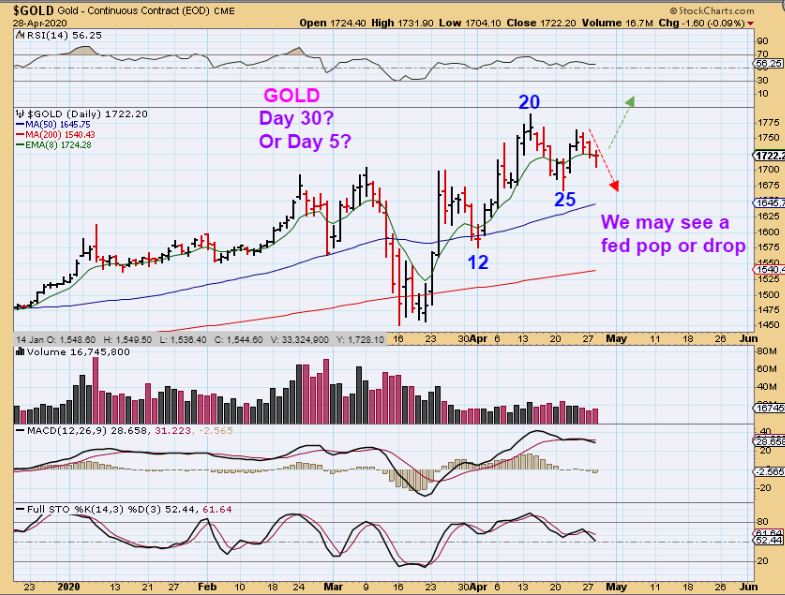
GOLD almost always reacts to the FOMC MTG, so this is a tough call. Was day 25 an early DCL and we get a Fed Day Rally? Or could this trigger a final sell down? Miners are acting bullish and ignoring Golds pull back, so we should be very interested in the fomc mtg today. It may reveal this as day 5 or day 30 and a quick drop finishes the daily cycle.
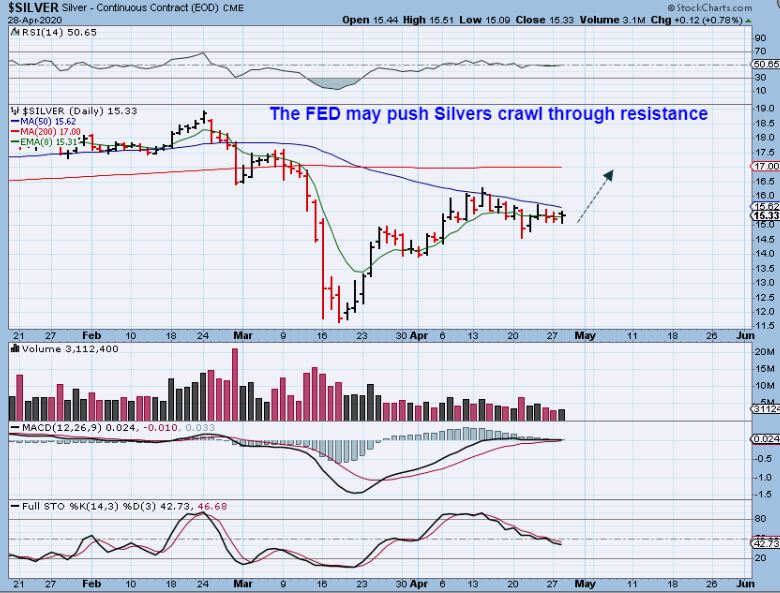
SILVER really looks like a Bullish crawl along the 50 sma. These usually break higher, the macd is solid, and Silver stocks have actually been pushing higher recently too, so this looks like it will break out higher. FED JUICE? We’ll see.
.
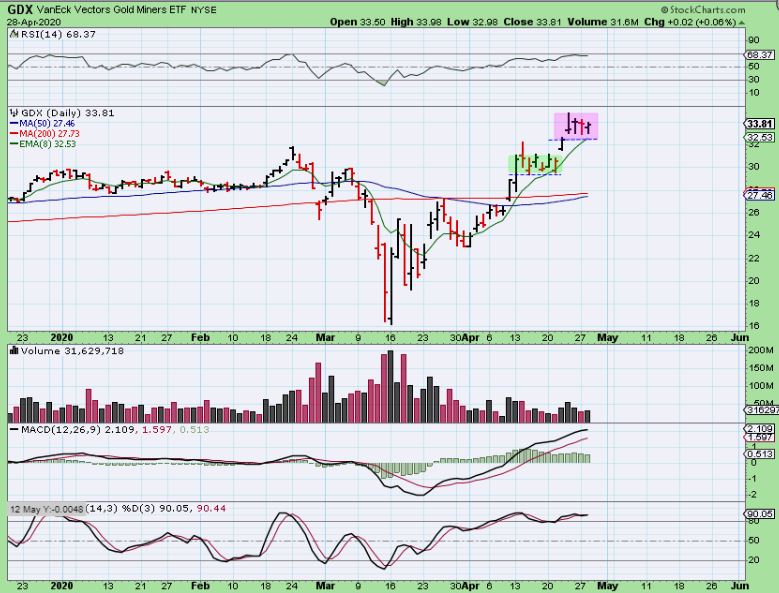
GDX – This is just pure bullish action so far, especially when Miners were ignoring the selling that Gold has had. We just keep seeing Bull flags form. This SHOULD break higher, Wednesdays fomc mtg could be the catalyst.
.
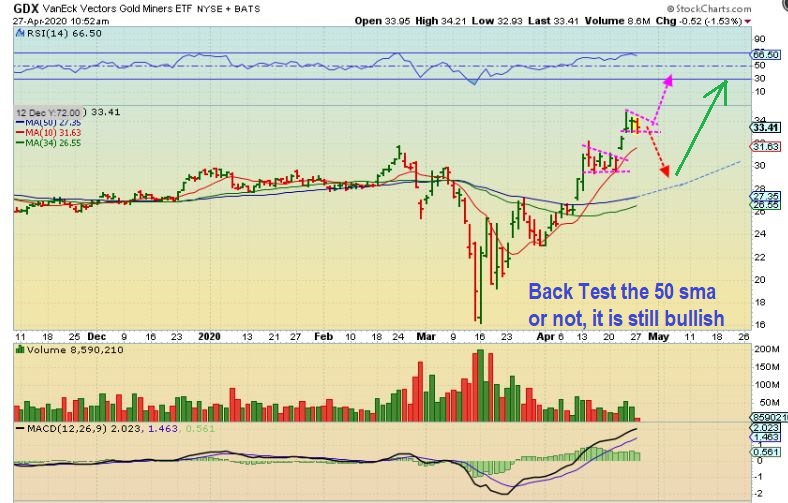
Yesterdays report had this idea: The GDX can drop to the 50 sma. This could match a Fed Sell off and a Full Moon low next week.
.
I have people tell me that they expect the Full Moon to be a low for precious metals, but wow does this sector just look Bullish right here and now. Todays FOMC Mtg should help move things along, because this is one sector that almost always reacts to what the Fed Says. If you are ‘under-invested’ in Miners, you may want to consider adding, because they are acting like they are under accumulation.
.
We possibly have a bearish engulfing in the General Markets (day 25), right before the Fed Mtg too, so be cautious with longs there. It may not be the best time to add to long positions, and raising stops may help. We also could have a higher low in OIL and Wednesday is the oil inventory report, so that sector may increase in Bullishness, we’ll have to wait and see. I have already covered many Oil / Energy stocks and set ups in this recent reports. We can ride current positions and see how they play out, you can lighten up if you are uncomfortable, or some may wish to find a low risk entry or two in that sector and start a small position, if it interests you and they continue to act correctly.
.
Enjoy your Wednesday Trading!
.
~ALEX
.
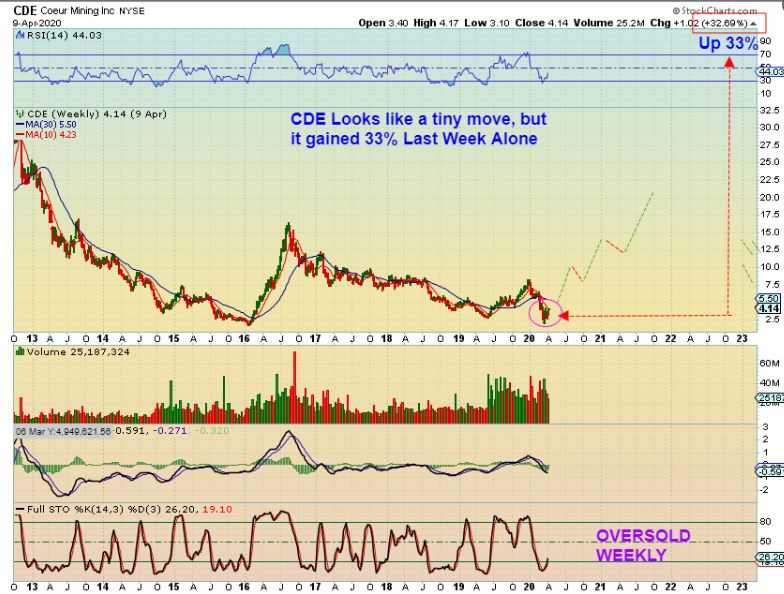
CDE – Last Thursday CDE dropped sharply through the 50sma after releasing earnings. It then stabilized and on Tuesday it pushed higher by 10% and erased 1/2 of that down day. THIS IS A BUY if it stays above that 50sma ( or just buy it here). It is now ignoring the earnings drop.
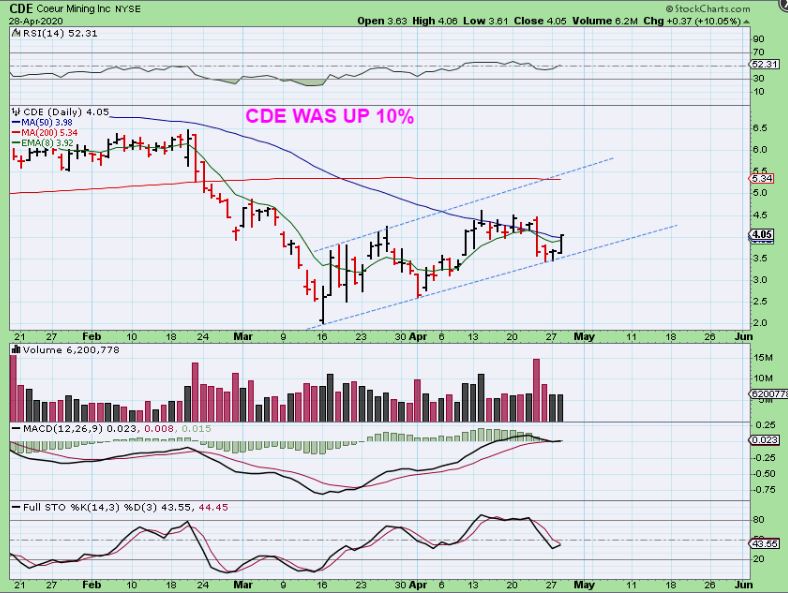
My Big picture Chart on April 9 showed CDE s potential if the sector keeps running bullishly.
.
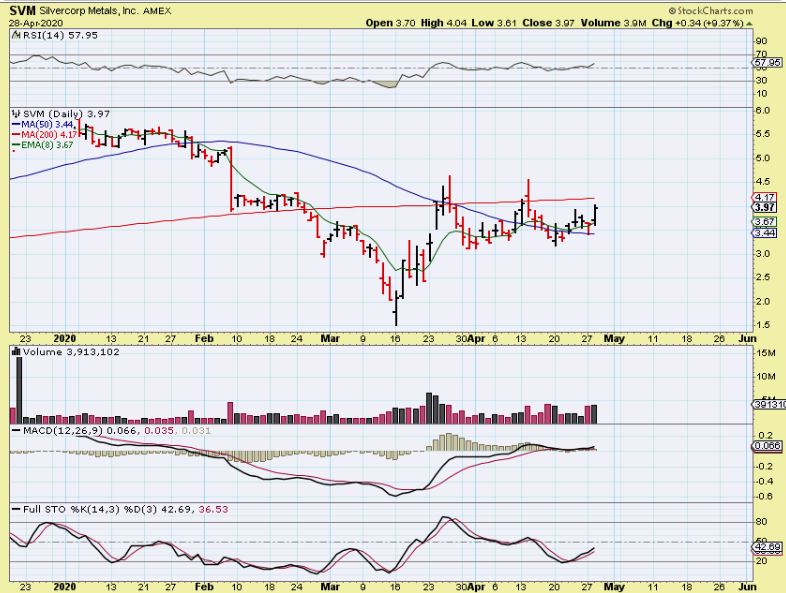
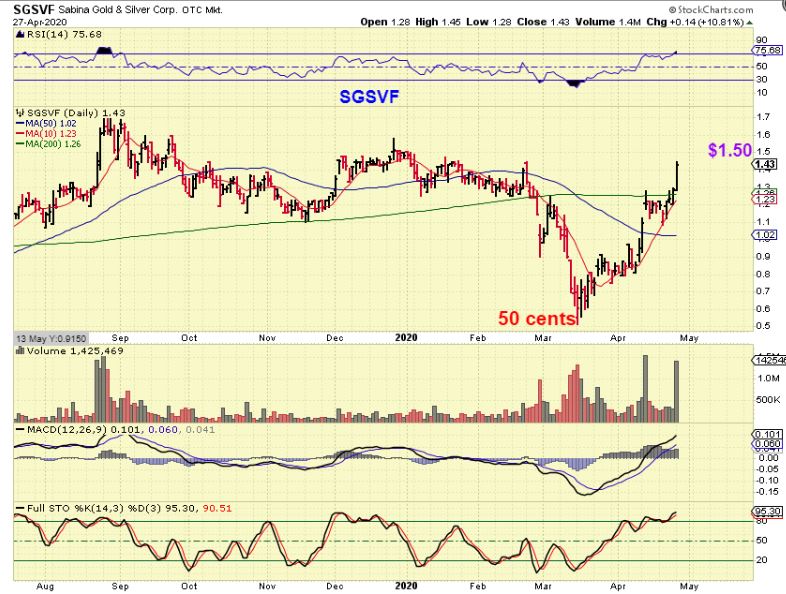
SVM – This sideways consolidation looks constructive. Price is above the 50 sma and the 200sma is overhead resistance, but that can easily be broken after a 1 month consolidation. This looks like a laggard, right? It is not near former highs yet. Well it ran up 200% in 8 days off of that low ($1.50-$4.50). This should run to $6 in time.
,
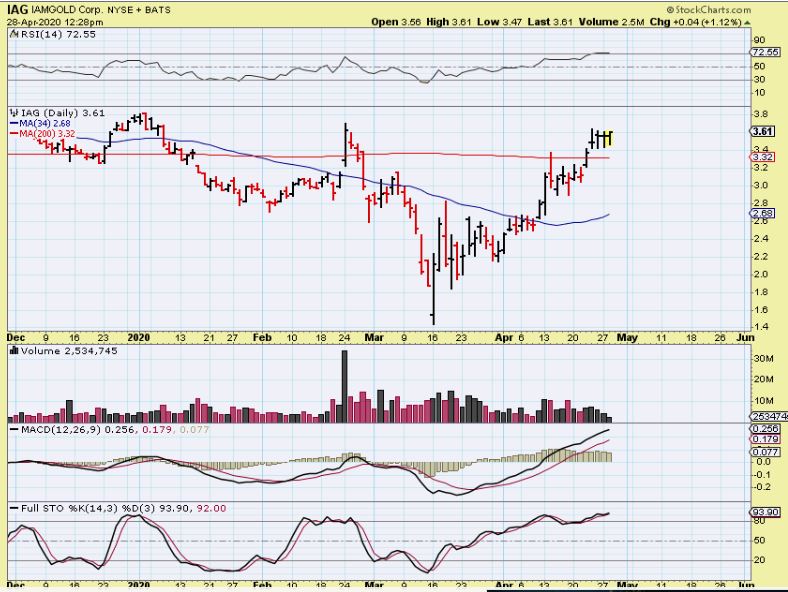
IAG looks like many other Miners (AUY, KGC, etc., including GDX & GDXJ). It is Bull flagging. The sector is bullishly set up, so I have already been saying, “If you are not invested or under-invested, you should be holding some miners.”
AS A REMINDER, YESTERDAYS REPORT INCLUDED THESE BULLISH DEVELOPMENTS:
.
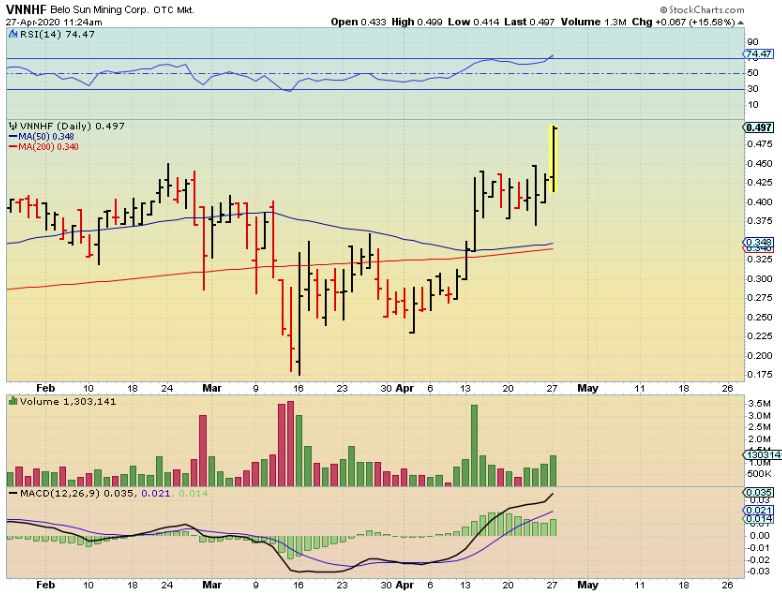
VNNHF – Like this, up 16% as it breaks from a sideways box consolidation or sort of a flag.
.
And SGSVF burst right through the 200 sma after crawling along under it.
.
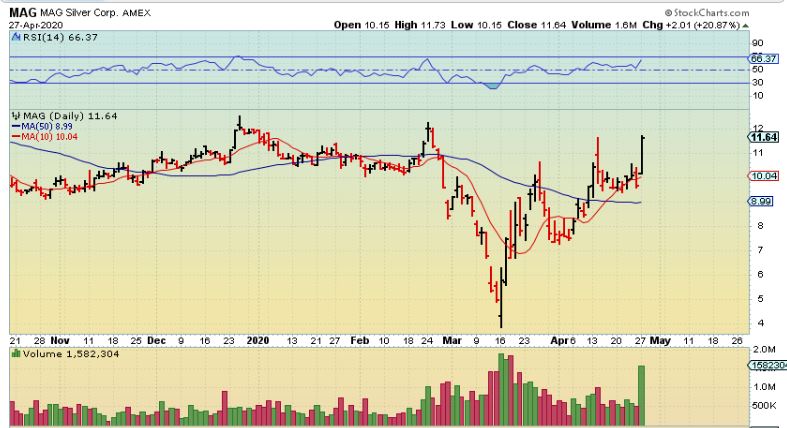
MAG jumped 20% Monday.
.
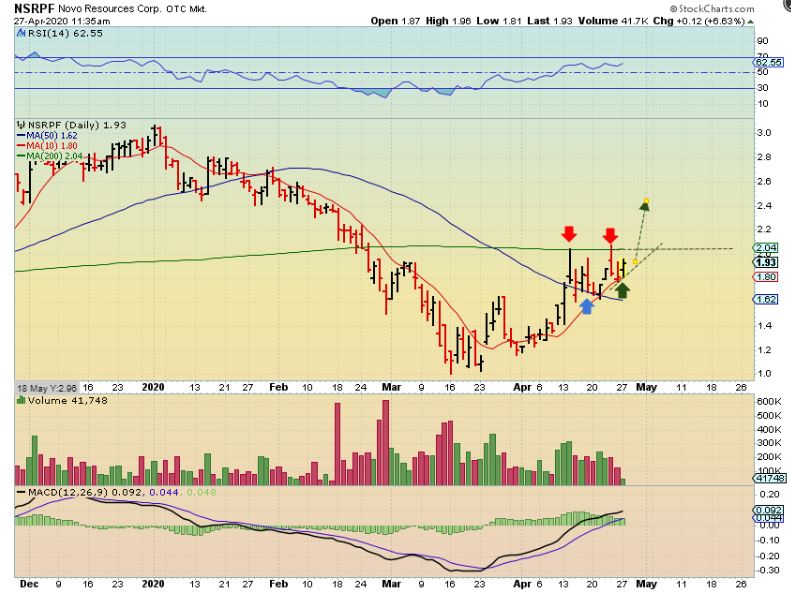
NSRPF is crawling along under the 200 sma and will probably end up doing what SGSVF did, because it is surrounded by support.
.
,
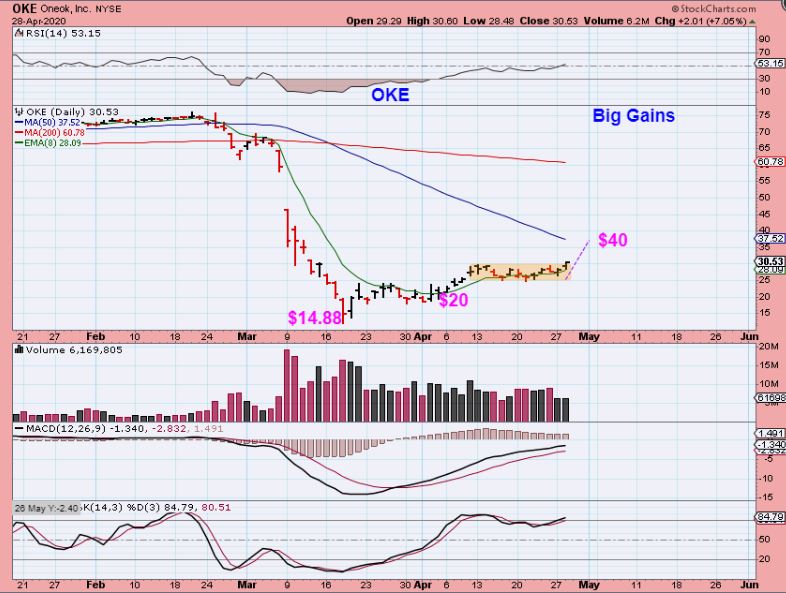
OKE is one of the Energy stocks that I traded. It already ran from $14.88 to $30 ( 100%). It was up 7% Tuesday and could be ready to run after a 2 week consolidation. We have discussed APA, MRO, XOM, BE, WTI, etc etc . They remain bullish.
.
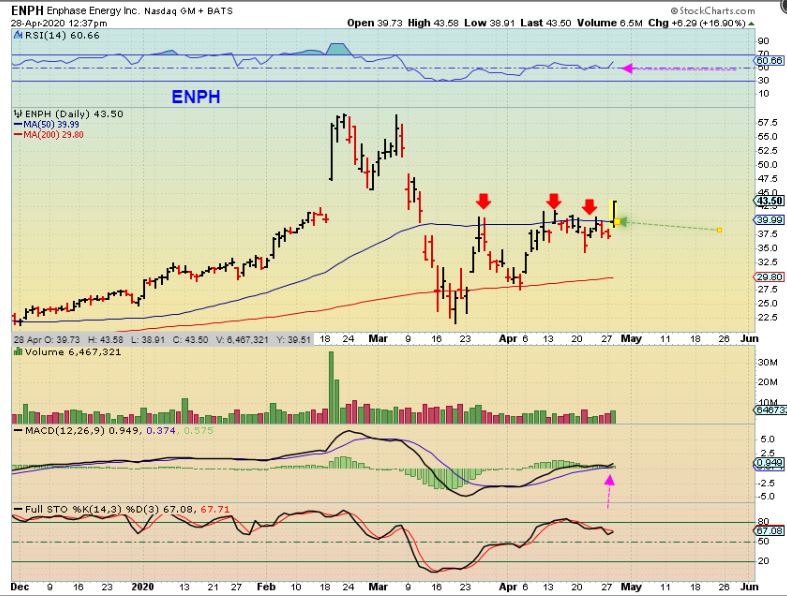
ENPH popped above the 50 sma and pulled back 50 cents from here to close at $43. This has been a very bullish stock that we’ve traded in the past, so this can be a buy. It got caught up in the market sell off, but it should run to the $60 area. You can place a stop at the 50sma.
.
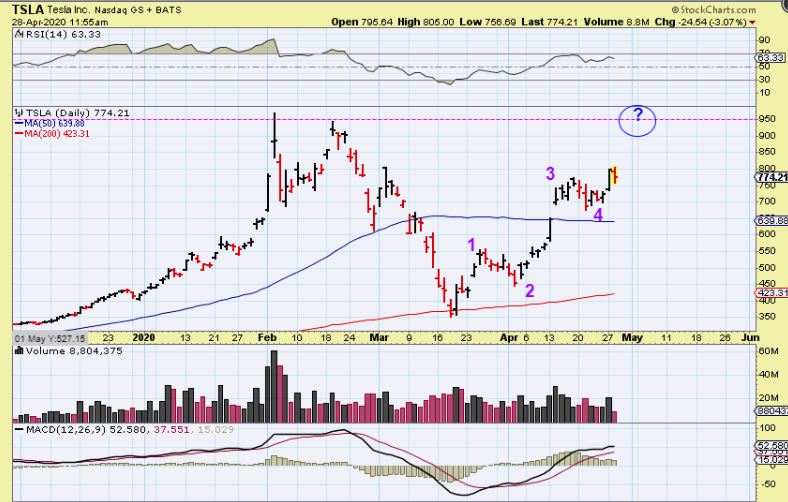
TSLA has been bullish out of the lows and it could run to the prior highs now ( or the next daily cycle). This may be a bit extended to buy here, and could follow the General Markets, so I wouldnt buy it before the fed mtg, but it often ran with NIO…
.
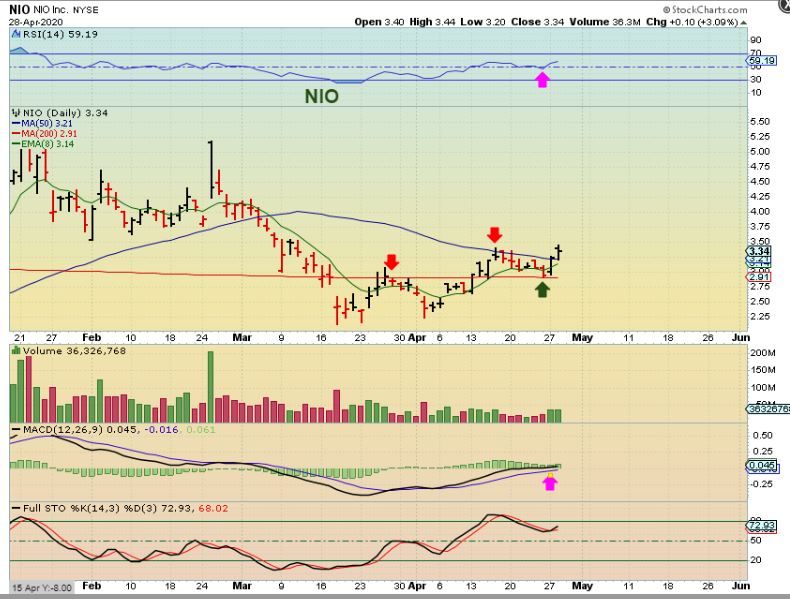
NIO also looks like it is bullish.
1. It crawled on the 200sma and then captured the 50 sma Tuesday, so that is a buy with a stop ( either a tight one at the 50 sma , or a loose one at the 200 sma).
2. It held support at the 200sma for 2 weeks, so it seems unlikely that it will break it now.
3. Volume is starting to increase on the move up here. It is a buy.
.
Things that we may not understand: I am a contrarian investor for sure. I love to buy when people are selling in bullish sectors, but what about this…
I hear that all the Cruise ships are docked and Airline flights have been empty, Airlines have cut the number of flights drastically, etc,. Normally, we just can’t see value in those stocks, Right? Well right now, the set up in these stocks is very bullish (at least for a bounce). Let me show you what I am looking at …
.
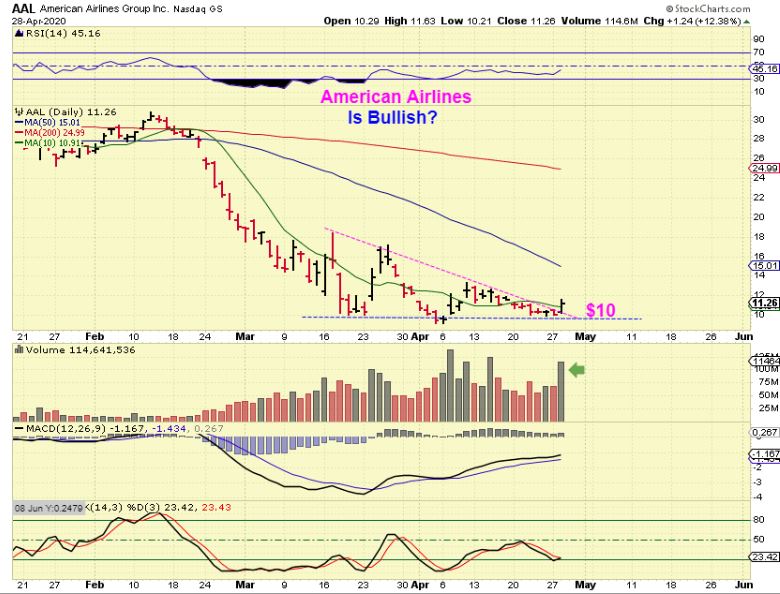
AAL is a descending wedge with high volume Pops and now it broke out on Tuesday, as the general markets sold off? This looks like a bullish base…
.
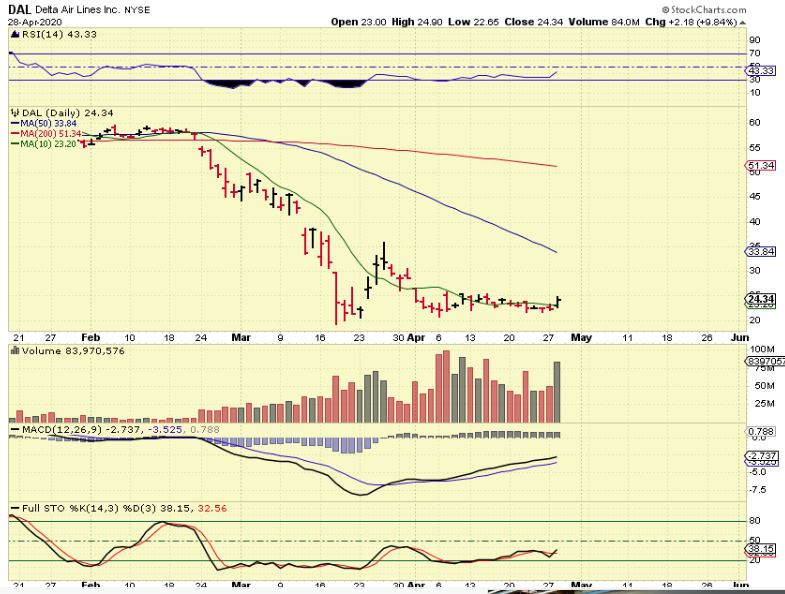
DAL (Delta Airlines) has a high volume pop out of a base, also on a day when the general markets gapped up and sold off.
,
CCL (Carnival Corp) – Keeps doubling off of the lows. The first one was likely ‘short covering’ and then it sold off ah=gain with capitulation. Now it has gone from roughly $8 to $15and is popping with volume again (on a day when the markets sold off).
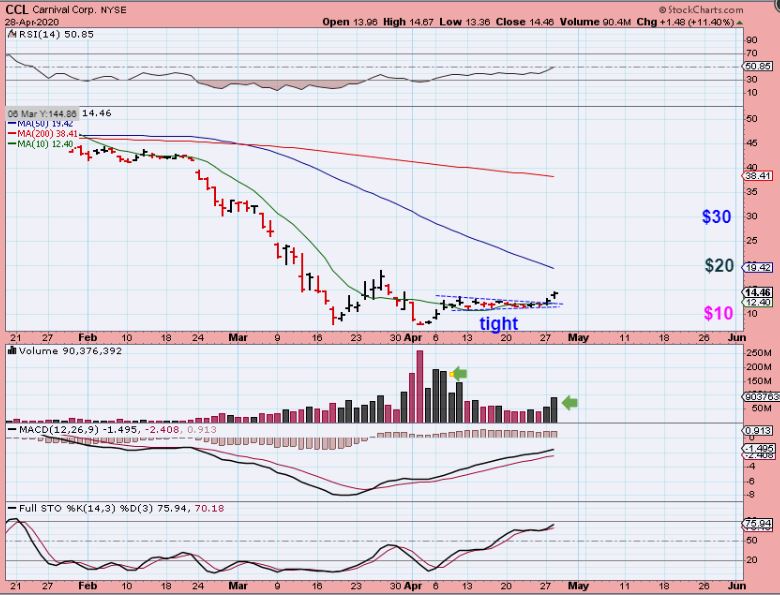
I’m personally not buying these, but I just wanted to point them out for a reason. This is a perfect example of when the markets do not do what one would expect them to do. It happens all – the – time. I buy a chart pattern at the lows in OIL STOCKS (and warned very one of the additional risks), while Oil was still dropping. The charts were bullish, and still many people warned me not too buy. They were kindly saying that they are ‘fundamentally a failure’. Yes, it would seem so, but for now the chart patterns are playing out perfectly. These stocks are doubling and tripling.
m

