
Thursday March 18 – Chasing Waterfalls?
I just want to start by saying that I took a couple of those trades in Miners yesterday, and by the end of the day it was like chasing waterfalls. When I bought the 2 Silver Miners that I liked ( SVM & HL), the trade immediately rewarded me, it looked pretty good! Then slowly it turned on me and became a loss. That movement is understandable, and I even explained that this could happen ahead of time, but the swings are pretty big and the ‘paper-cuts’ may be a bit deeper than expected. With that in mind, I do want to express a bit of caution again. I also want to discuss those 2 trades at the end of this report and as you’ll see, for some it may just be best to sit in cash and wait for the markets volatility to calm down.
.
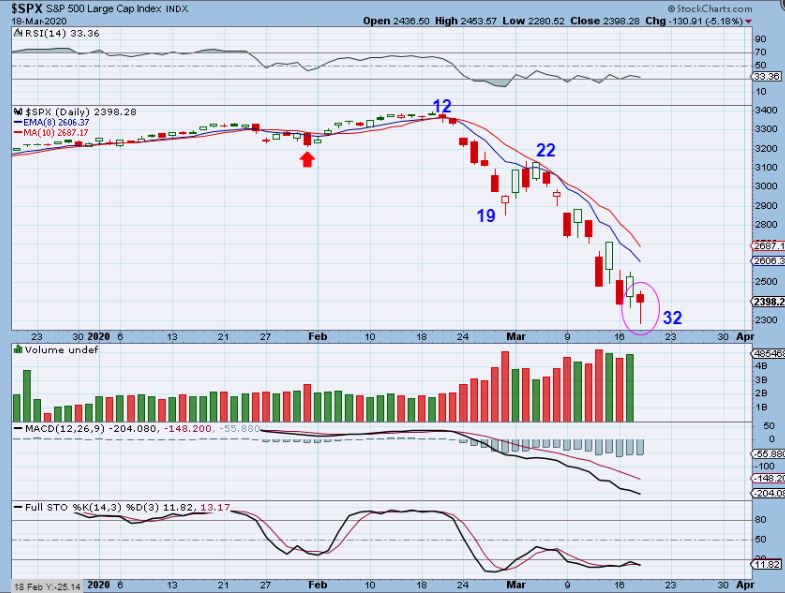
SPX – The Markets slammed down & triggered the breakers , shutting down trading again. When it resumed, the selling slowly dried up and we got a small bounce into the close. That makes this a day 32 low with a reversal candle so far. CAN THIS be a dcl? Yes, day 32 could be, but many of these have bounced & failed inder that 8 ema. For those buying every reversal, the paper-cuts would be getting a bit painful. EVENTUALLY one of these will stick, but it needs to get above that 10sma before we have more conviction that the lows are in for a dcl.
.
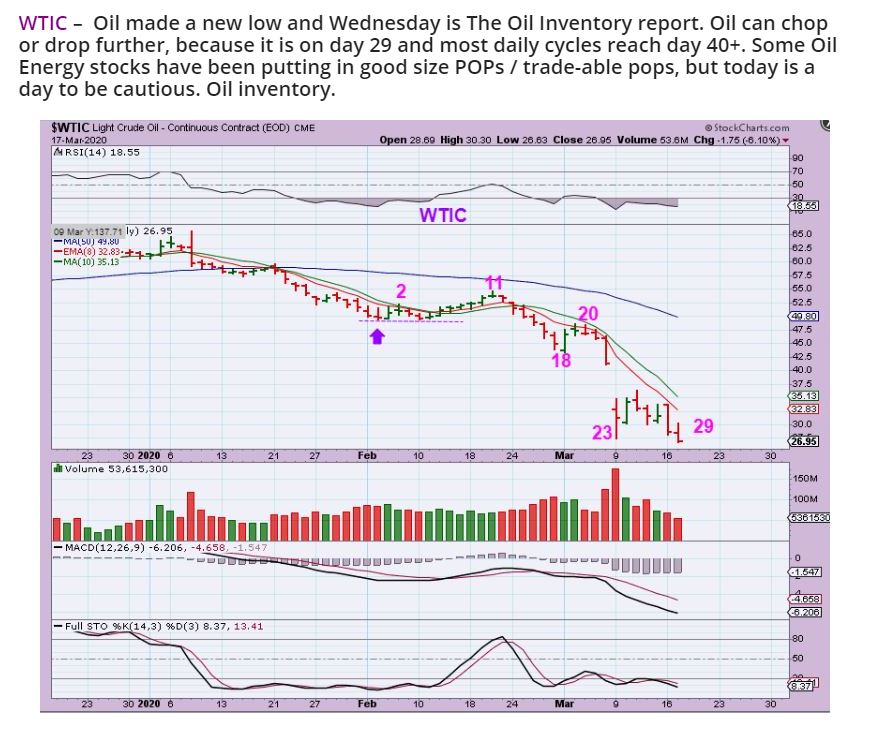
OIL , DAY 29, FROM WEDNESDAYS REPORT WITH THE OIL INVENTORY REPORT DUE OUT…
.
.
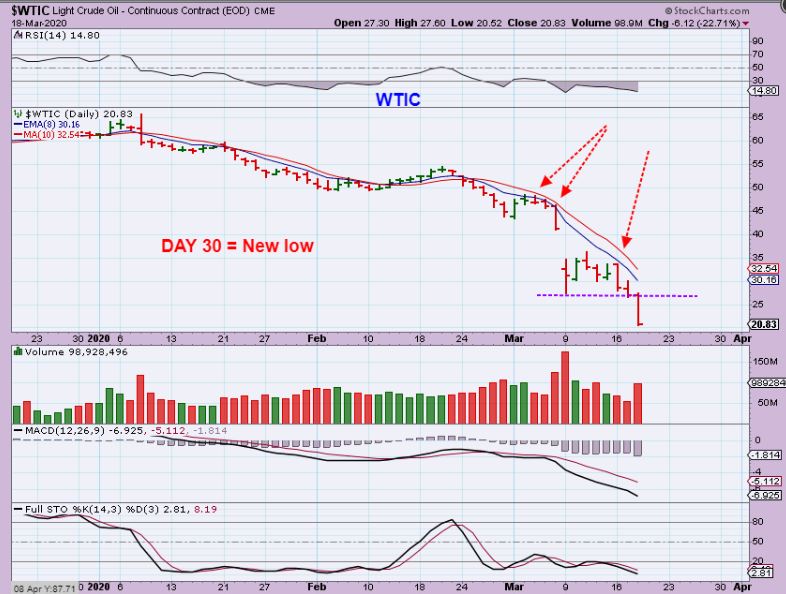
WTIC – Cautious indeed. Oil collapsed 23% on day 30! Oil is now down in the $20 range. It is interesting that WLL, OAS, TUSK, and others have not broken the lows with Oil, but I am not trading this sector anymore at this time. I made money in some of those large pops, but I also lost on a few too, as they started to just churn sideways. It is just too choppy for now, but they may be putting in the bottoming process.
,
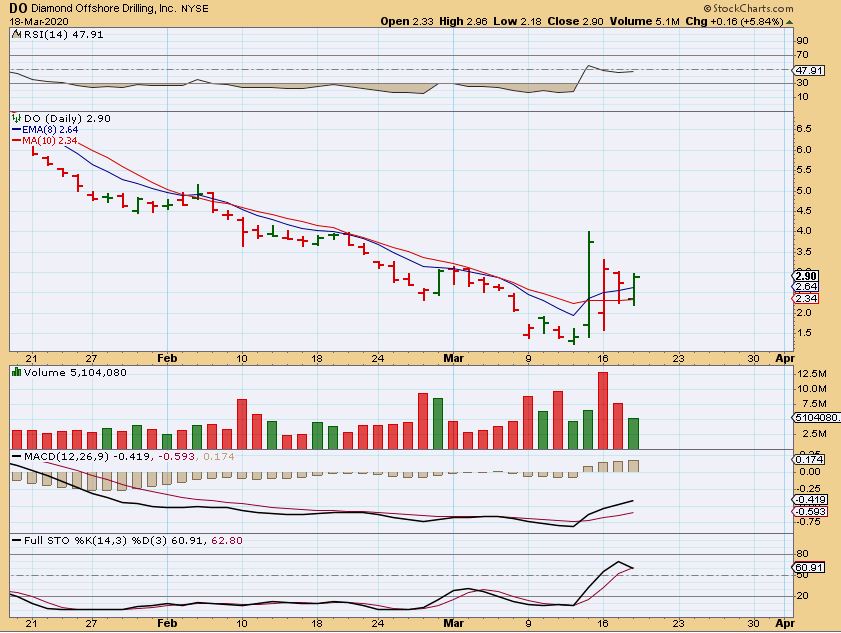
DO – You have to admit, this is very strange on a day when OIL crashed down 23%. I owned this 2 days of chop and sold it heading into the Wed Oil Report before the Pop 🙁 Like I said, I guess some of these stocks may be bottoming.
.
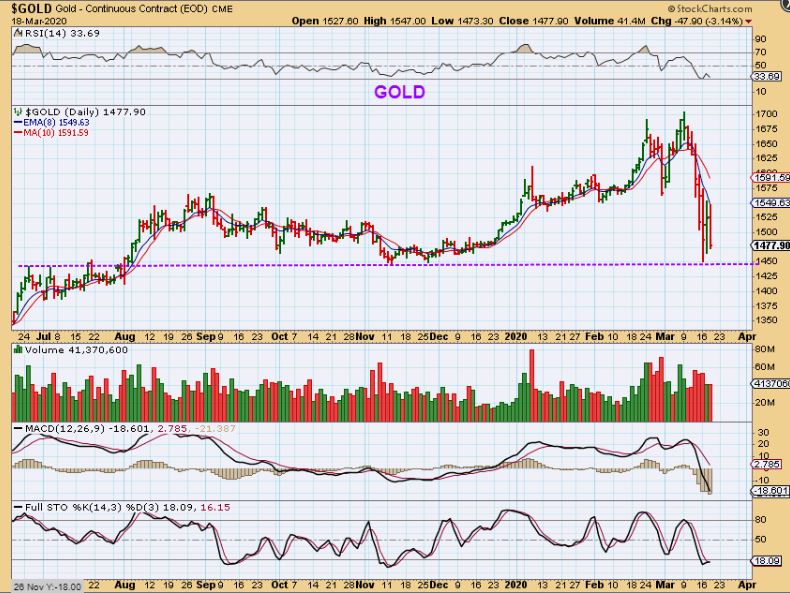
GOLD – GOLD dropped after tagging the 8 ema. That 8 ema or 10 sma is acting like a barrier on many of the Miners too. This looks like a day 27 low and this would be day 29 if it breaks to new lows on day 30 or more.
.
This is how fast things can change WITH OUR MINERS.
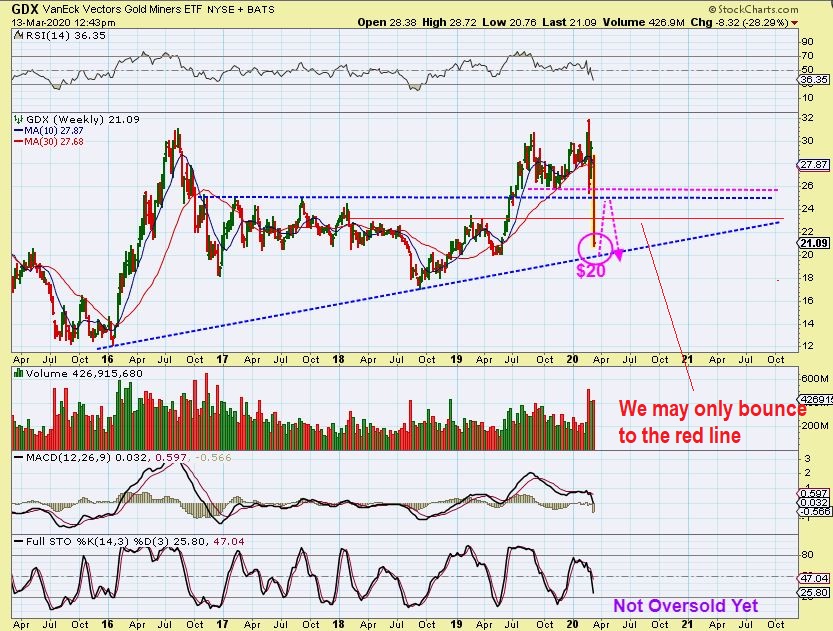
On March 13 – Before the extreme moves in GDX & GDXJ, I was thinking that we could get a bounce to the $25 / $26 area, and then roll over with a double bottom or a deeper break down.
.
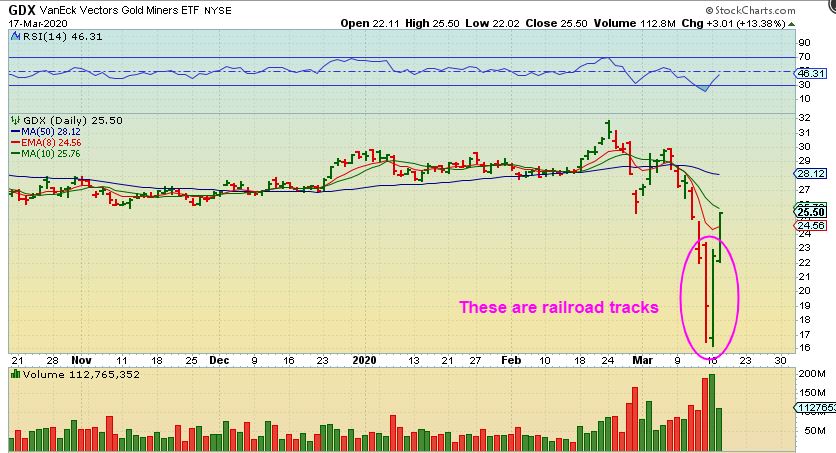
We bounced and tagged that $25.50 area in 2 days?? THAT is NOT what I expected, this movement is pretty extreme. So I saw R.R. Tracks and the entire drop was almost ‘undone’, and I wanted to explain the R.R. Track candles in case we broke above that 10 sma & just kept going higher. Lets review…
.
So yesterday I discussed RailRoad Tracks. They usually indicate that a low is in place, but here it can be tricky to try to enter position, since it is so far off of the lows, and even a normal pull back can be deep. You would ( should) Start small and you can add on a break out or pull back if it continues to act correctly. THIS IS WHAT I WROTE FOR THE NEXT 3 CHARTS IN YESTERDAYS REPORT…
.
GDX R.R. TRACKS – I am seeing RailRoad Tracks in GDX & GDXJ (Not in all individual Miners, but that is fine). Now let me show you something even more amazing…
,
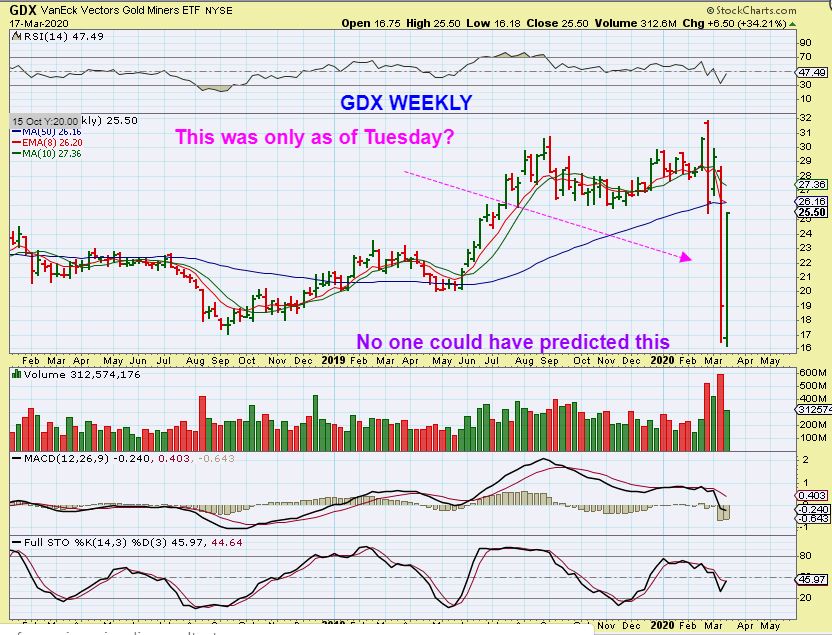
GDX WEEKLY – I have NEVER seen R.R.Tracks as extreme as THIS on a weekly chart! Note: This was only as of Tuesday, so it could change.
.
NOW we see GDX ran from $16 to $25 in 2 days?? What? The trick is trying to figure out a way to get in if you weren’t inclined to buy that reversal as a trader.
,
.
So GDX & GDXJ were now at their 10sma, and we look for a break out above the 10 sma to get further confirmation of a dcl in place. Did price break through?
.
NO- GDX did not break above that 10sma. Price gapped down and then started to head toward that 10sma ( And other Miners broke through their 10sma, so I did think we were breaking out ‘real time’). That is when I took on some trades, but things started to sell down, so I grabbed a Fib chart Midday to look for possible locations of support. We could drop & bounce on one of these as shown…
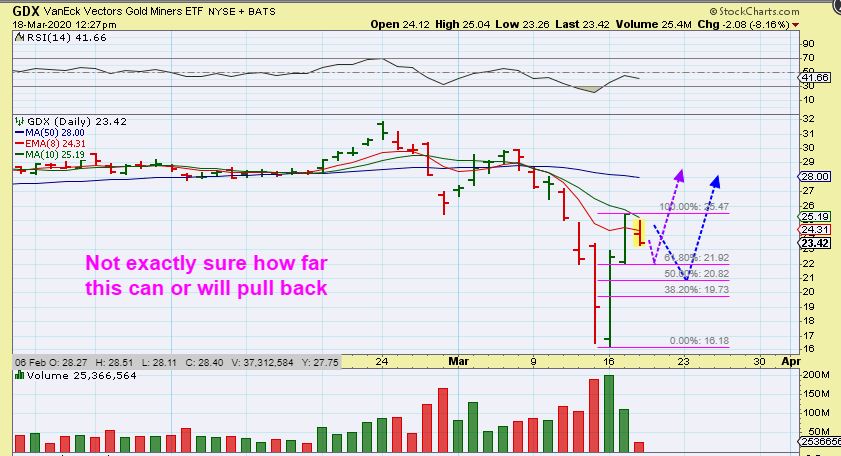
,
By the final hour of trading, we reached that 38.2% line, so I put the Numbers to the left so we can keep track of the Fib Numbers. Notice that $19.75 is the deeper fib number at 61.8%. I drew this as though a 3 day pull back might get us there…
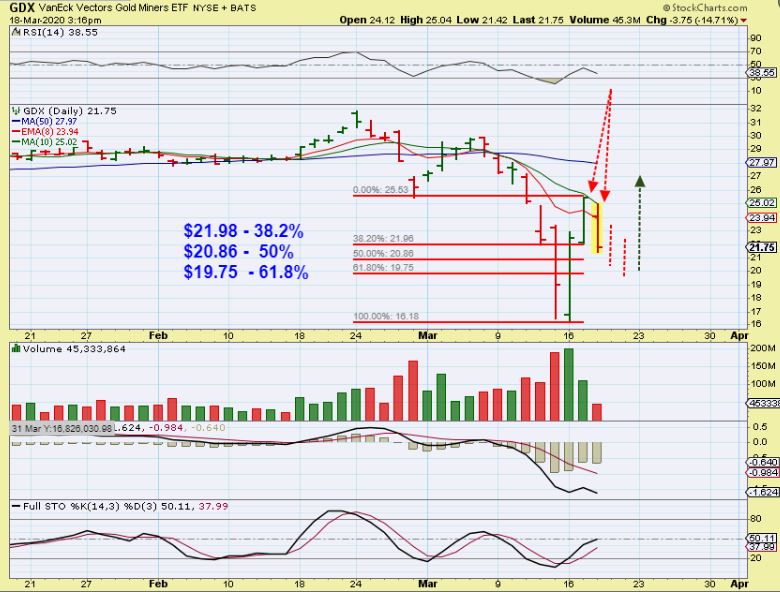
By the close, we were there. NOTE: That is a deep 22% drop, so GDX is now moving like JNUG used to, right? THIS IS WHY I AM WANTING TO THROW CAUTION OUT THERE…
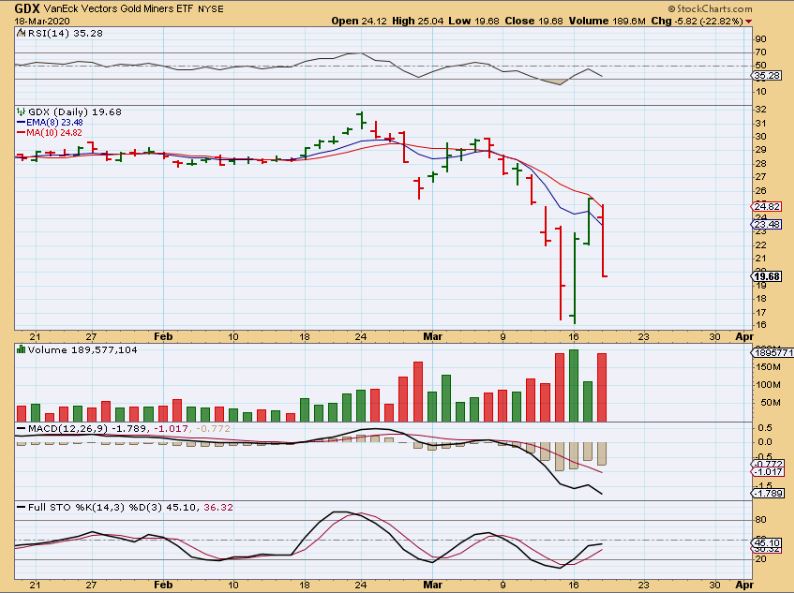
.
Since GDX dropped 22% and GDXJ dropped 25% yesterday alone, These are basically now moving faster than JNUG used to! I AM WANTING TO THROW CAUTION OUT THERE FOR THAT REASON. These aren’t just ‘paper-cuts’ if you get the entry wrong, and they especially aren’t just ‘paper-cuts’ if you aren’t careful about position size. These innocent little positions are suddenly like riding the waterfalls. So I have to say that if you want to own Miners you really may want to start by keeping it small (And I will show you my 2 trades below that went against me).
.
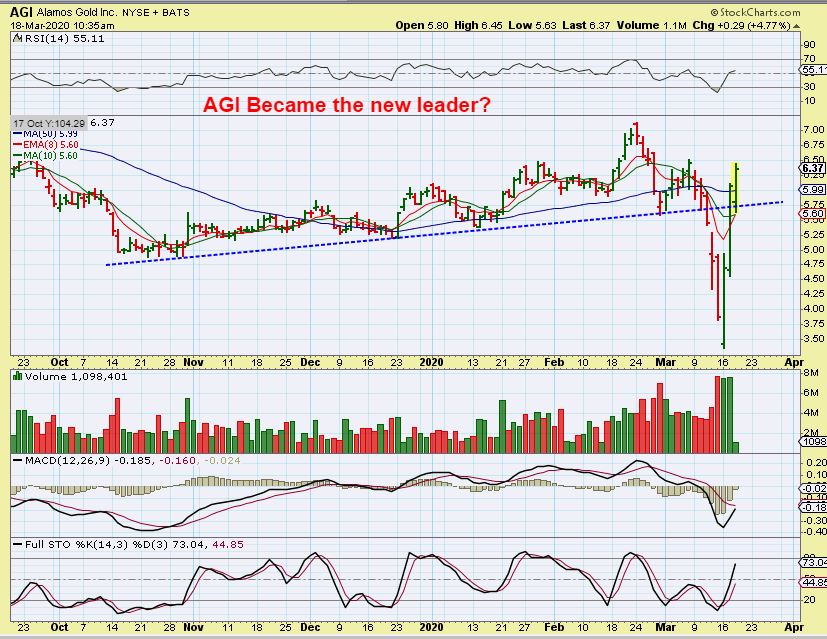
When I saw the R.R.Tracks, I was rather excited at what it could mean. It could mean that we have our lows in place, and it could mean that we would break right through that 10sma & keep running. WHAT I HAD IN MY MIND WAS THIS LEADER, AGI.
.
AGI – I was thinking that GDX & GDXJ MIGHT do something like AGI did- just a V-Bottom that runs and breaks back to prior levels. THIS IS OBVIOUSLY A VERY FAST & BULLISH RECOVERY. Well, GDX & GDXJ did not get through that 10 sma yet, so we may have to endure some more choppiness.
For some, this choppiness is still tough to ride. It may just be best to still sit in cash and watch the action, and we’ll discuss entry points when we get a confirmed dcl. As for me, I have traded Oil/Energy, some Biotech, and Miners in recent weeks. The results? It was a lot of work and minimal gains when you add the good runs together with the choppiness and losses. I even bought USLV just in case we were going to see a fast recovery in Silver. I was stopped out for a loss yesterday on that one too. So sometimes even good looking set ups in choppy markets can become like chasing waterfalls. If you trade, Use stops, Keep it small, or wait patiently mostly in cash. Cash is safe, you can’t damage your account sitting in cash. That has been the current mantra under these conditions. Enjoy your Thursday !
.
~ALEX
.
.
When I saw the RailRoad tracks pattern in GDX, and especially on that weekly chart, it looked very powerful. As mentioned above, I anticipated a break of the 10sma, similar to what AGI was doing. so…
SVM – I already had a Very Small position in SVM, and as it broke that 10sma I bought more & posted this chart when it was at $3.00. Now I had a pretty good size position and lets just say that the avg cost was $2.90. This looked good, like it could run right to that 50sma. IT RAN TO $3.30 FROM HERE! WOOOHOOO!
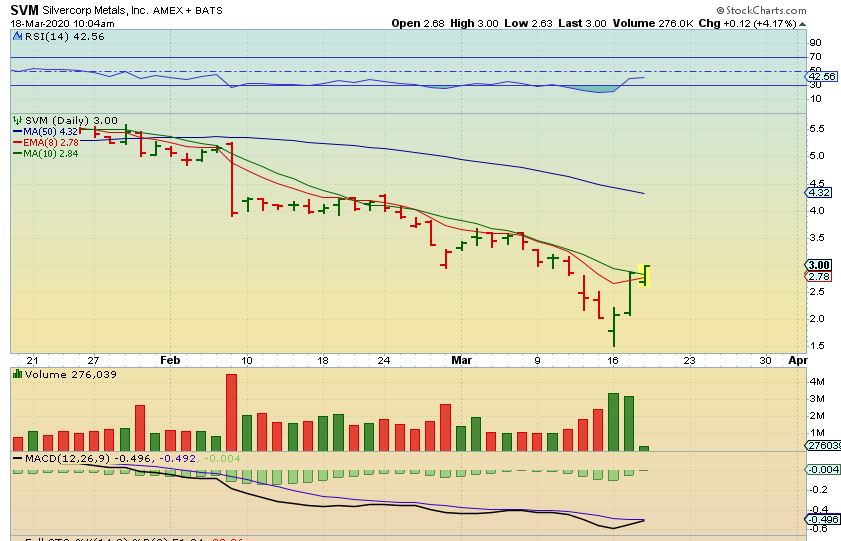
l
SVM – And then it dropped from $3.30 to close at $2.54?? Look at the chart and this looks fine, but dropping from a high of $3.30 to $2.50 is a BIG drop. That is a 25% drop from the highs or 80 cents a share. Since price was near the 10sma, I didn’t sell, so I took that big ride. NOW it shows up as a reversal candle. Can this drop back to the lows as drawn? It could. Let me show you something…
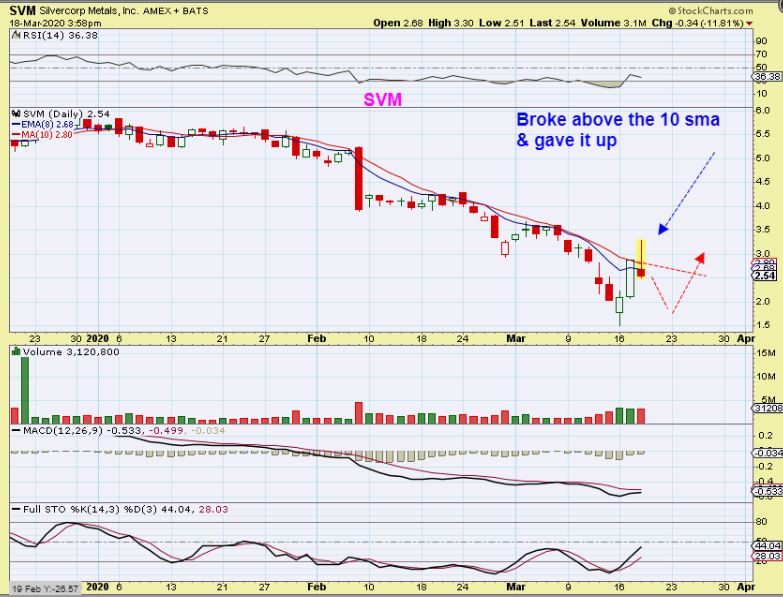
l
SVM – I Noticed that Back in November 2018 SVM ran to the 8 ema & 10sma out of the lows, but in a reversal candle similar to what I see today, and dropped BACK to the lows. On the current set up for SVM, because it already doubled off of the lows, it would be too big of a drop to ride out with a full position. That would be $3 to $1.50 – so what is my point?…
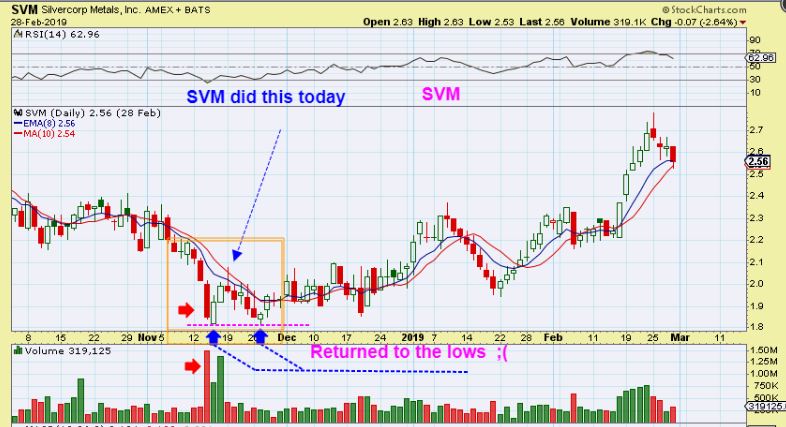
So what is my point?… Even the Individual Miners are trading like JNUG now. These make Great moves on the way up, and SVM doubled off of the lows in 2 days, but it also pulled back 25% off of todays highs. It can be a rough ride when they chop around and pull back.
,
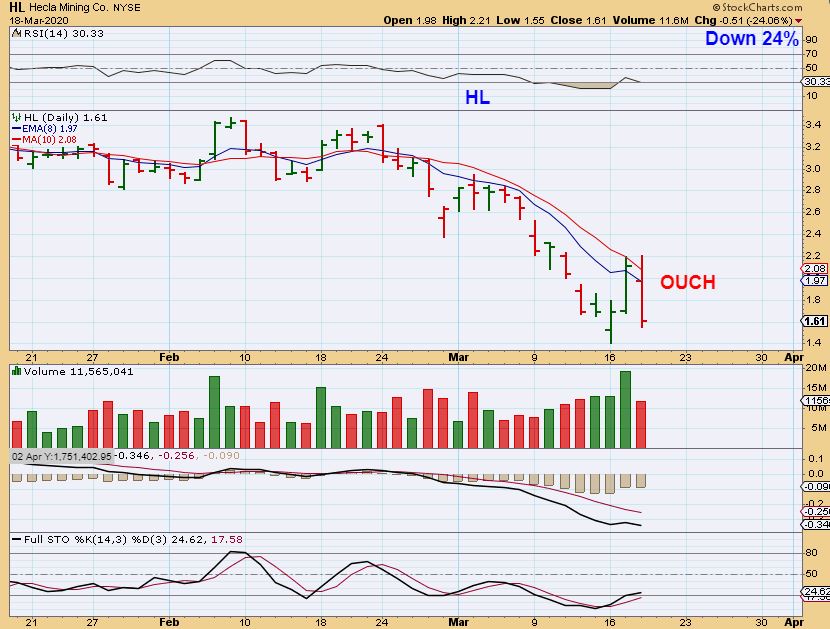
HL – I grabbed this chart 1/2 hour into trading, and it also started to break through the 8 ema & 10sma. I bought it, and I even wrote in the comments section that it is wiser to wait for the close, to make sure that it closes above, but these move so fast, I wanted to just get position.
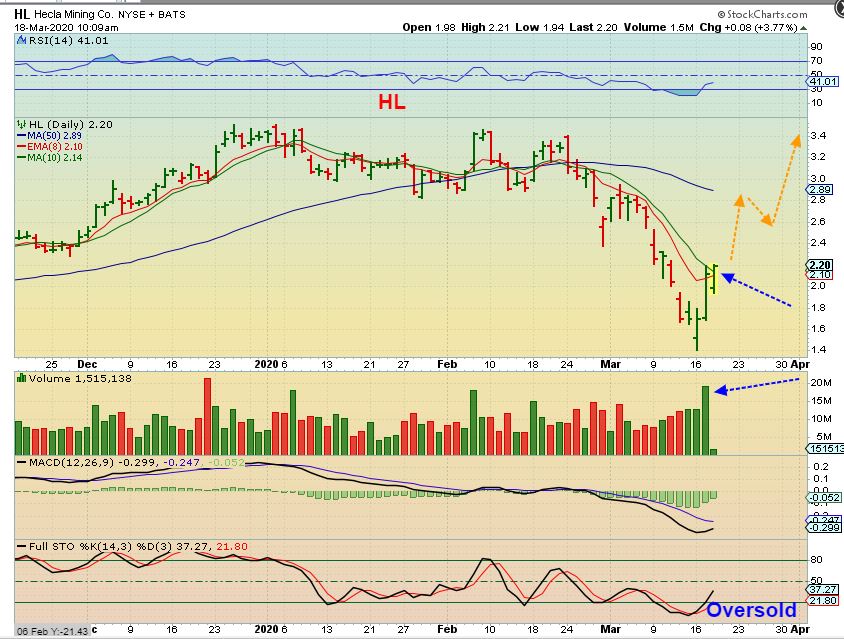
,
HL – WHAT? That looks like an entirely different chart with THAT close. HL broke above the 8ema & 10sma, but then it gradually dropped back below them. By Midday it was at $1.90 and I was ok with that, but by the close it was at $1.60.
.
CONCLUSION ON MINERS : THE MINERS CAN MAKE BIG MOVES UP OFF OF THE LOWS, BUT THEY ARE CHOPPY AND THAT CAN STILL INCLUDE PRETTY BIG PULL BACKS PERCENTAGE-WISE.
.
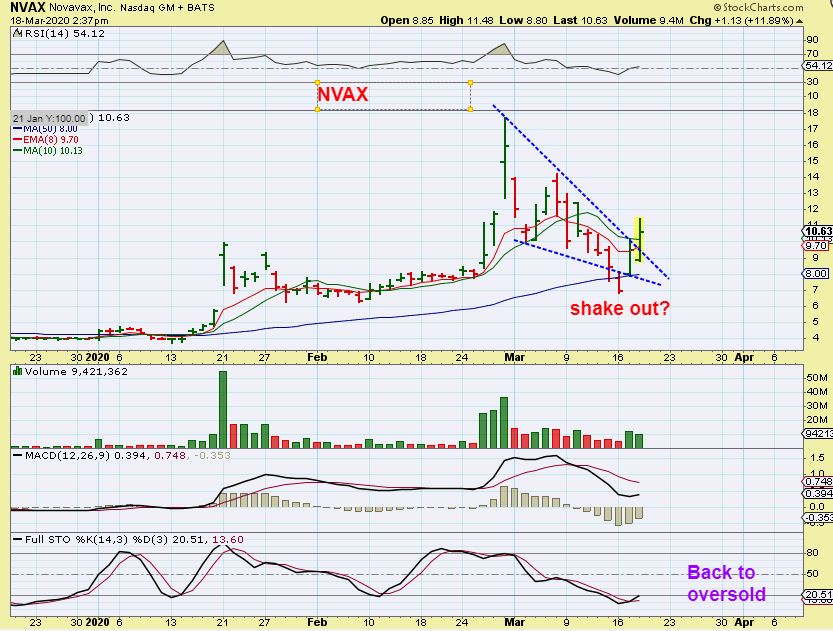
SIDENOTE: NVAX is another FAST mover, but it is a biotech company searching for a vaccine for the coronavirus. I traded it successfully in late Feb. Recently it did a shake out below the 50sma & recovered. That was a buy. Now it also broke a downtrend and FAST TRADERS or DAY-TRADERS may want to scalp it. This could run to the recent highs again, but again, this is another Big Mover and not for the low risk trader.
,

