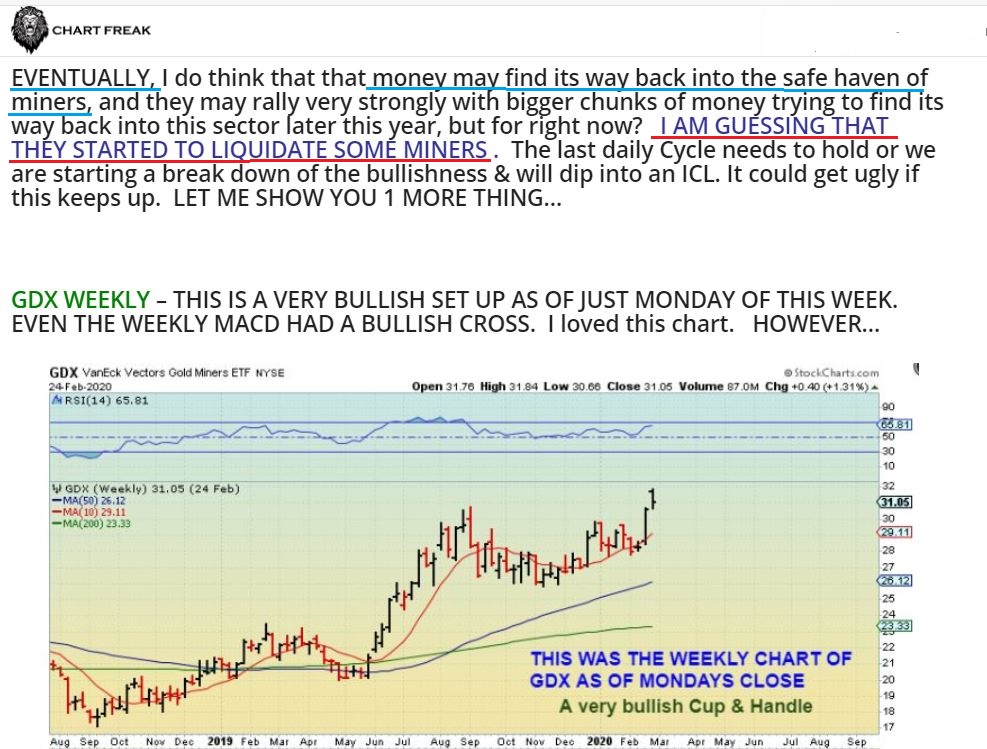
February 29th Weekend Report – The Liquidation Sale
Well, what a week this turned out to be! I can say in part that we were expecting the sell off in the General Market, and possibly a Big one into an ICL, but what happened this week was an absolute flush. I didn’t go short, because I wanted to short the bounce, so I will discuss that further.
I can also say that we really did expect a ‘dip’ in the Precious metals, because we had a ‘peak’ on day 27 with black reversal candles, HOWEVER, we also had very bullish charts. So to be honest, as of Monday I expected a normal pullback into a dcl, maybe forming a low near day 32/33 next week. What we got, unfortunately, was a contagous Flush on Friday, and it formed what I’m just going to call – “Broken Charts”. It DOES NOT end the Bull in Precious Metals, but from what I see in these ‘broken charts’, it may prolong the agony.
I would LOVE to just keep this report simple and easy to understand, and expound on things as we go forward from here, but I also want my readers to understand my expectations going forward too. SOME THINGS HAVE CHANGED. So Let me explain the changes, and I promise that I will continue to elaborate in the daily reports as things unfold…
.
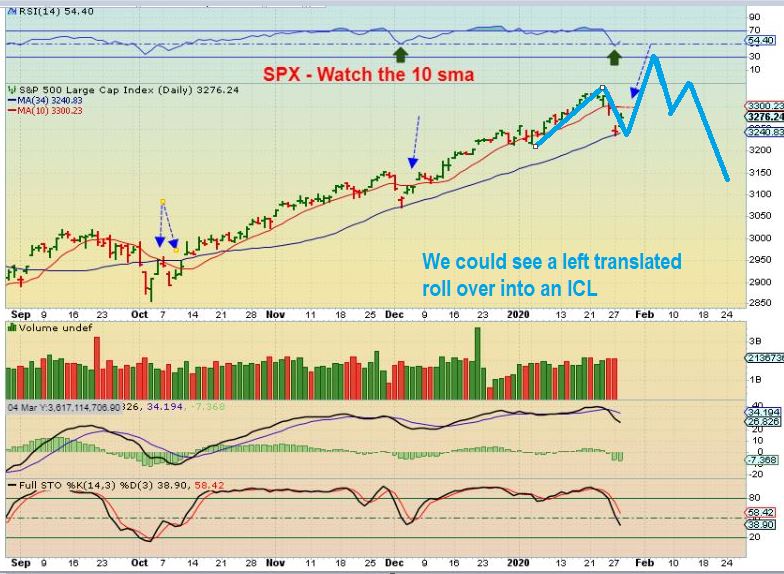
S & P 500 – As we dipped down in January, I drew this expectation as 1 of 2 main thoughts.
1. Either this rallied out of the lows & we get a blow off top melt up move, or
2. (As seen here) we make new highs, & roll over early. This would be left translated, and we’d begin a big drop to an ICL (deep low).
.
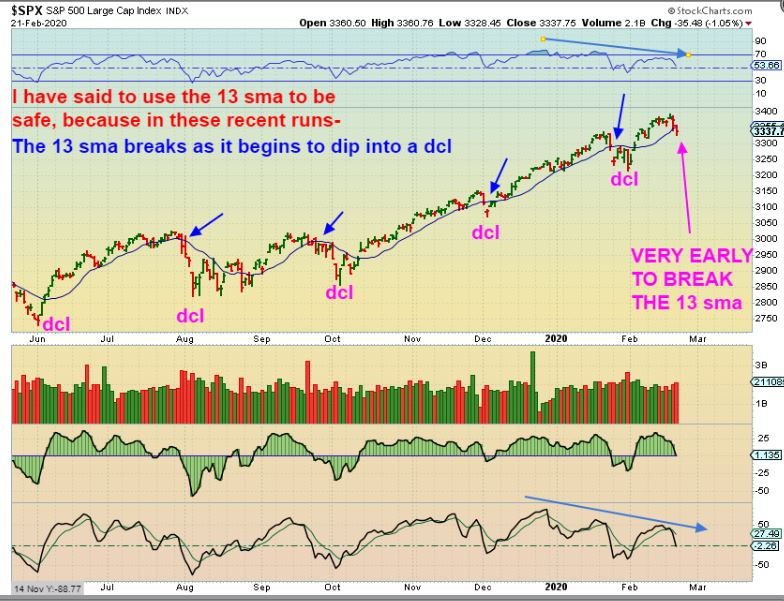
SPX FEB 21 – I got the sell signal whn we closed below the 13 sma, something that has recently led to a drop into a dcl. Since this was L.T., It could drop a lot much further than past drops. It was too early in the cycle for this action, so I mentioned for many weeks that this was our stop. I expected to see a drop like the chart above, but…
n
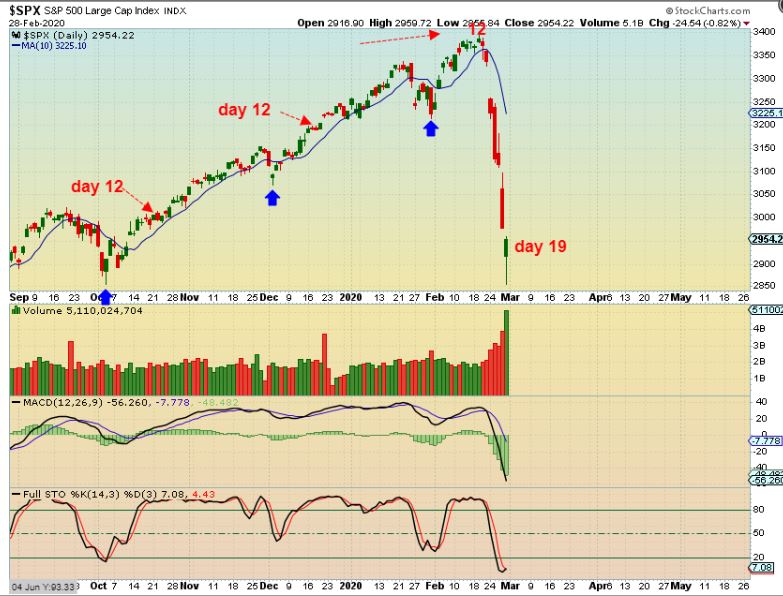
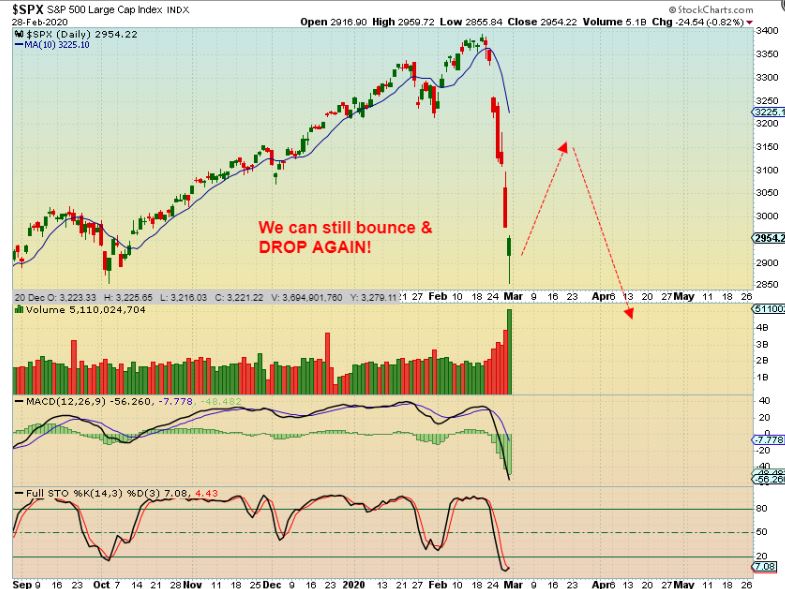
SPX – The flush selling caused everyone to head for the exits at once. THIS IS A BROKEN CHART in my opinion, but it can have a large bounce at any time. People have asked me if this is the ICL happening all at once, and can we go leveraged long. Is this a flash drop to an ICL? I’d have to say No, this is probably not the ICL. Let’s discuss this…
n
SPX – It is only day 19. 5 Months of gains wash away in 5 days! Past cycles have had 30-40 days, and we can get that in this daily cycle too, so in my eyes this can bounce, but…
m
SPX – I think we will get a large bounce, and it may draw in the Bulls for another slaughter. IF You go long, use a stop all the way up. If it rips higher to new bull highs, that would work out, but I think it rolls over. I wanted to short the bounce and I still may do that ( as a short term trader, I may go long & then short too), but you will see how I feel about this when we get to the big picture charts.
m
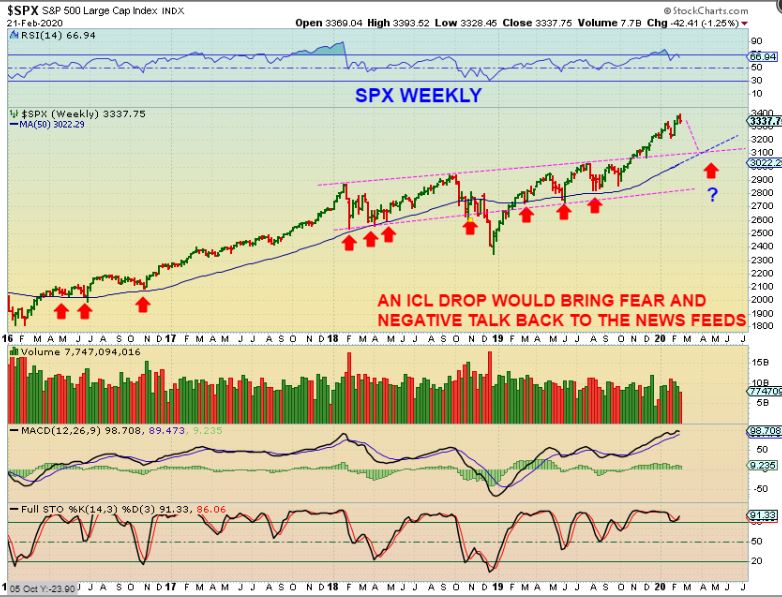
SPX – Just last week I said in my Big Picture Weekend Report that I would look for this back test of the channel at our next dcl/ ICL for this to remain Bullish. It could be a simple ‘back test’ of the recent break out & ramp up. ARE WE NOW CLOSING IN ON THIS LINE?…
,
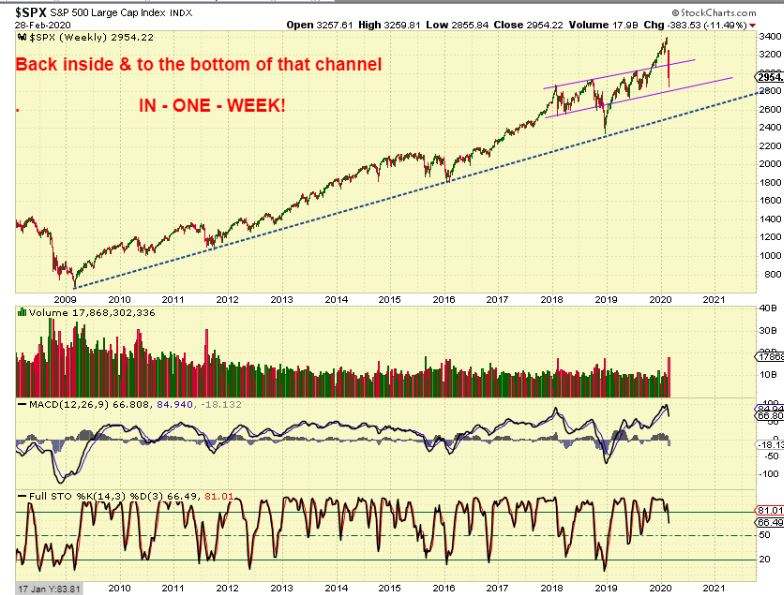
SPX WEEKLY – DO YOU SEE WHAT I MEAN? This Crash was huge & this pattern is a broken chart. Only 5 days later and we are trading near the inside lower channel line already? And only on day 14 of a new daily cycle? Now let me show you how I view this newly broken chart…
,
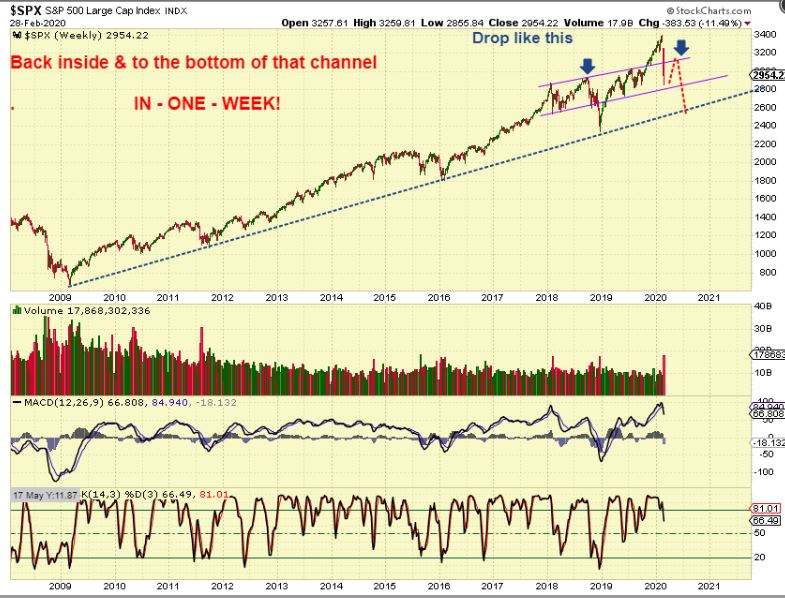
SPX WEEKLY – That would be my bounce, and the bulls will get very bullish, and then the drop could happen just as swiftly & unexpectedly as this last one. Stay Frosty if you go long the bounce. Note : The next drop could be similar to the blue arrow in 2018. That could then be an ICL, so…
.
A drop to this blue line could be an ICL, so does this mean that the uptrend then begins again later this year? Maybe, but I am leaning to this being ‘The Top’ forming. Why?…
.
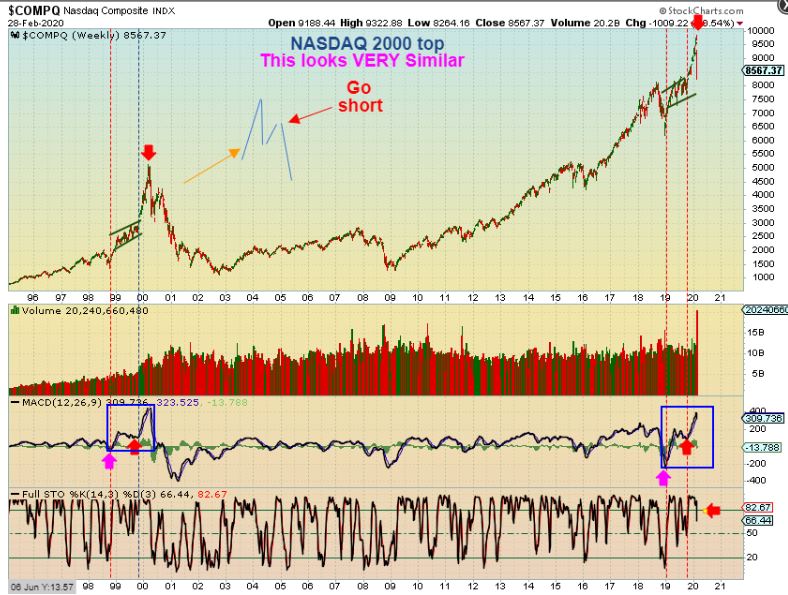
NASDAQ 2000 TOP SIMILARITIES – If you have been with me for a while, you know that I have been comparing the 2000 top to our current rally. AMONG OTHER THINGS, this top & drop looks much like 2000. What came next was a bounce and the real panic selling continued as EVERYONE ran for the exits again.
.
NASDAQ 2000 TOP SIMILARITIES – Look at the MACD then and now. I was trading Tech stocks like EMC, NTAP, JDSU, SCMR, and so on in 1999. I made great money as my stocks doubled & tripled. I got caught in the first drop. The bounce then made me think that it was just a fluke. I eventually started to get caught in the 2nd drop too ( I was new to trading & still learning). Some of those stocks eventually went from $120 to $8 over time. I sold many near maybe $30-$40 before I realized that something was happening that I wasn’t understanding. I then switched to GOLD & Miners later ( I’ll never forget it, My first buy was HL at 90 cents & I was hooked from then on 🙂 I bought BGO (now bought out) GG (now bought out) and a few others and slowly made my money back, but that was a very very difficult time of schooling for me. A GREAT learning lesson for the future though.
ON TWITTER, I ALREADY SEE PEOPLE CALLING A BULL LOW, AND SAYING THAT A ‘RIP YOUR FACE OFF RALLY’ TO NEW HIGHS IS COMING. Like I said, I will cover the markets in my daily reports. I am a short term trader as well as an investor, so I may play the bounce, BUT THESE THOUGHTS ABOVE are the things that will keep me on my toes. My stops will be in place, emotions & Bias aside, and I may even decide to short that bounce if I see things playing out the way I have outlined it here. You will see what I am seeing in my day to day reports.
.
USD – We have seen the USD and Gold act inverse and we have seen them run together, so I am less concerned about the USD, but let’s take a look at the big picture here. You can see an up sloping channel, so as the USD ran higher- we also know that Gold was at the highs this week. They also both dropped this week…
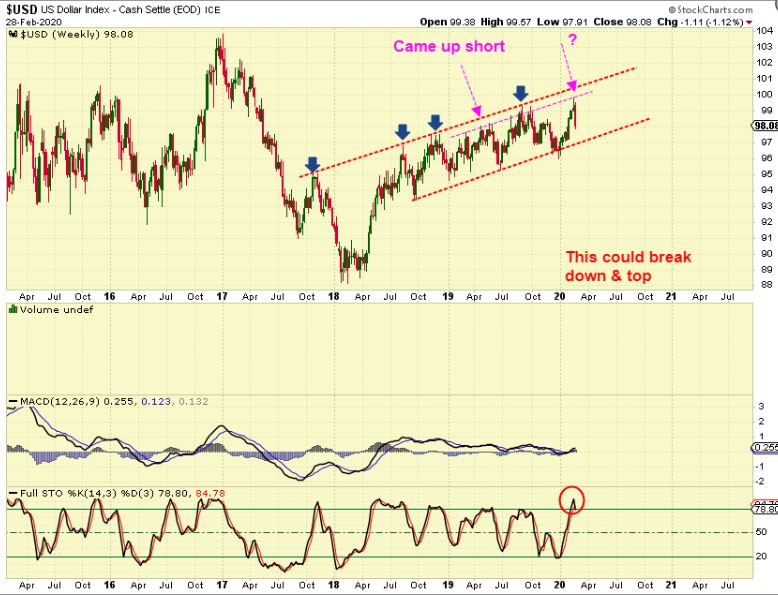
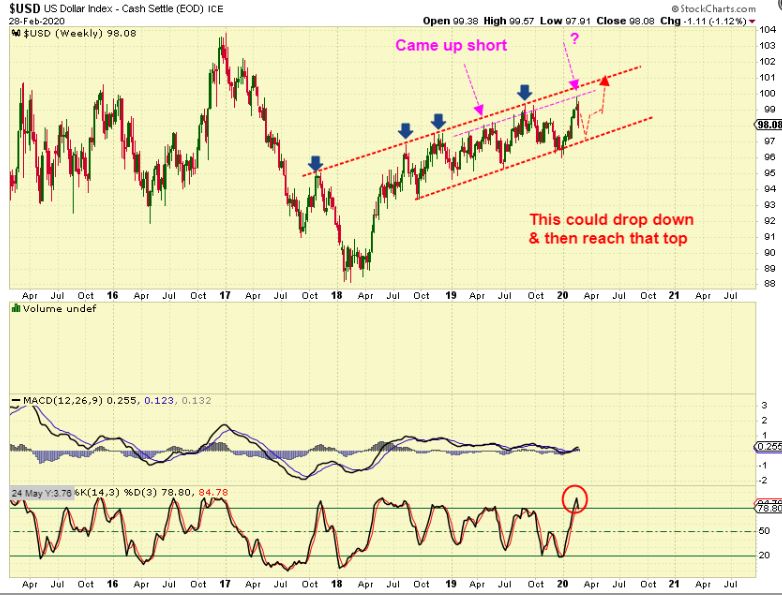
USD – So we see that occasionally the USD did not make it to the top channel line in 2019, and it didn’t make it this time either, before dropping down. It can drop to the lower line & then try again as shown, or…
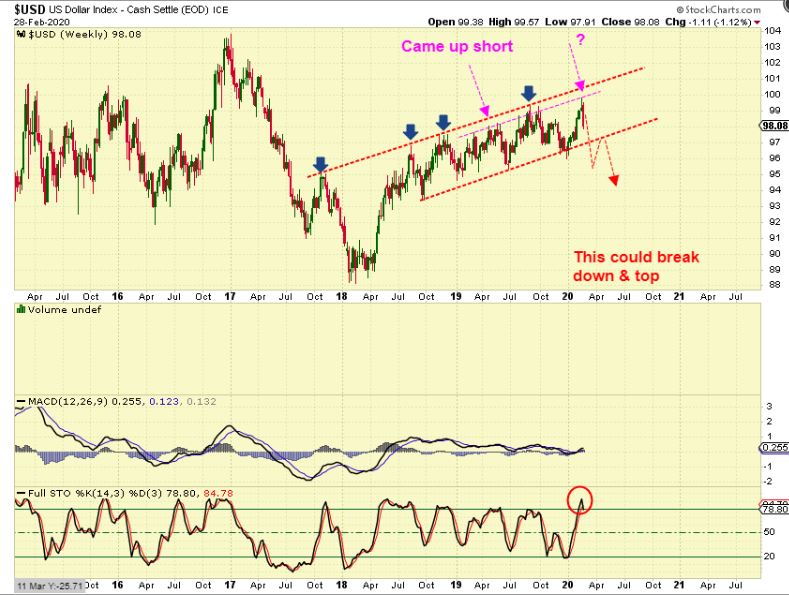
USD – Maybe we will finally see it break down with proposed Rate Cuts by the Fed? Time will tell, it is overbought on this weekly chart, but an uptrend remains in place for now.
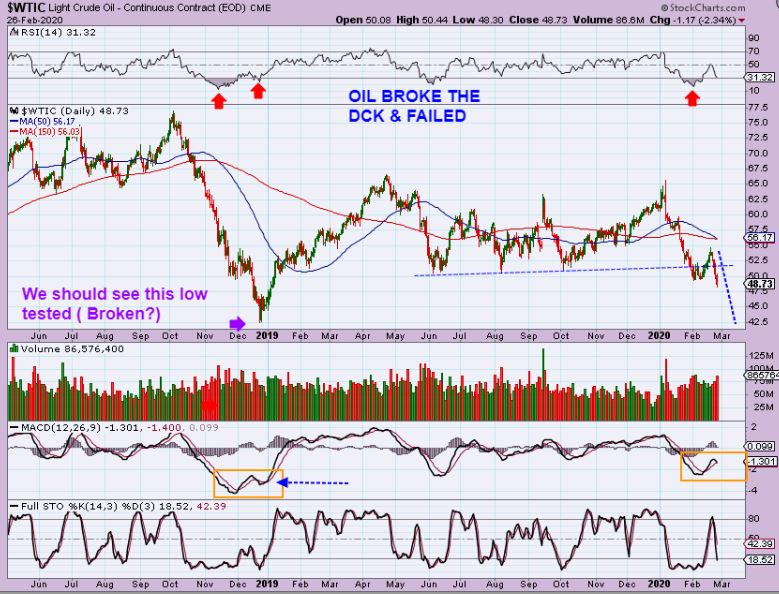
WTIC FROM FEB 26 – When Oil broke the lows, I warned that this was a failed daily cycle. Instead of a genuine ‘shake out’ & recovery with that dcl, this was a ‘failure’. It was also early in Oils daily cycle count as it broke $50, so I gave it initially a $42 target. Oil should sell off further…
WTIC NOW – Oil did continue to break down this week and we are now quickly at the $44 area. Since the volume is heavy, I also discussed another chart target with the following chart…
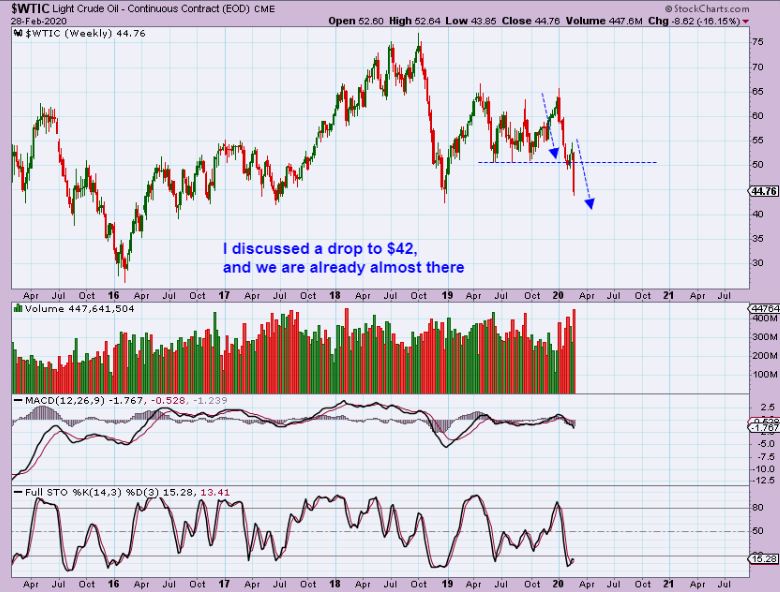
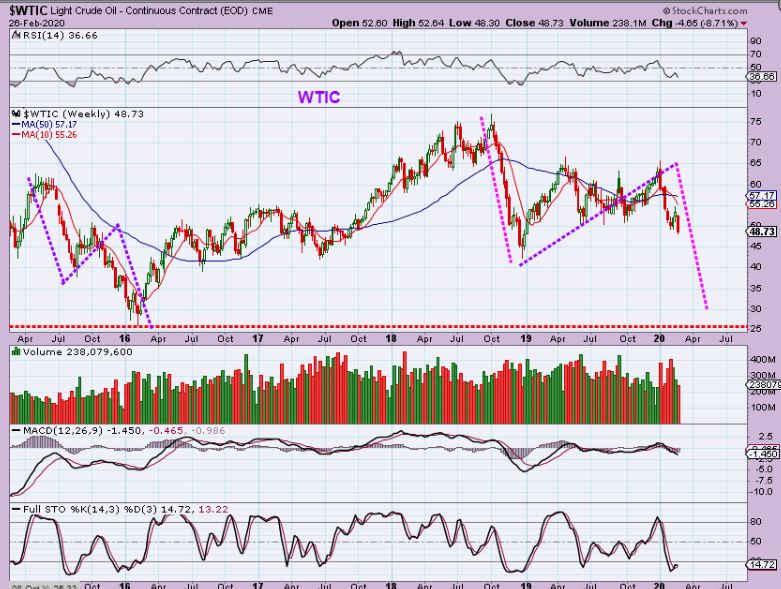
WTIC REMINDER FROM THE 26th – Breaking that $42 area can lead to a larger drop as shown here. Oil & gas at the pumps should be getting cheaper.
We were happy about low Oil prices, because with earnings coming out in the Miners, we had 2 favorable things in the mix. Miners now had Higher Gold prices to sell Gold at, and lower operating costs with cheaper fuel. Miners were doing well. Then last week saw some changes that we need to discuss next.
.
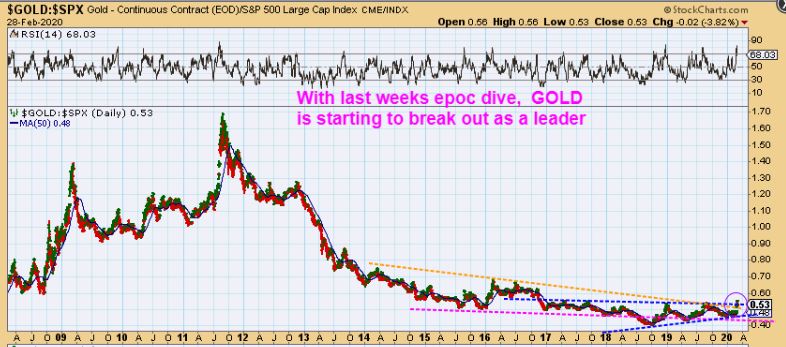
GOOD NEWS FIRST – The Ratio in favor of Gold vs the Markets showed Gold breaking higher from a base. This can certainly continue if the Markets dip and Gold holds up. If Gold eventually rallies and the SPX dips, we would be seeing evidence of a Bull Market in Precious Metals emerging. THIS COULD BE A NICE CHANGE SLOWLY TAKING PLACE.
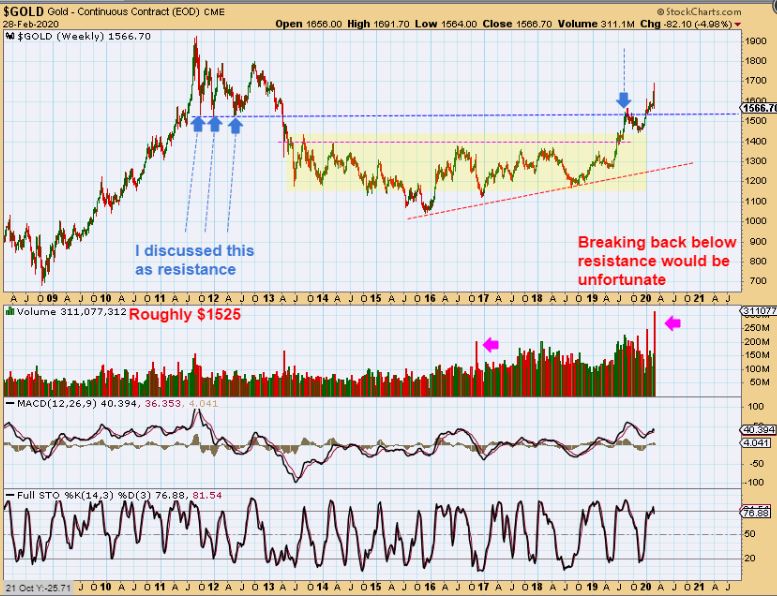
GOLD – We had our Bullish break out and it was pushing through resistance. This was plain and simple Very Bullish. This week it dropped on massive volume and, as I will show you, and this drop could now stall our progress for a bit. I don’t think it kills the bull. Look at this chart: We do want $1525ish to hold or the next red line may get back tested.
.
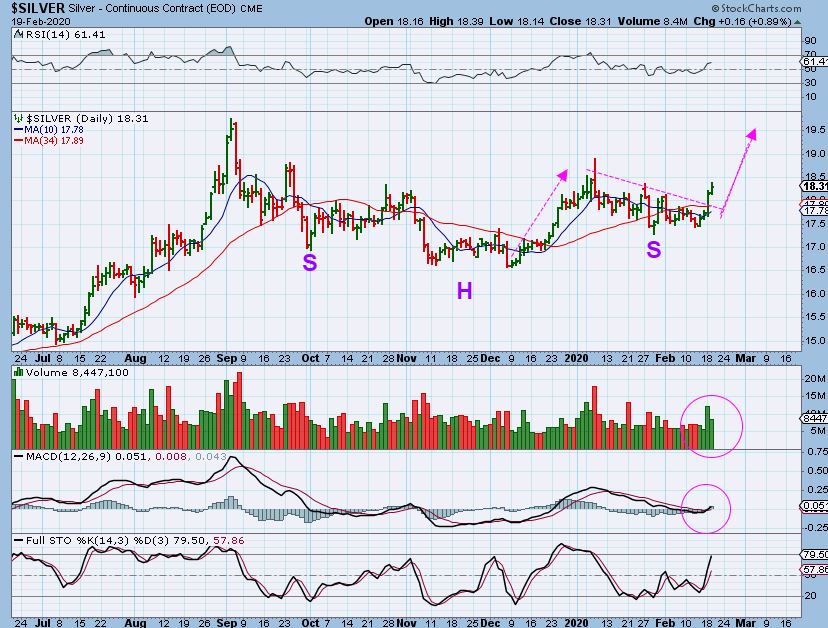
SILVER FEB 19 – Just last week I was LOVING this inverse H&S. It really did have bullish implications. If we are trading what is right in front of us, Silver was looking bullish.
.
SILVER WEEKLY – what can I say about Silver. The Inverse H&S is broken, the volume was massive and it is not even oversold. It is ugly, but the best thing that we could hope for is …
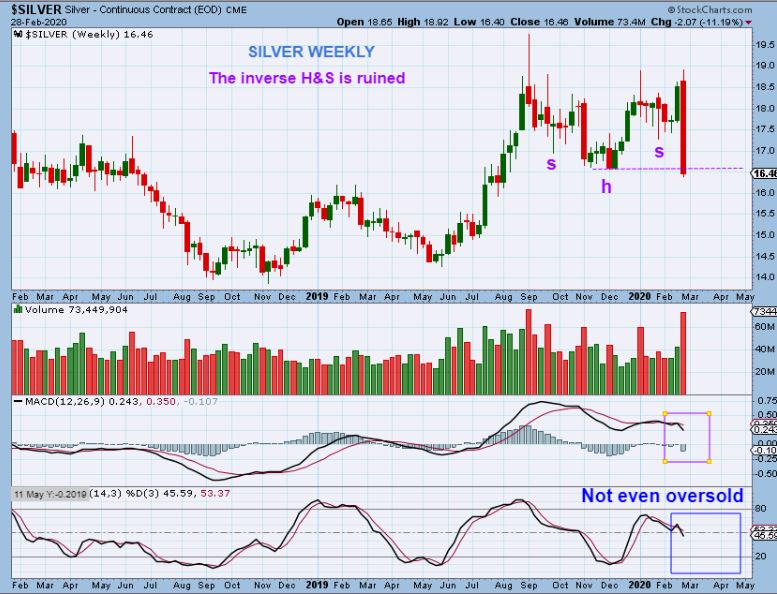
This chart is damaged & can sell off if liquidation continued. If the General Markets bounce, then silver could ease up on the selling, so
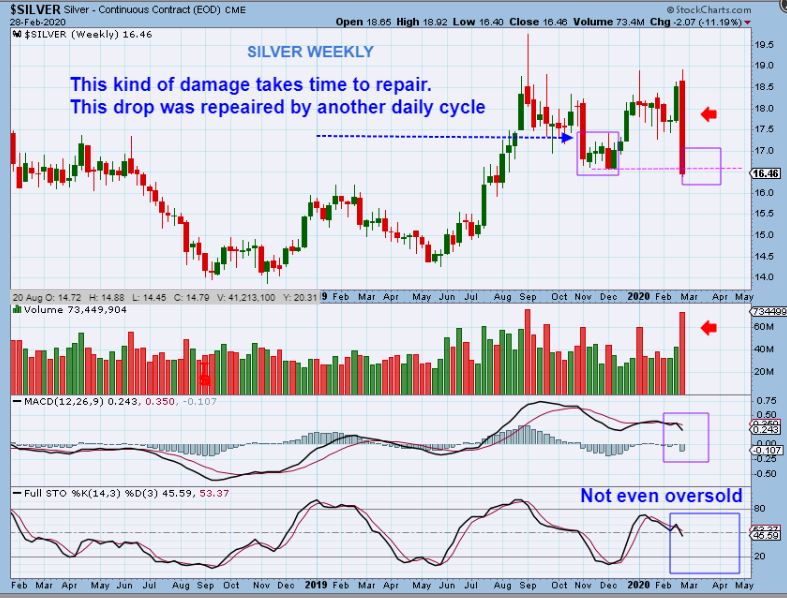
SILVER – When Silver crashed in November, it then put in a lower low the next week & paused. It chopped sideways for 5 weeks essentially ‘repairing’ that broken chart. That could happen again, but this certainly isn’t a buy, it is a ‘let’s see how this plays out’ time period.
AND NOW TO THE MINERS SLAUGHTERHOUSE 🙁
.
FROM FRIDAYS REPORT –
I MENTIONED THAT I THOUGHT LIQUIDATION COULD BE TAKING PLACE AND CONTINUE, TURNING OUR BULL CHART UGLY. I WROTE…
.
I THEN SHOWED THAT THE CHART WAS GETTING DAMAGED AS OF THURSDAYS SELL OFF. I wrote..
.
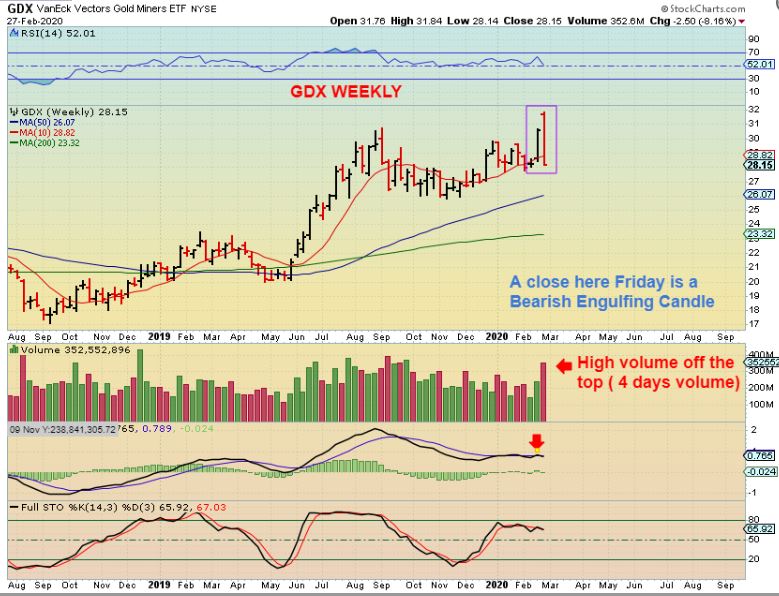
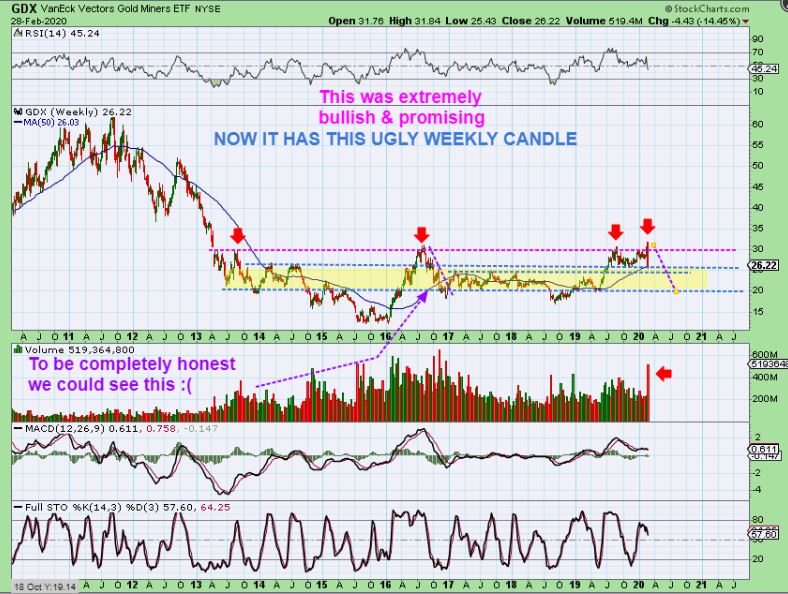
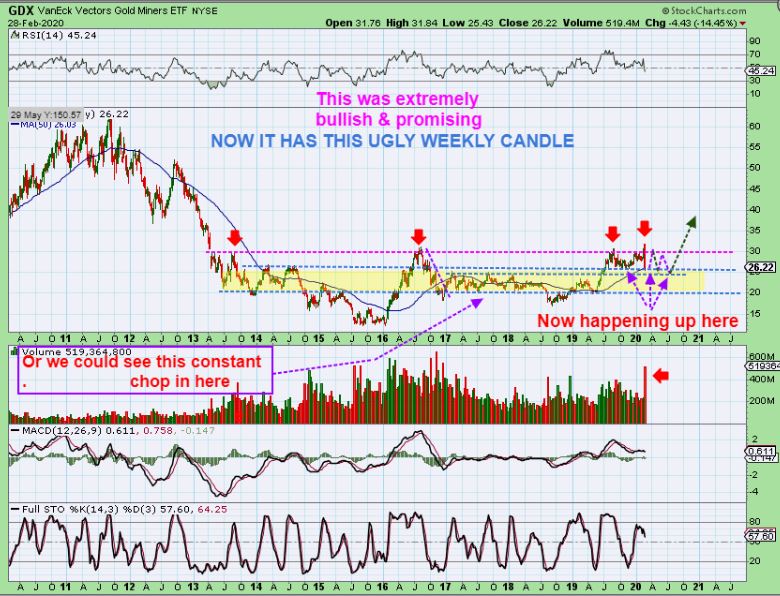
Just 3 days later and we have a bearish engulfing candle on a weekly chart, and the MACD Weekly now trying to cross under? That is fast damage, and most of it came just today. If we bounce Friday, it may not end as engulfing, but if the liquidation continues, this will be one of the ugliest weekly candles that I’ve seen in a while for Miners. The MONTHLY CANDLES END FRIDAY TOO.
,
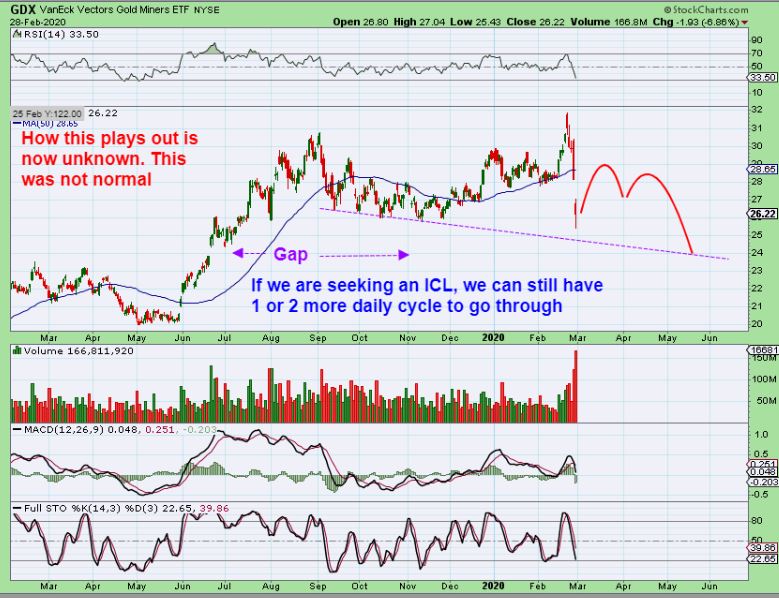
Selling continued: GDX saw a Day 27 ‘peak’ with a reversal candle, so I cut leverage, but I thought that the dcl ( Daily cycle low ) could be a back test of the triangle. Thursday was a warning that it wasn’t continuing to be a mild dip, and that is when I mentioned that liquidation looked to be occurring. Friday was just ugly. A reversal candle formed on day 31 after breaking a recent support area, so this could be a dcl & bounce setting up (but this is scary stuff).
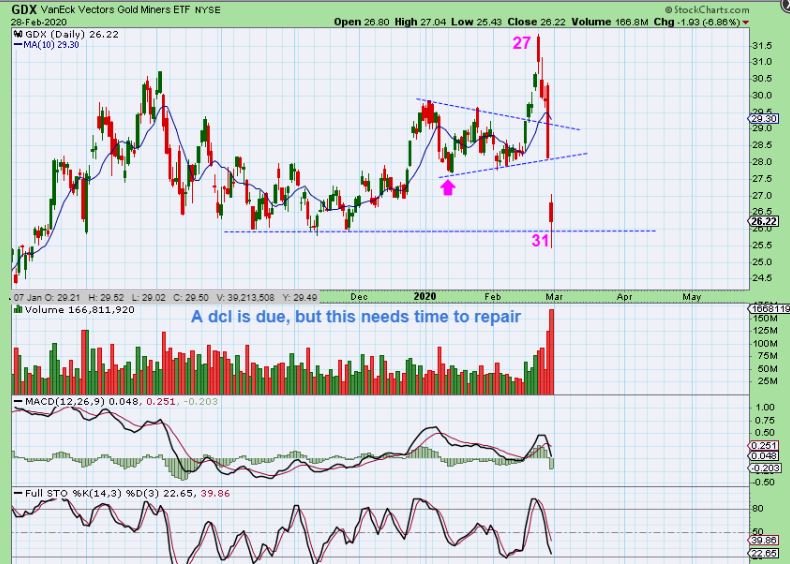
That DCL could form, bounce, and then roll over into an ICL at the orange line.
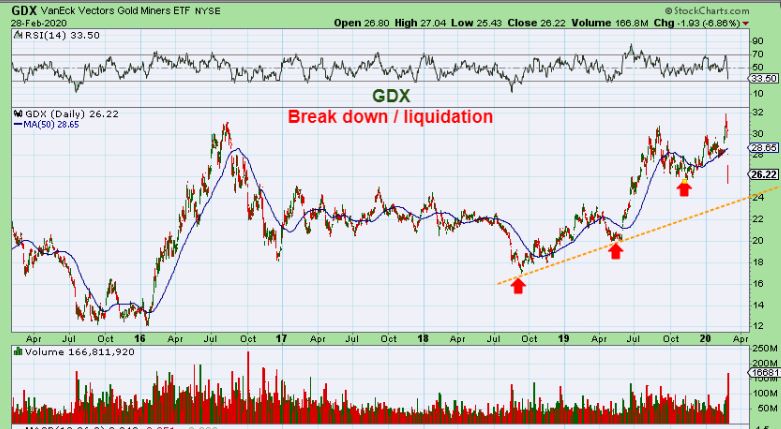
,
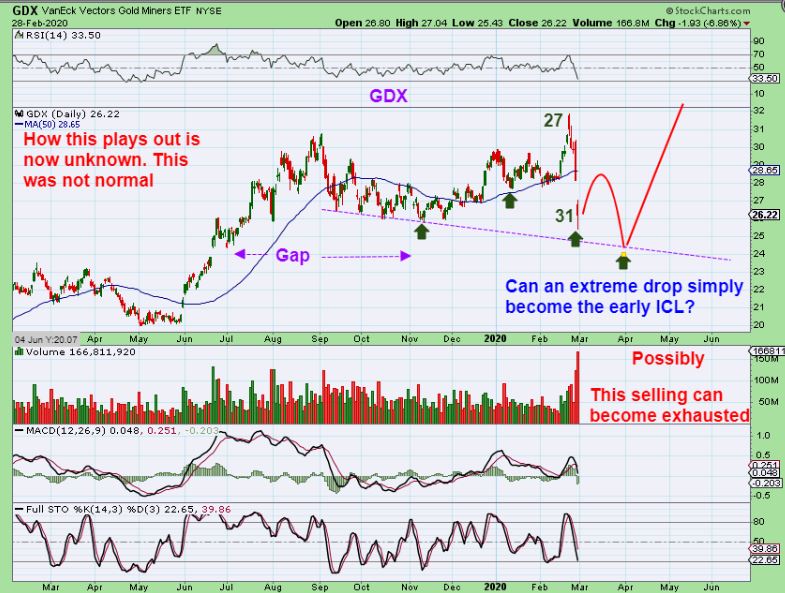
GDX – A bounce like that with another spell of selling could come if the SPX bounces & then rolls over, except that I think THIS could be the FINAL low for Miners, and money from the markets sell off may flow here.
NOTE: PLEASE UNDERSTAND THAT THIS IS ALL SIMPLY SPECULATION, AND WHAT I THINK SOUNDS REASONABLE WITH MY CURRENT EXPECTATIONS. EACH DAY/ WEEK I WILL CONTINUE TO EXAMINE IDEAS AS THE CHARTS FORM .
,
GDX – A FINAL LOW AT THE NEXT ICL could be the next best buy for Miners and they could rally into the end of the year. This week was discouraging, but I personally wouldn’t give up on them at this point. They were liquidated to off set market losses, and in the future they can be BOUGHT to offset market losses.
.
LET ME SAY THAT AGAIN: This week was discouraging, but I personally wouldn’t give up on them at this point. Miners were liquidated this week to off set General Market losses, and in the future, if the sell off resembles 1999-2000, Miners were then BOUGHT to offset market losses as they rallied. I am not known as a constant ‘Gold Bull’, but the set ups and the way things are playing was & is still Bullish. Let’s go to the weekly charts …
.
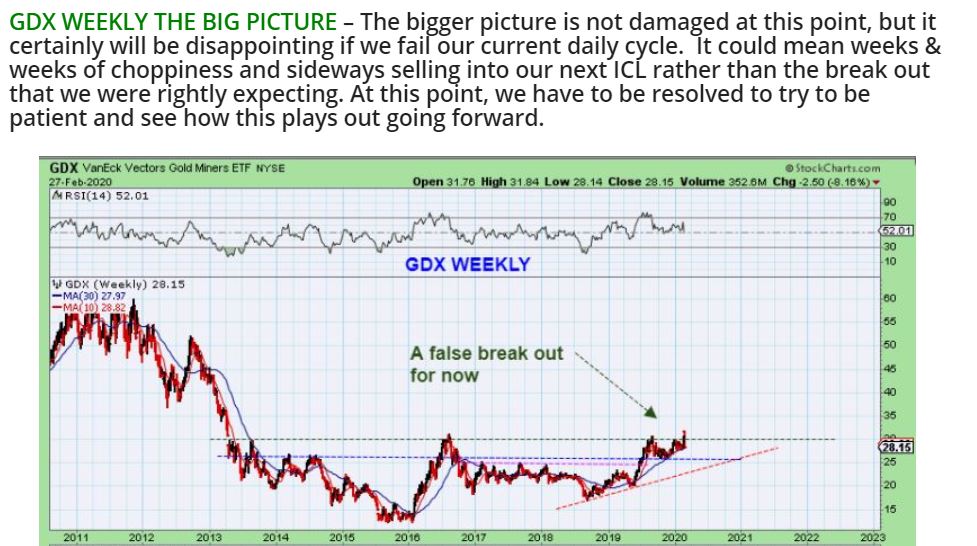
GDX WEEKLY FROM FRIDAYS REPORT – I was watching that blue horizontal line of support. THAT goes back to 2013.
.
GDX WEEKLY – We dropped to the blue line, but we are due for a dcl, so it can bounce from here. It would be rather upsetting to many if we put in a drop similar to the drop after that 2016 run, but I can’t rule that out. I find it less likely, and I would say that…
.
GDX WEEKLY – Miners are making Money now. If Gold holds price above $1500, they still make money, so I think that we will find accumulation this time. That could cause price to chop around the upper range, similar to when it chopped around the lower range, as seen here.
.
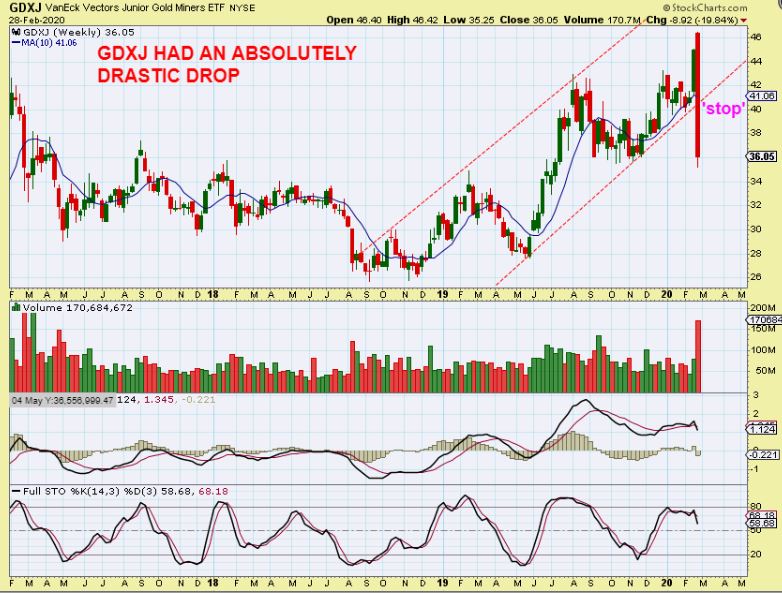
GDXJ & SOME HOPE – What an absolutely ugly looking weekly chart in GDXJ. We crashed from the highs to below the lower channel with huge volume. Why do I say ‘Some hope’?
.
GDXJ WEEKLY – On Feb 27 2017 (what a coincidence) GDXJ crashed too. The next week in March it reversed and eventually after 5 weeks or so, that daily cycle rolled over to a new low. That was actually an ICL on the week of May 1.
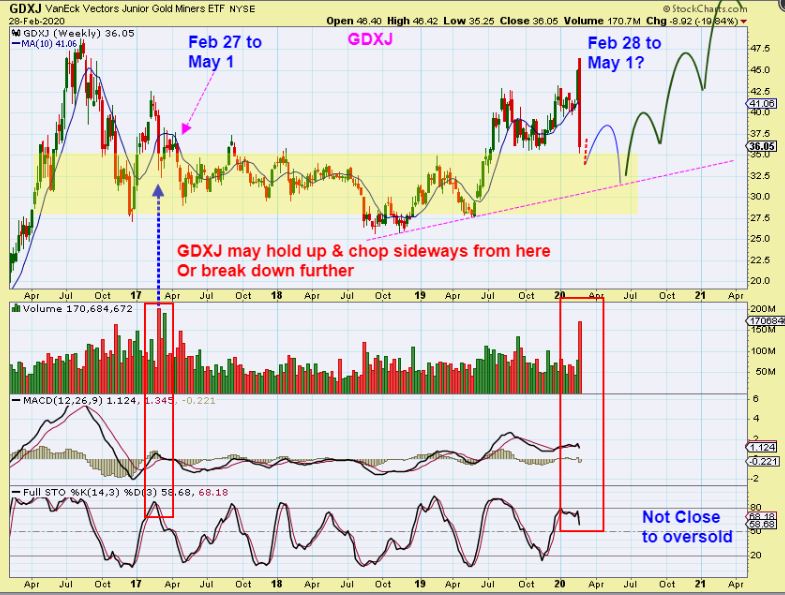
If we did something close to that, we would look for an ICL in May that could tag that trend line & then rally strongly higher for months. Again, if the General Markets top like 1999-2000, they dropped & money gradually flowed into Miners for years.
.
So everything got caught up in the selling and now we have some ugly charts, broken charts, that need repair. In this report I am pretty clear about what this could mean for the General Markets. See the Nasdaq chart if you wonder what I am thinking there. What do I think of the Precious Metals sector? Obviously, they were cashed in to offset some losses. Broken charts take time to repair, and a DCL isn’t due for a while. When the markets topped in 2000, Miners became the next Bull sector. If Miners can continue to sell their Gold higher than it costs to take it out of the ground, and Money from the stock markets flows out of that sector and into the Miners, we can still see a VERY STRONG recovery, even as soon as right after the next ICL. It does not take a lot of money to push these Miners around, and it fund managers see Miners making profits and rising in price, they may begin to flood in as fast as they exited. That is how I am still feeling, and as usual, only time will tell. I will constantly be covering the charts and ideas as they flow forward, and in the meantime, it looks to be rough & choppy sailing ahead. We may see some sharp snap back rallies that look very convincing too, but I would still be buying with Stops in place- we have all seen how important that is to preserving Funds. Now more than ever before, I admonish that we STAY FROSTY my friends!
.
It was rough to watch things just melt down, so rest up, and Enjoy your weekend & thank you for being a Chartfreak with me!
.
~ALEX
,
If we do get a solid reversal & we have bullish set ups in individual stocks, I will post them in the daily reports. I do see some tech that are looking ok, Biotechs are looking good, and miners may flip at a dcl. These would be short term trade ideas with stops. It is a tricky time of possible transition. That said, Enjoy your weekend! And if you have time, why not go through this report and the charts 1 more time? It looks to be an important time of change in the markets, and the extra time absorbing these charts and trying to let this sink in for the longer term ( & then watching to see if it plays out this way) will be rewarding down the road.
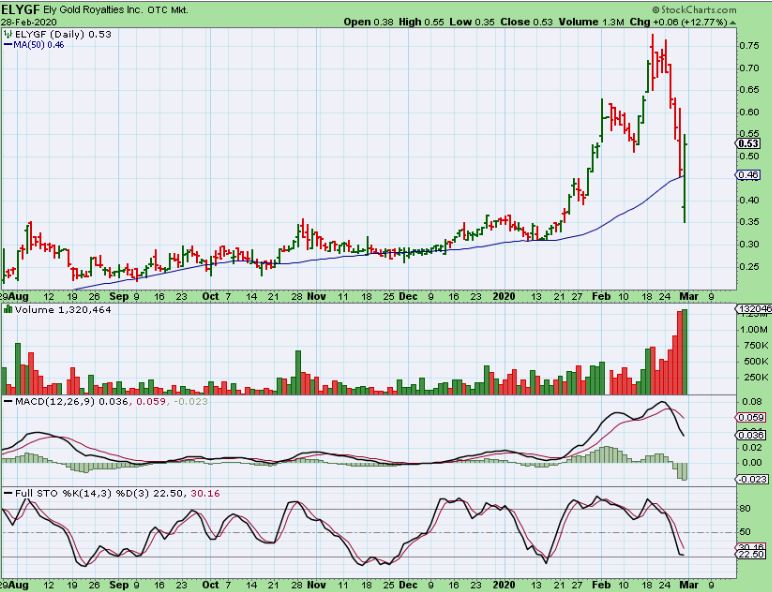
CAN MINERS REBOUND? I POSTED THIS SHARP DROP TO THE 50 SMA FOR ELYGF FRIDAY
.
ELYGF – 3 days ago this was trying to form a bull flag near the highs, but this shows the damage that a day or 2 can do if you get caught in a landslide. THIS IS WHY it may be best to sell even the good ones before they get caught up in some selling.
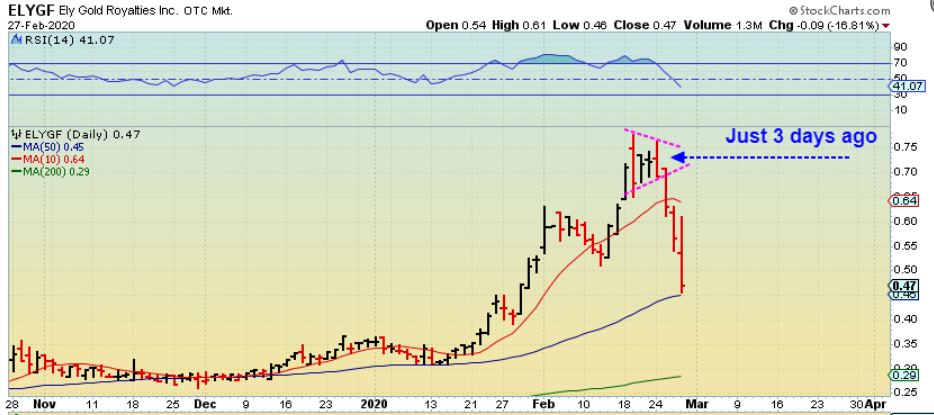
It crashed further on Friday to 35 cents, but suddenly a LITTLE GOOD NEWS ANNOUNCED THAT MORNING CAN GO A LONG WAY WHEN THE MINERS ARE INVOLVED. The future may still be bright for this sector.