February 22 Weekend Report
IMPORTANT: To start this weekend report, I want to be clear here that I might be seeing a change in the markets, one that I have discussed for weeks. The change could lead to the General Markets forming a top ( temporary or long term). We closed below the 13 sma on day 14, and that is early compared to the last few daily cycles– so that is a change. Time will soon tell us what that means in the big picture, but let me explain my thinking on this again…
.
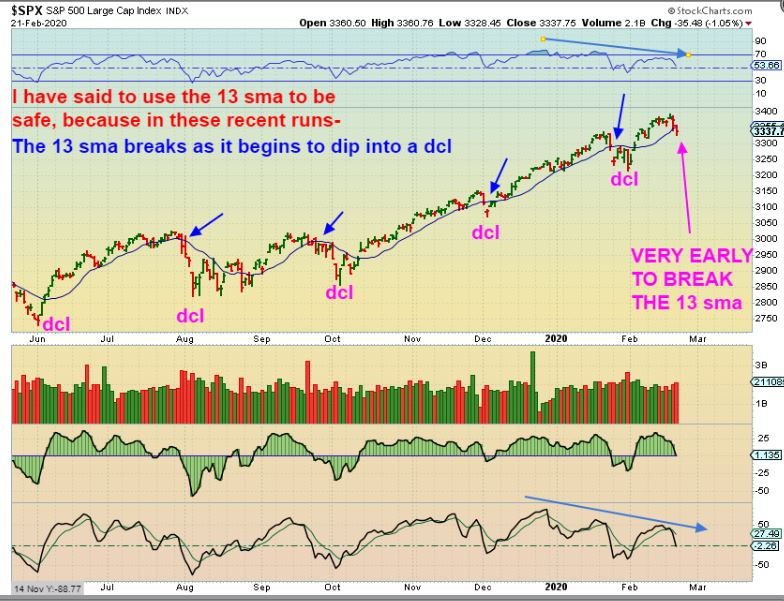
SPX DAILY – I have been saying that using a 13 sma as a stop has worked on prior runs, because that 13 sma isn’t broken until the markets are ready to drop into their next dcl. We just broke & closed under the 13 sma on day 14! So far we peaked on DAY 12! Notice the divergence too.
.
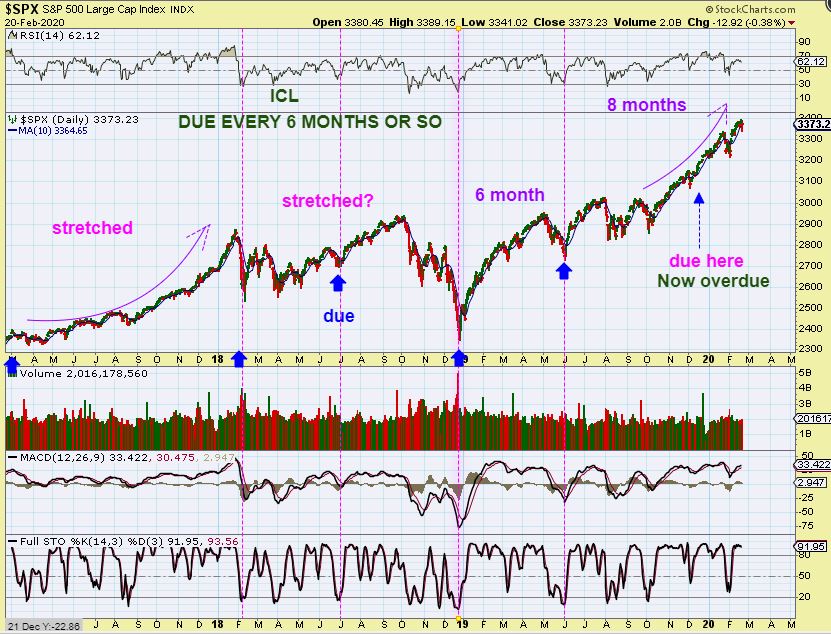
SAME CHART: Look at the blue arrows. That is a break of the 13 sma & a drop to a dcl followed. On day 14, we are not due for a dcl yet. If the markets drop from here, and we get a 35-40 day cycle, this could drop for 30 days. NOT STRAIGHT DOWN DAY AFTER DAY, but the peak may be in…
.
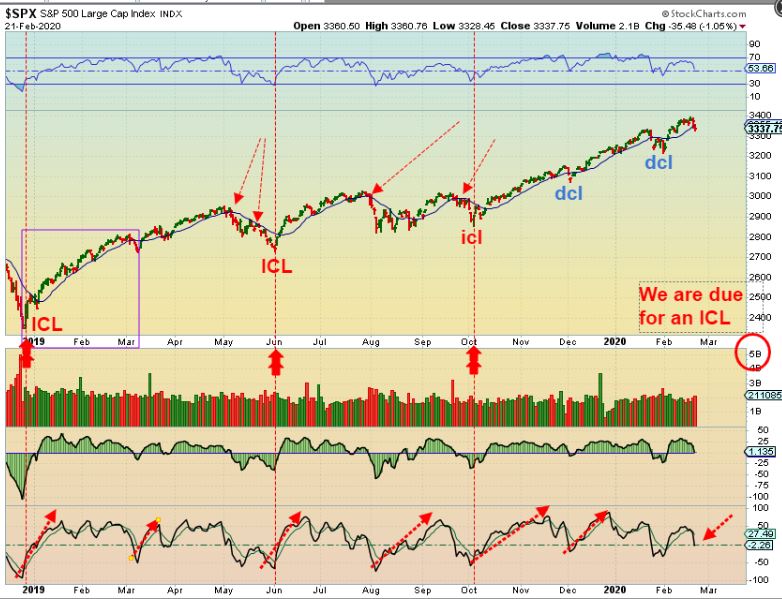
SPX DAILY – We are overdue for an ICL drop too. They often come 6-8 months apart, and I don’t know if October counts as one, so we would be overdue from June to Feb/March. My lower indicator is seeing the rally weakening too.
.
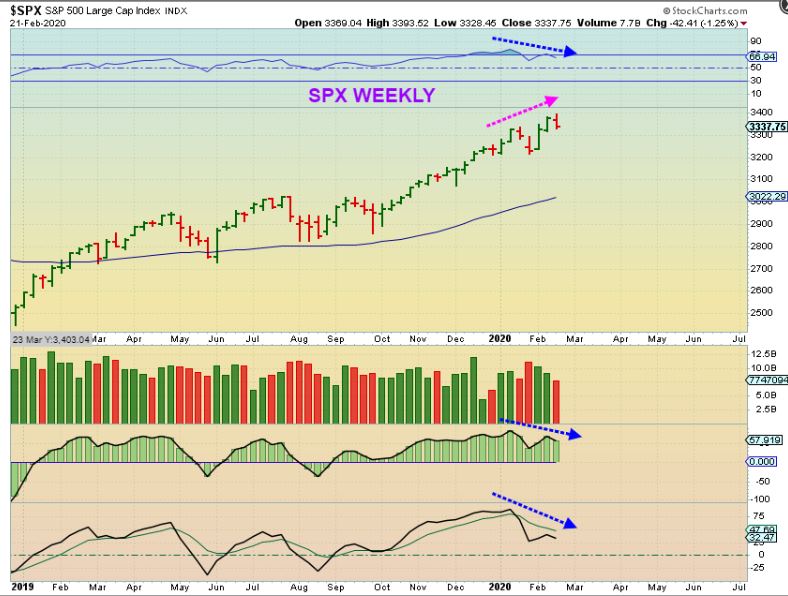
SPX WEEKLY – DIVERGENCE AT NEW HIGHS.
,
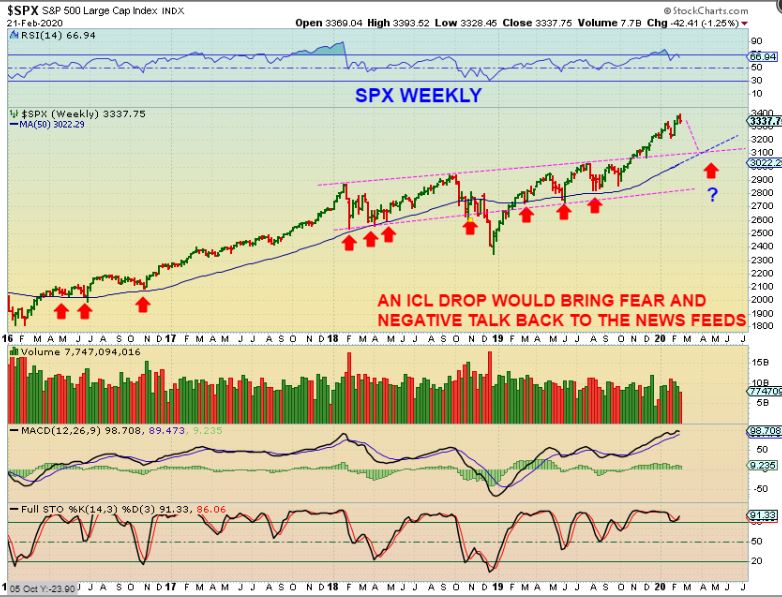
SPX WEEKLY – The Big Picture still looks as though we could go parabolic, but the shorter term daily charts above seem to be calling a top here. An ICL drop will scare many, suddenly News will get ugly, Viruses , Elections, earnings, the Fed, and everything else will be blamed on the drop, but it may be just a back test of this break out.
,
SPX WEEKLY – Again, every 6-8 months we should get a deeper dip (ICL) and we have yet to see that.
,
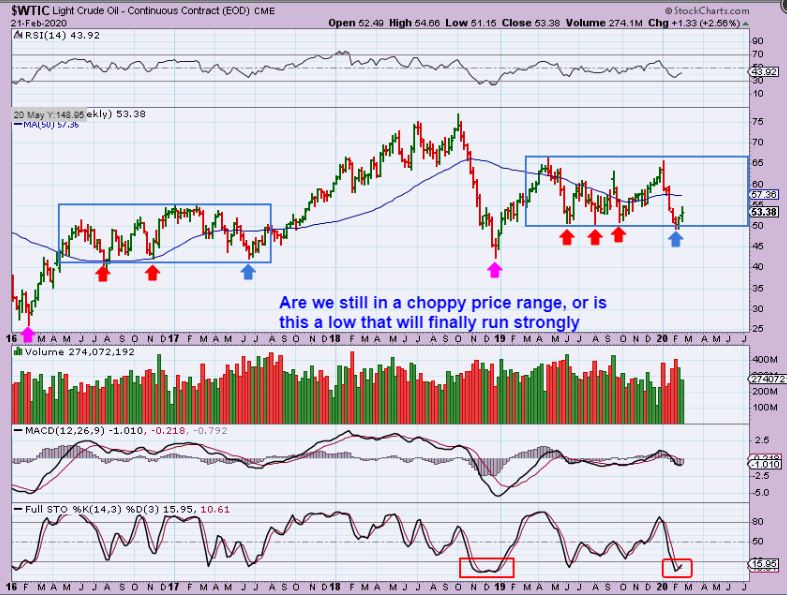
WTIC WEEKLY– oil bottomed and I have pointed out the big picture choppiness as being very similar to the 2016-2017 move. THAT choppiness did eventually break out higher. It is too hard to tell if this will or not, but buying the low in Oil is a valid trade either way. OIL Stocks have been a bit heavy so far though. I do discuss those in the daily reports along with the XOP ( GUSH) XLE, etc. GUSH was a trade mentioned last week.
,
PRECIOUS METALS
.
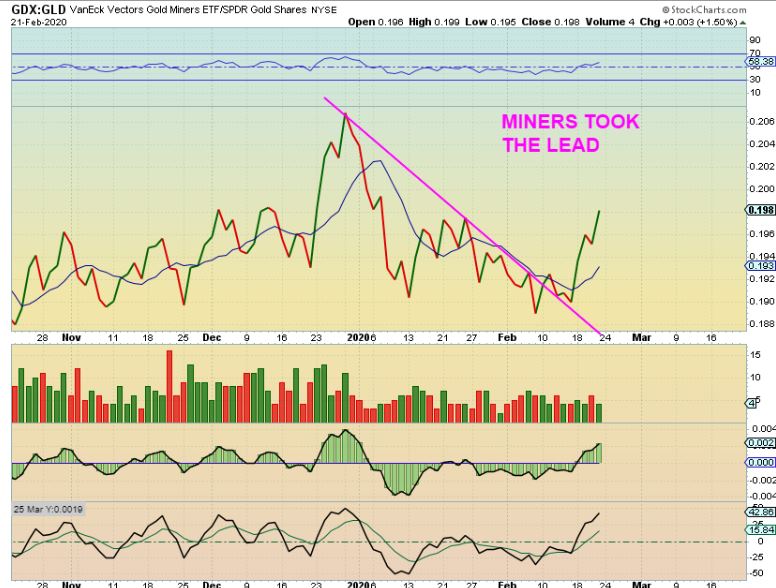
GDX / GLD RATIO – As mentioned in a daily report earlier in the week, Gold was leading the way, but Miners took the lead this week.
,
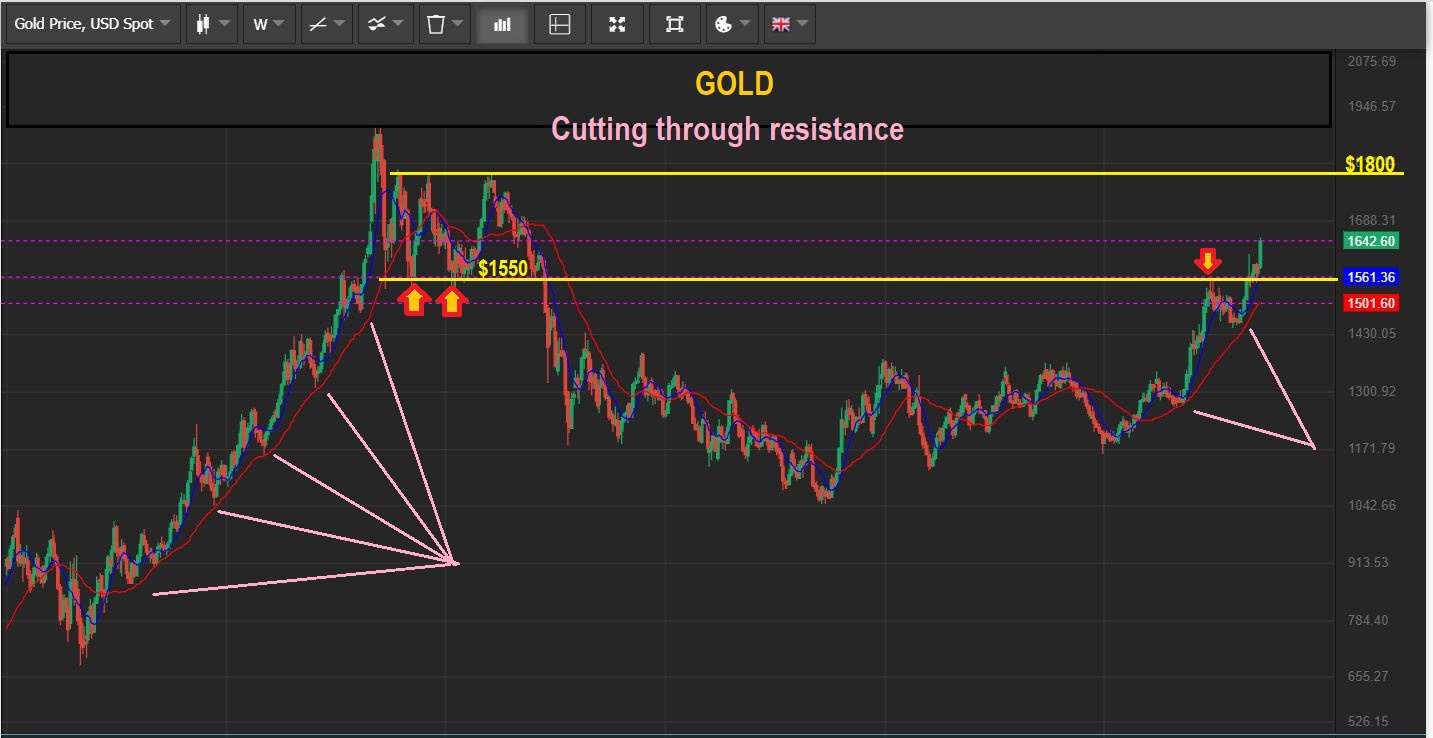
GOLD WEEKLY – Gold broke through resistance after a small pull back. That ‘small’ choppy pull back was a drop into an ICL in November. Look at the bull market dips pointed out in 2008 to 2011. We see that same thing happening now. Gold is in a Bull Market rally mode, yet many still cannot understand that.
,
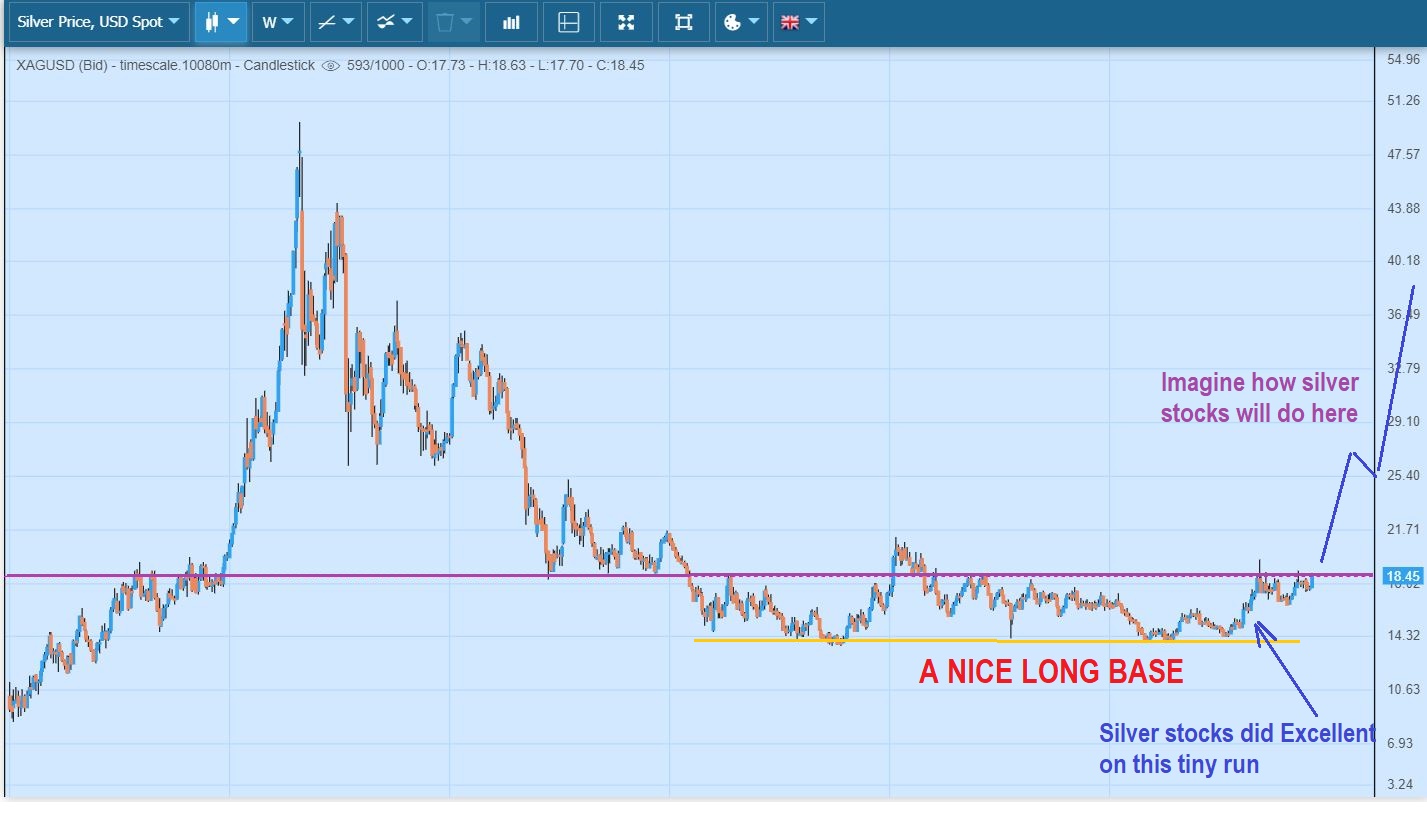
SILVER WEEKLY – Some silver stocks have doubled & tripled in the past 1.5 yrs, but Silver itself has not even broken from this Multiyear base yet. Can you imagine Silver stocks when this gets going? We will be making great gains again in the Mining stocks.
,
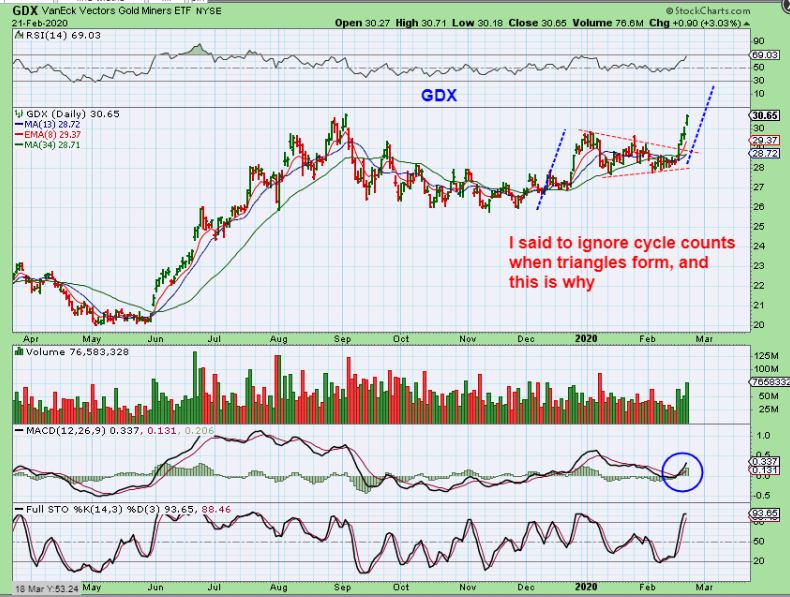
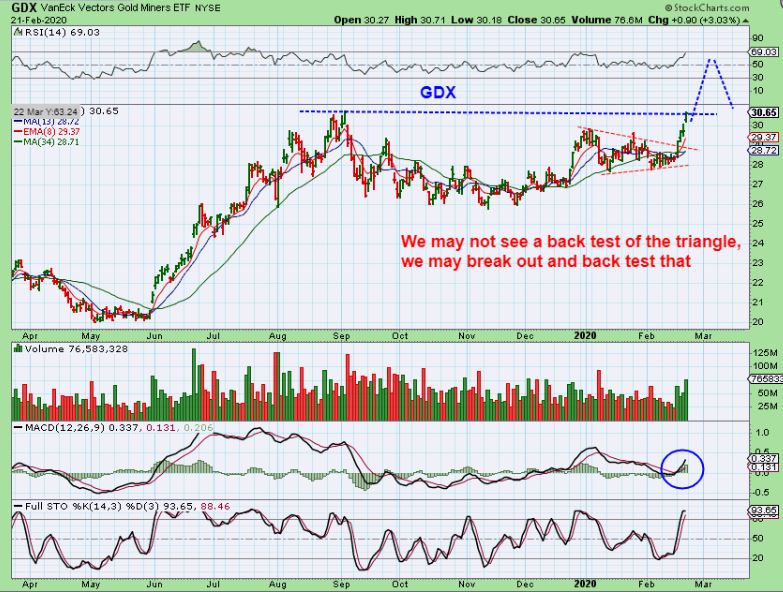
GDX DAILY – This triangle formed in about 23 days of the daily cycle, and I had people emailing me & telling me that it was too late to enter. I said that a break out of that triangle is a ‘buy’ in technical analysis, period. I also said that I Ignore cycle counts with triangles, since this could run straight up to day 30 or so & then dip later. So far, excellent gains have been made in many miners.
,
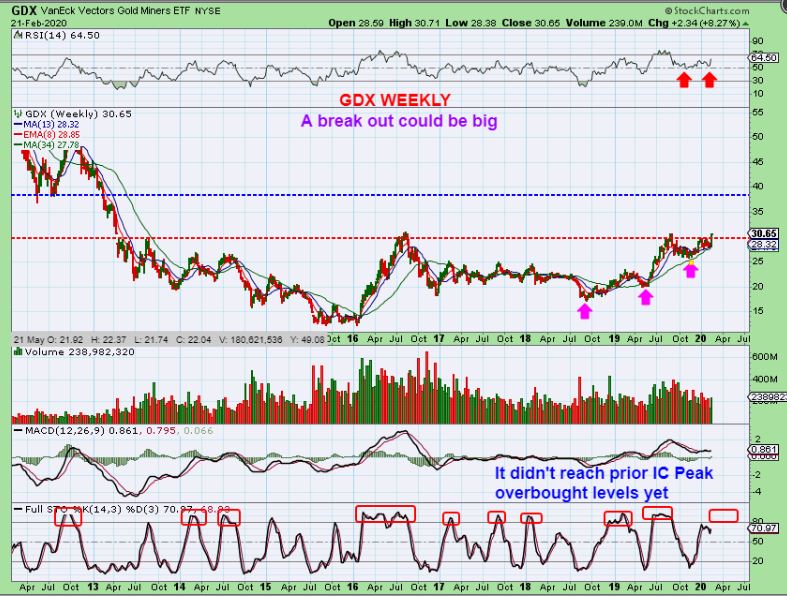
GDX WEEKLY – That’s a beautiful Cup & Handle ( as expected), and the choppiness threw people off the bull. I think that this could still break out above the September highs & back test later as a dcl, but it may just crawl sideways too. Either way, this continues to be bullish Action.
,
GDX WEEKLY – Look at what is happening here. GDX may break through the 6 year resistance line. I had a short term target of GDX $32, but this can just catch fire when big Money sees this break out, and markets begin to drop ( If they do drop here). Big Money may begin to flood into Miners, and look at the weekly stochastics (bottom box) . That could top when GDX gets closer to $40. 🙂
.
– The Big Picture is telling us that a change that I have discussed could be taking place. The General Markets closed below the 13 sma, so I am now more cautious if they don’t recover very quickly. Instead of a parabolic blow off top, we may get the dip into an ICL. We are overdue.
– Oil bottomed and should continue higher.
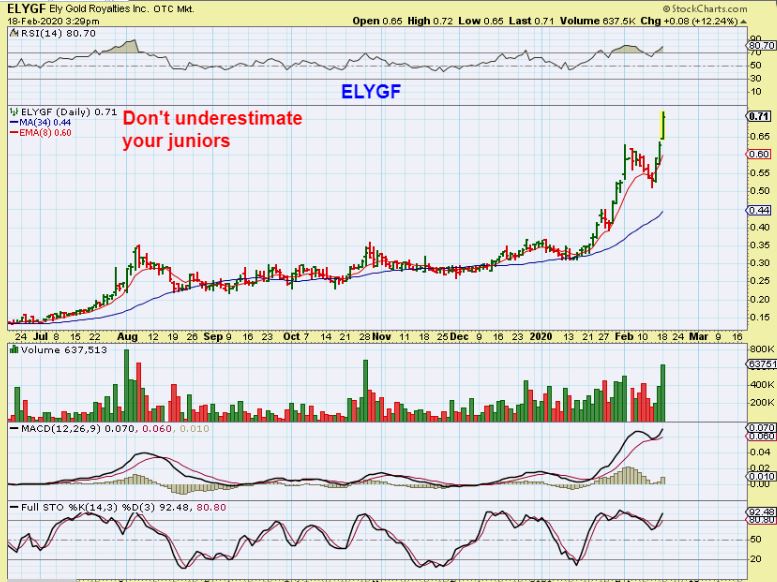
– Precious Metals broke out & had very bullish follow through. I have had many charts in the daily reports of Miners at low risk entry points, and we have been making good gains in those Miners. We finally went from choppiness to a straight up blast off in GDX & GDXJ , so this was a great week of trading for the Miners. Even in the weeks leading up to this, ELYGF, EQX, NEM, AUY, BTG, and others were pushing to new highs and leading the way. Now the other healthy Miners are playing catch up.
Of course, I will be covering all of these sectors and the stocks in my daily reports, but I also want to show you a few interesting charts of Miners below. An additional view to our weekly weekend big picture report.
.
Enjoy your weekend and thanks for being here at Chartfreak!
.
~ALEX
.
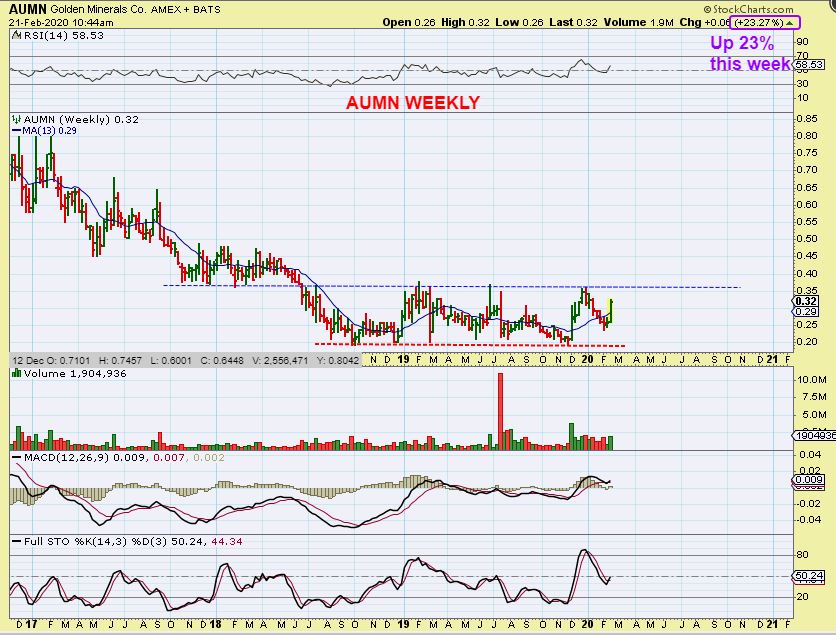
AUMN has been a bit of a laggard, but the weekly chart is showing me a healthy base formation. Did you know that this small pop was really giving AUMN a 23% gain this week? A break out could really see it run.
,
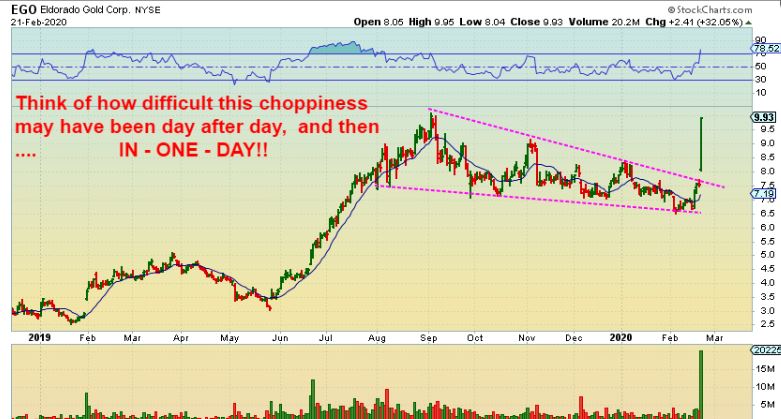
I WROTE THIS PRE-EARNINGS THURSDAY NIGH . WHAT A CHART SET UP, and then earnings came out…
.
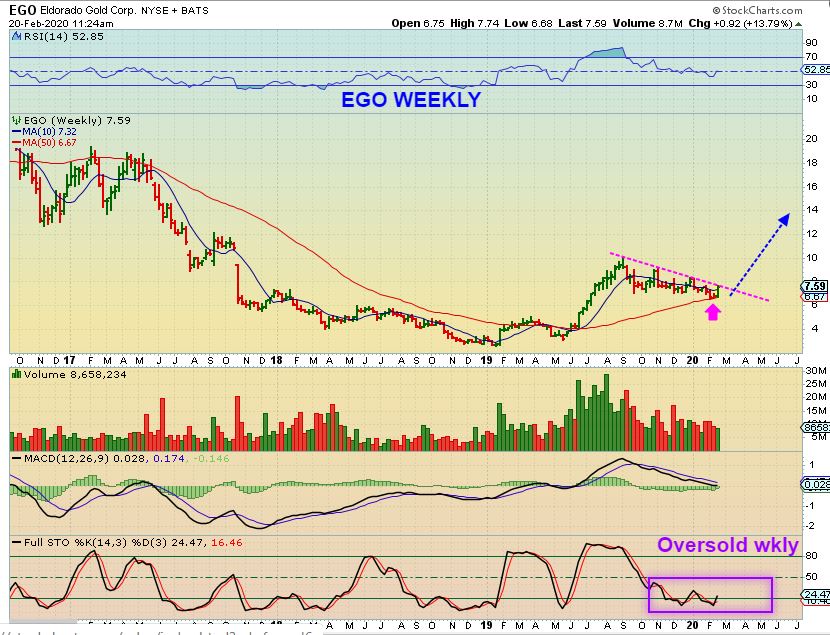
** EGO WEEKLY – WOW IS THIS PRETTY! Look at the weekly 50ma back test & reversal. It is Oversold on the weekly stochastics. Easy buy with a stop, I now own it.
.
EGO – Well, I had a very small starter position, not nearly as much as I planned on having after it broke out. Who knew it would pop 32% on earnings?? That chart above shows me that this can run to $20+ over time, no joke.
.A
AFTER catching this kind of run in a junior Miner, I have been asked about other small juniors that could be simply a ‘Buy & Hold’ candidate that may do well going forward. Well…
.
Well, there are NO Guarantees , but let me show you a few charts that may be in this category.
I HAVE ACTUALLY DISCUSSED THESE IN THE PAST, AND I SAID THAT I OWNED SOME OF THESE TOO, ALONG WITH ELYGF. LETS REVIEW…
.
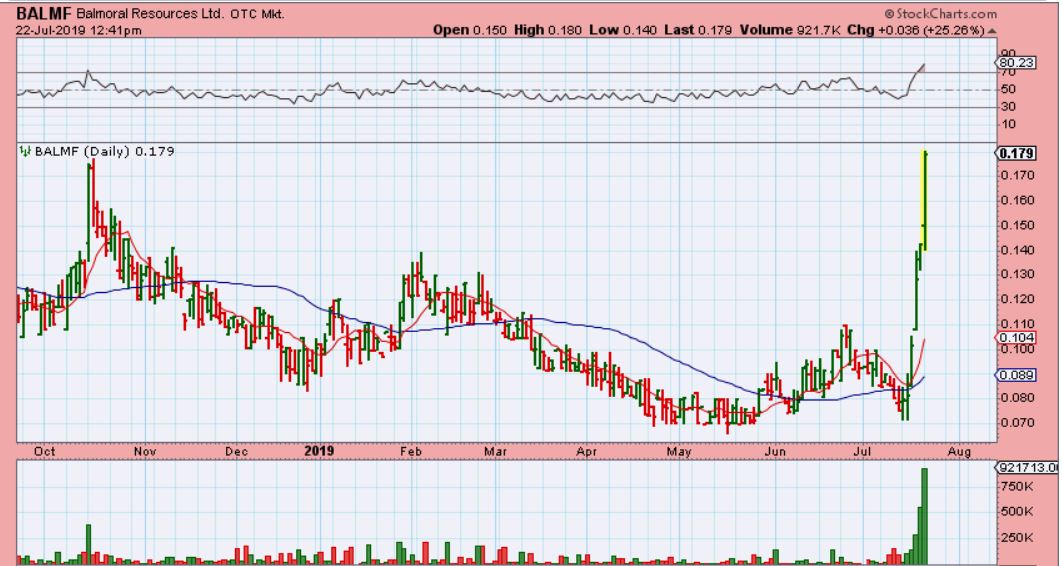
BALMF JULY 22 – This broke from a base at 8 cents last summer, so I posted this, it would be buy the dip or a bull flag. Did it bull flag?…
.
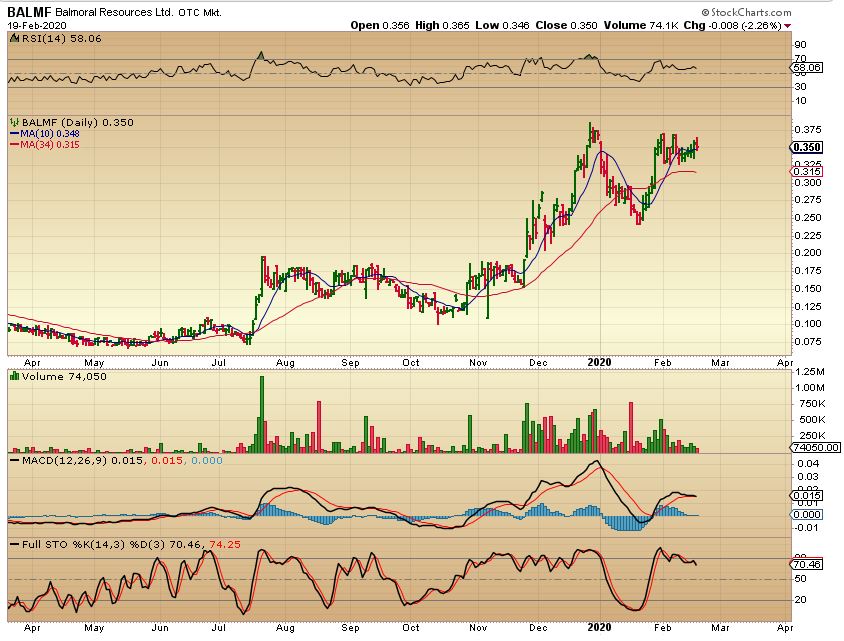
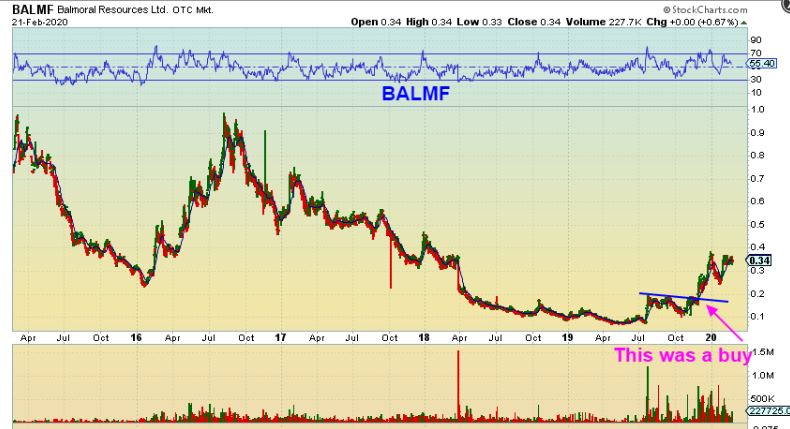
BALMF – No, it actually chopped sideways for months, but was a buy again in November at 17 cents when it was breaking out again. Last week I just posted this chart as a v-bottom cup & handle, so it is a buy again. Let’s look at the big picture too…
.
BALMF – As long as you understand that ‘buy & hold’ could mean a run higher, then sideways chop, then higher, then more sideways chop, then this is a buy & hold junior that seems to be working its way back to 2016 highs. That could be about a triple from here over time.
.
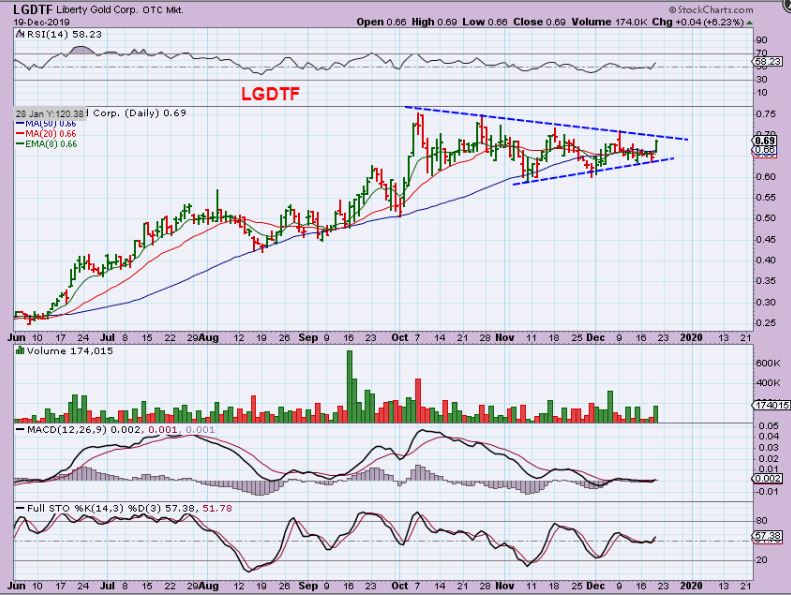
LGDTF – I posted LGDTF in December with this bullish set up. It was a buy at the apex around 65 cents.
.
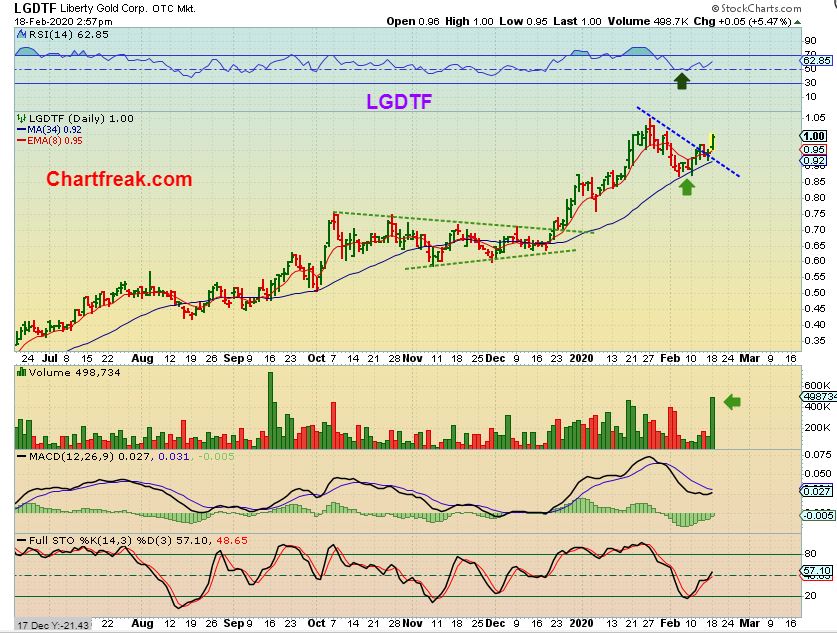
LGDTF – I posted it again last week and said that I added. It is now $1.00.
.
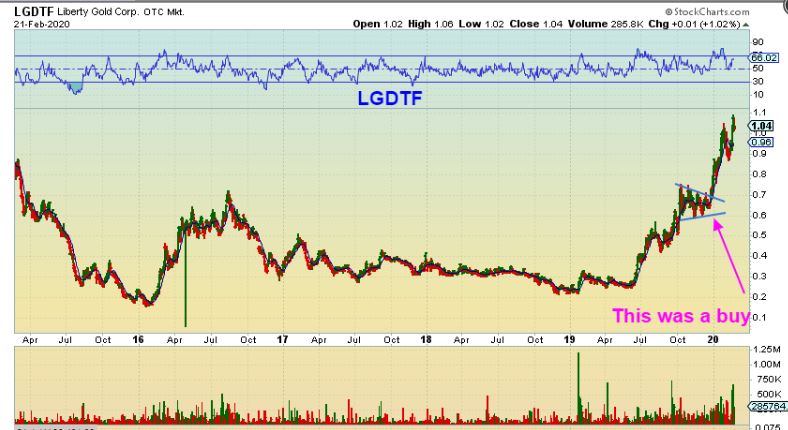
LGDTF – So the big picture shows that it has already made a solid run out of a long base, but it can keep climbing as long as it runs, consolidates, runs , consolidates. That is healthy bull action and this remains a buy & hold.
.
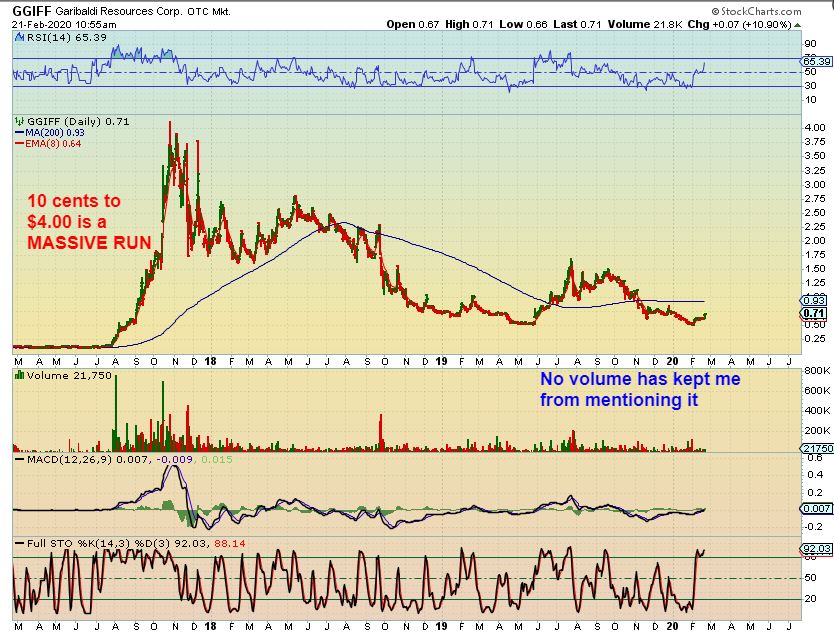
GGIFF – Here we have one right at the lows. In 2017 GGIFF ran from roughly 20 cents to $4.00 (WOW). I do not own this and I never mention it, because it often has super light volume of only 5,000 to 10,000/day, but it is starting to increase. In 2017 volume was fine, so IF this gets running, you may see that again, and it can be a buy & hold candidate.
.
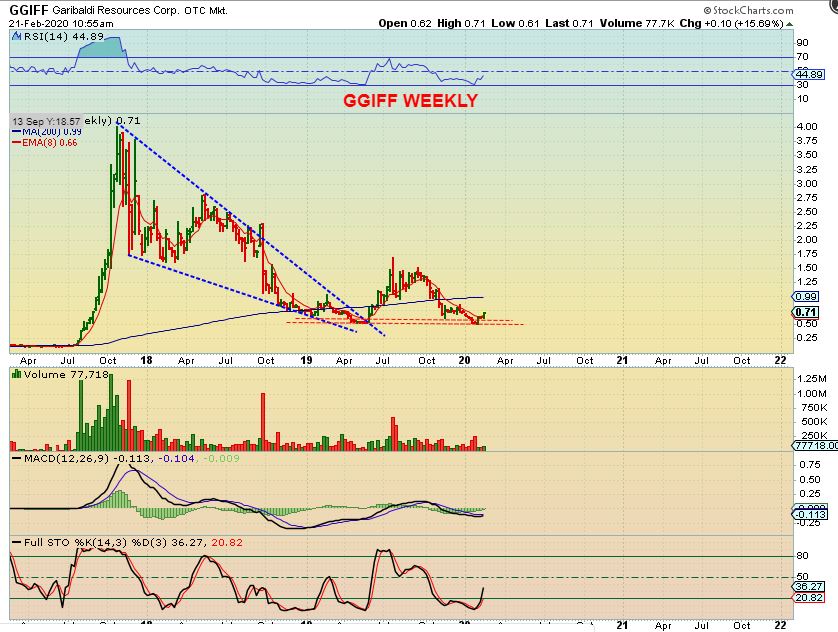
GGIFF WEEKLY – So it did have a 15% gain last week with this pop and 77,000 volume for the entire week. Do your own due diligence and decide “Buy & Hold’? or “Watch list? It has been on my watch list for years.
.
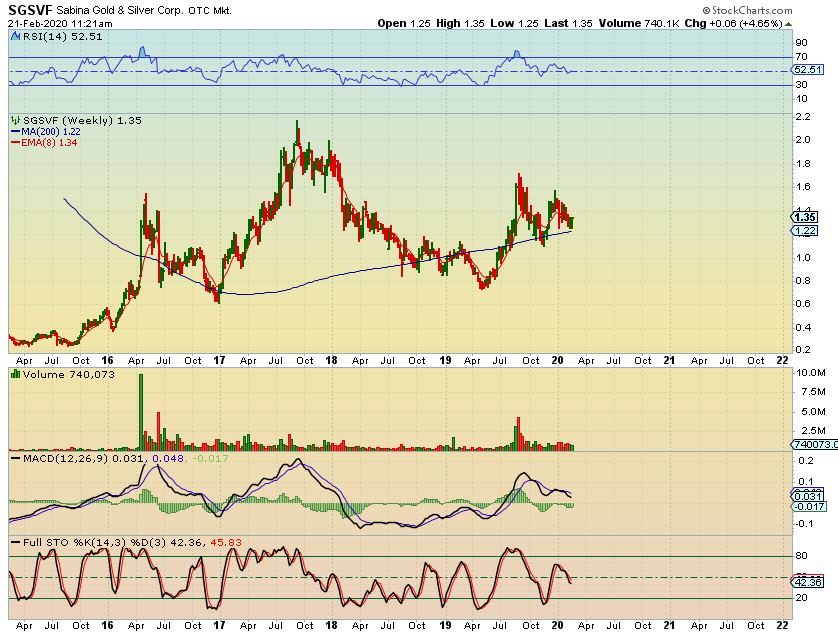
SGSVF WEEKLY – I have owned & traded this one and it actually looks good right here for buy & hold, since it is on support. It can also have low volume on a daily chart, but this may be a weekly bull flag of some sort. (Watch list? Buy & Hold?).
,
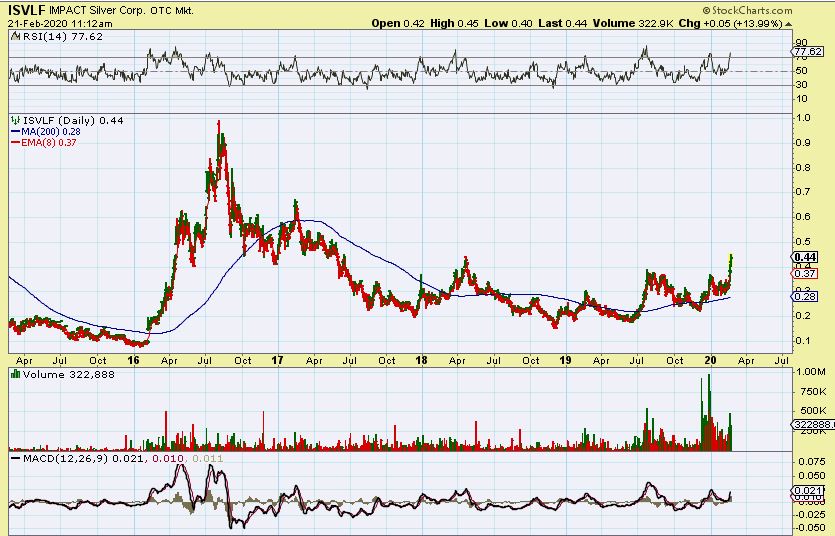
ISLVF – I actually really like this set up , because it is a long multiyear base breaking higher. Check earnings, but this could run to 2016 highs again since it is in a Bull Market.
.
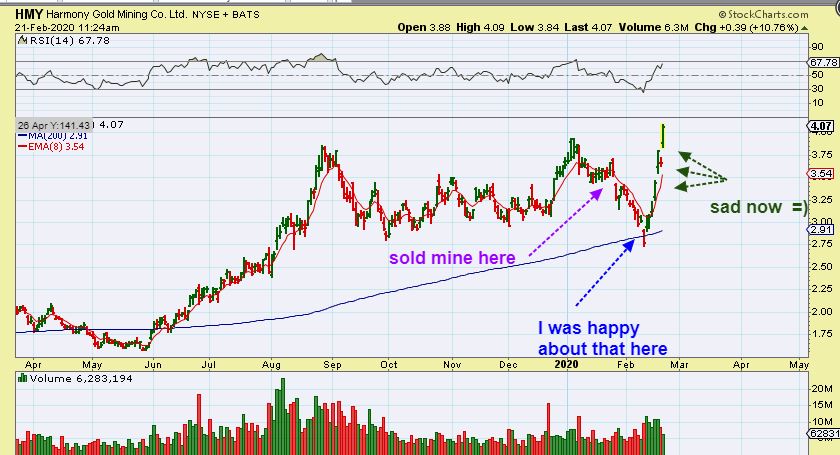
HMY – Here I just wanted to share a chart that I put in the live area to show HMY dropping to back test that 200sma, shaking out traders, and then rocketing higher. I made good money in this one on the first run May through August. If you read the chart, you can see that I sold it when it broke down, and never got back in.
This chart is a ….I am speechless. 🙂 What can I say about this kind of recovery? Amazing Bull Action.
,
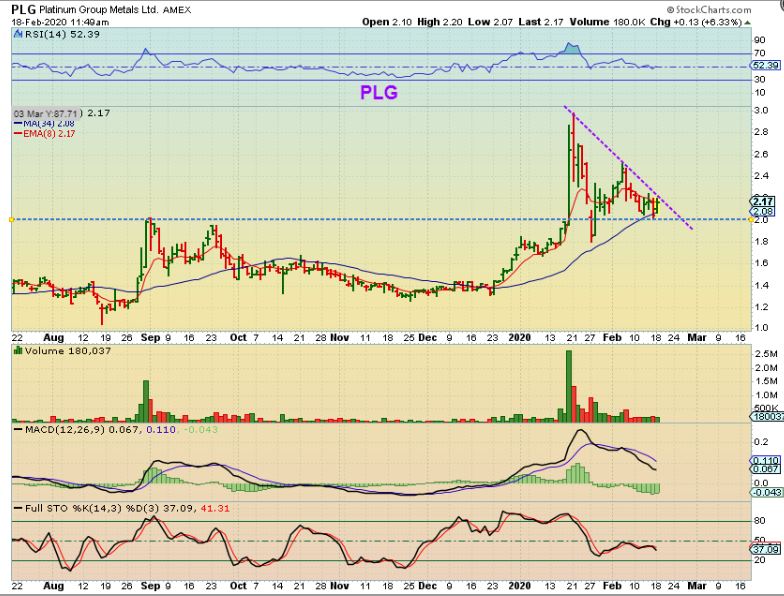
PLG #1 – I have kind of been Pushing PLG as a strong buy here. I see big potential in this one. This was the FEB 18 set up, a buy near $2 with a stop under the 34 or 50 sma. That BIG POP was from earnings, so that is an added bonus. It popped like EGO ( if EGO does this, it’ll be in my reports! )
.
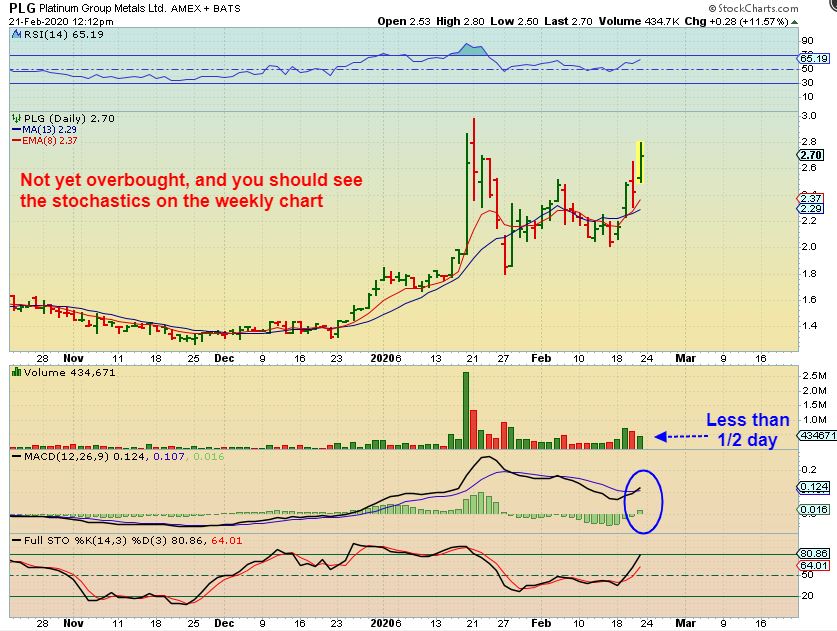
PLG #2 – This is acting correctly and I posted this midday Friday Feb 21. It actually closed up 13.5%. Why do I like it so much?
.
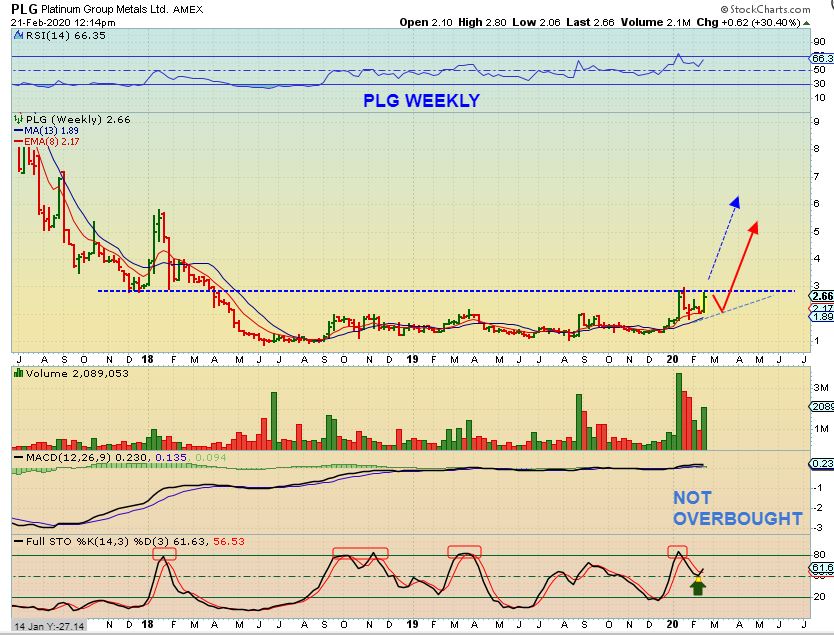
PLG #3 – It is right at a resistance point. It may pull back, it may break out, but if & when it breaks out, the upside potential is very good. Volume is surging as it prepares to break from the base, so I see this as very bullish, as long as no bad news comes along.
.
USAS WEEKLY – I pointed out USAS as a Silver stock that is bullishly setting up on Feb 14 at $3.00. I own it as a bit of a laggard that is bullishly set up, but I don’t know when earnings come out. They recently released an update that was bullish.
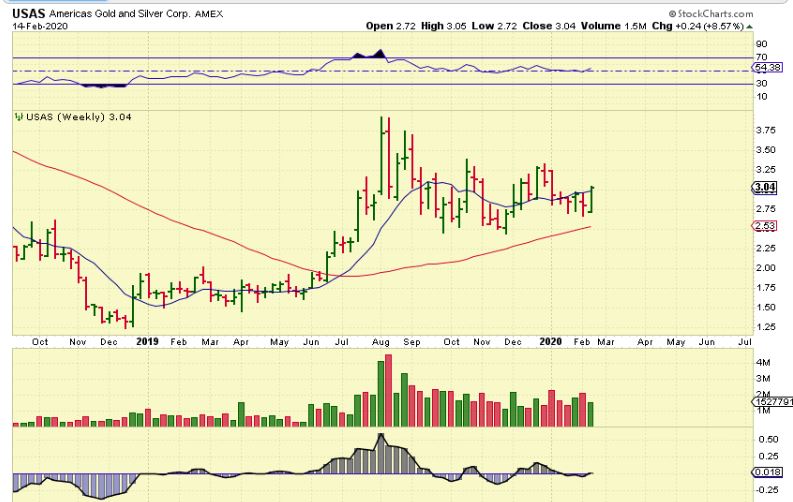
I posted USAS again on Feb 20. I (we) made good gains on this run from May to August too, and it has now consolidated those gains.
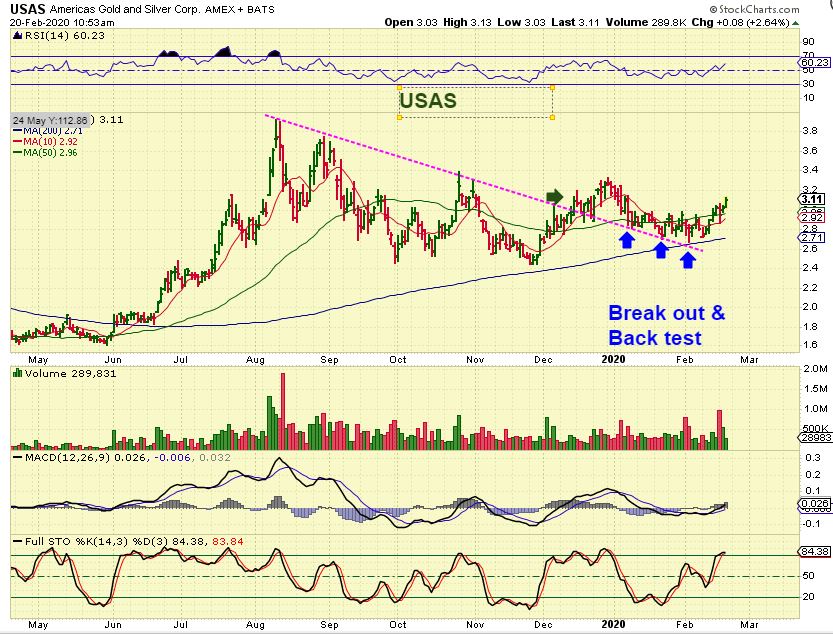
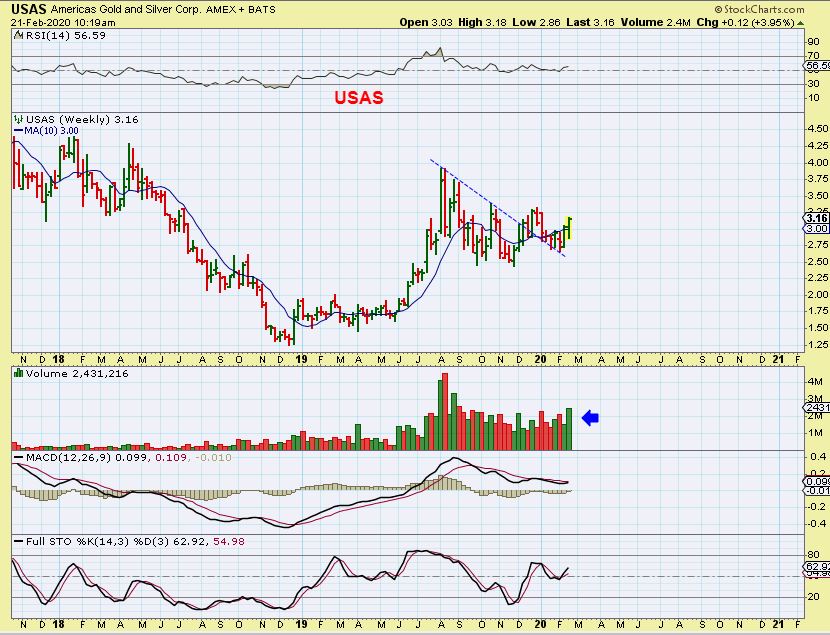
USAS WEEKLY NOW – I grabbed this chart Friday with less than 1 hr of trading. The volume was already high this week & as of the close Friday, it was over 3 million in volume for the week ( and that was only 4 days of trading, Monday was a holiday). This set up is now quite Bullish, I added to my starter Friday.
.
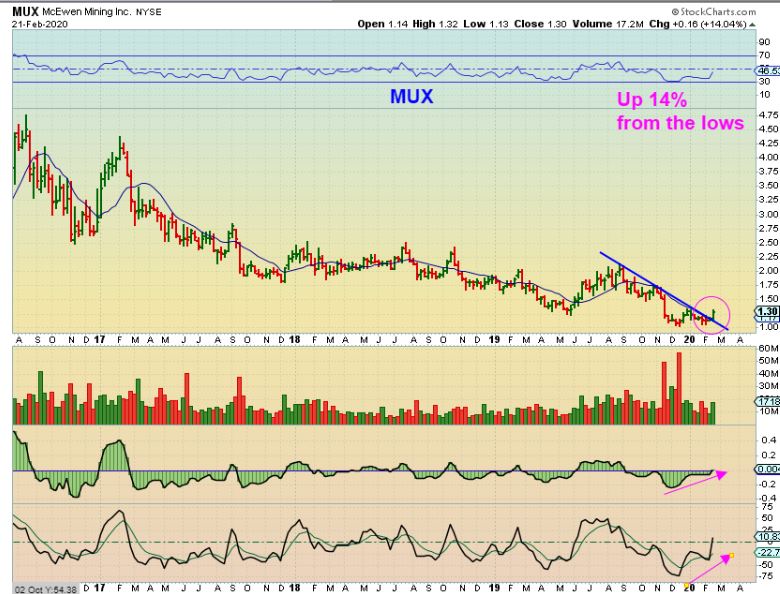
On Thursday I posted that MUX is finally breaking out & looks bullish.
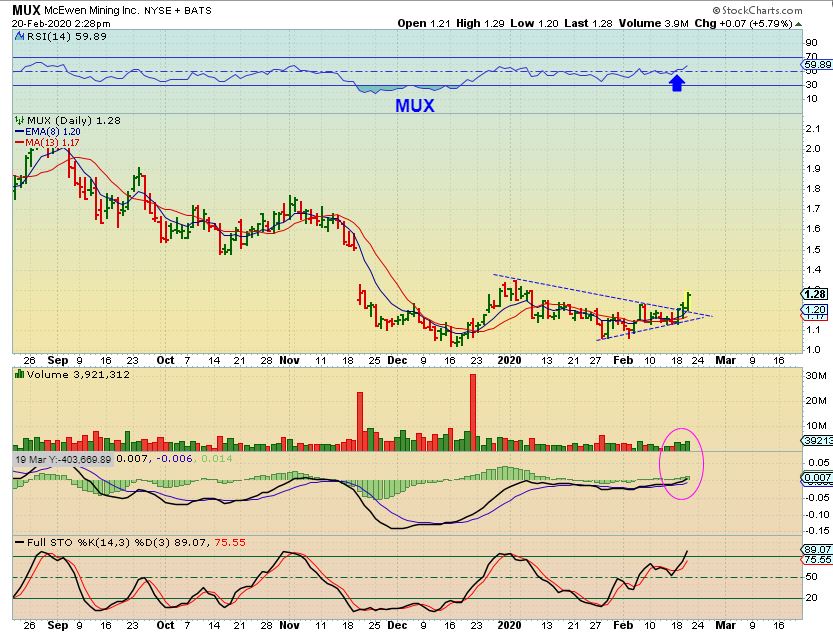
MUX WEEKLY the weekly chart is bullish looking too. It may be time for MUX, they released full year & 4th qrtr production results in January, but I couldn’t see when earnings is to be released. You may want to find that before jumping in.