
Weekend Report – February 16th
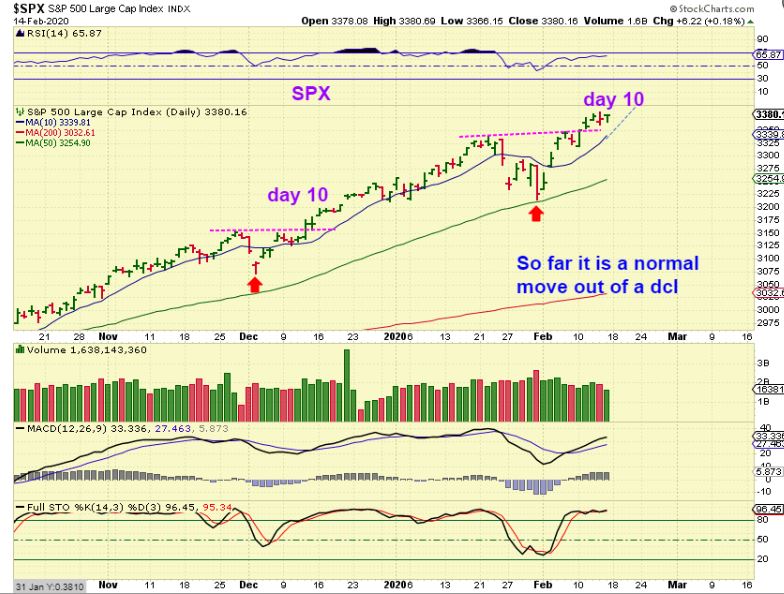
SPX DAILY – Normal bullish action so far, price remains above the 10 sma. IF this is going to become L.T., it could top within the next week or maybe 2 and begin to break down. This is day 10.
,
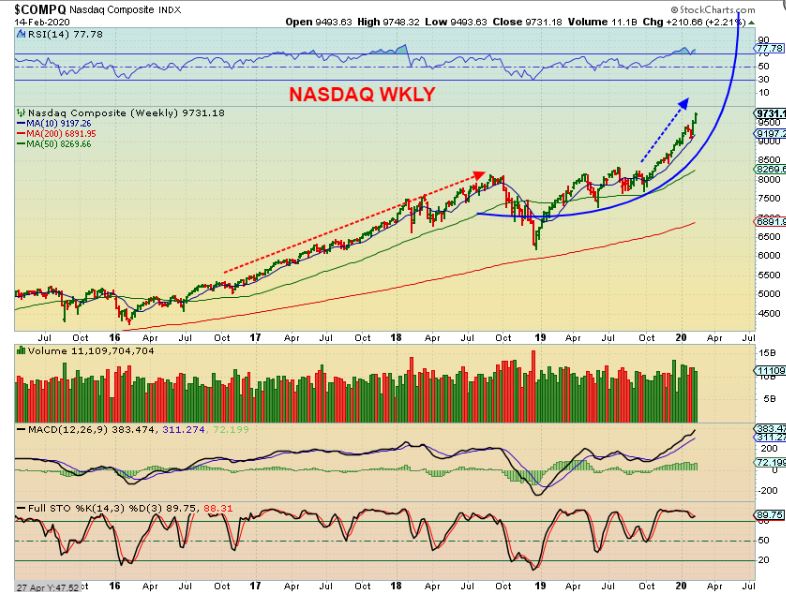
NASDAQ WEEKLY – Each week I’ve mentioned the possibility of these markets doing one big final blow off top parabolic move. I definitely do see a steepening of that curve here. It would probably accelerate & top in March, but for now raise stops under the 13 sma on the daily & enjoy the ride as long as it lasts.
,
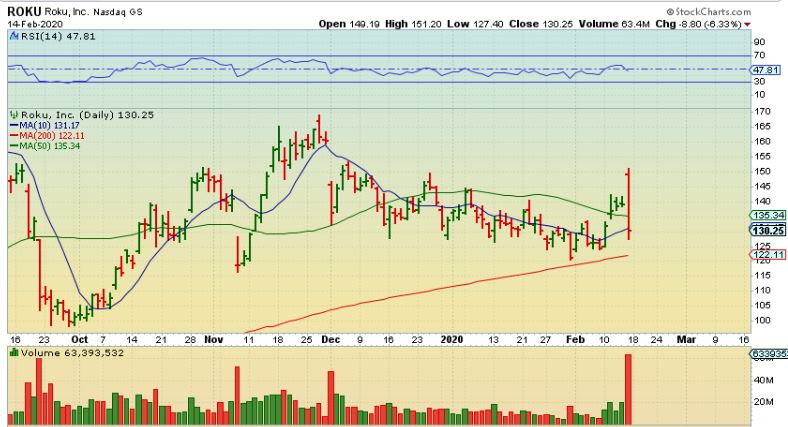
If you didn’t have a chance to see ROKU Earnings, I have seen this happen to TWTR, PINS, SPWR, and a few others. They gap open and draw in the bulls, and then sell off. ROKU had a big drop!
.
ROKU DAILY – I saw ROKU up $4 in after hrs with earnings Thursday, after forming a mini bull flag Tues, Wed., Thursday & closing at $139. I also saw that continue in pre-market too. The Bulls must have felt that they were missing a good run coming up, and continued buying the gap up pre-market, which was now up $10!! ROKU opened up $10 , ran to $151 after the open, and crashed down to $127. Why am I showing this? Things that look Very Bullish, like the General Markets, CAN change in a flash. Use stops.
,
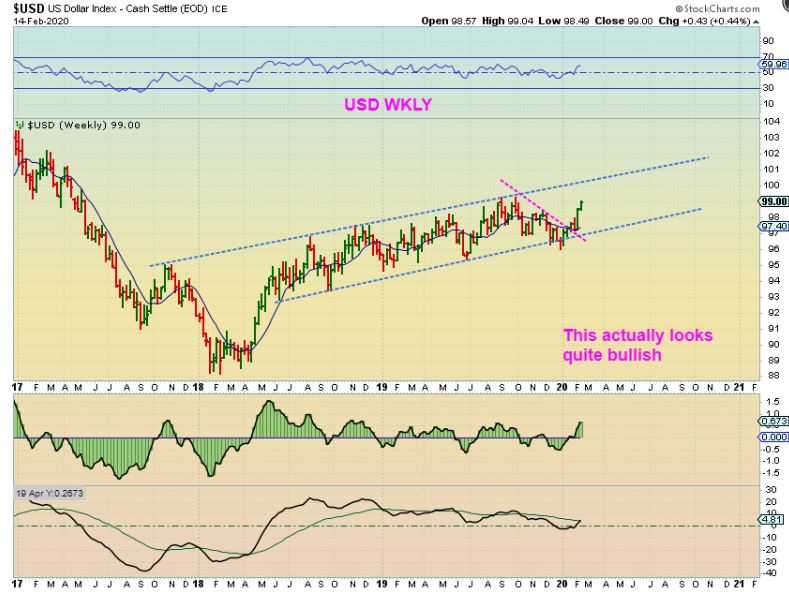
USD WEEKLY – When I look at the 3 month daily, the USD has actually been exceptionally strong coming out of this recent ICL. You can see that vertical move here in the weekly chart now too. This has NOT hurt Gold, but this actually is a bullish looking chart. I would expect it to run to the upper channel line. THAT MAY TRIGGER THE NEXT ICL FOR GOLD IN ARPIL OR MAY.
.
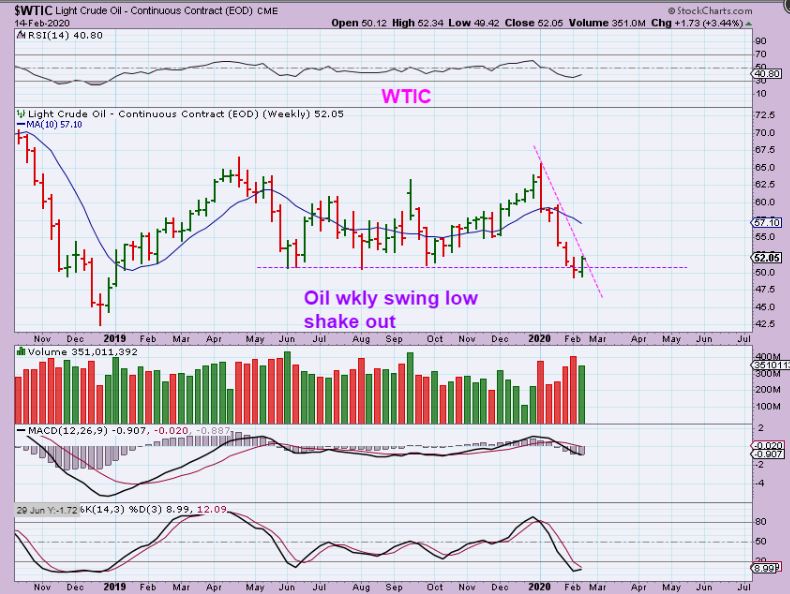
WTIC WEEKLY – Oil has a weekly swing low, but Oil stocks are not following yet for some reason. The XLE & OIH also have weekly swing lows, but the XOP made a lower low this week. I would suspect that Oil itself can run higher out of this shake out low. A stop placed under the recent low, and then gradually trailing higher could work, if someone felt like going long oil. We’ll see if the XOP can improve next week.
.
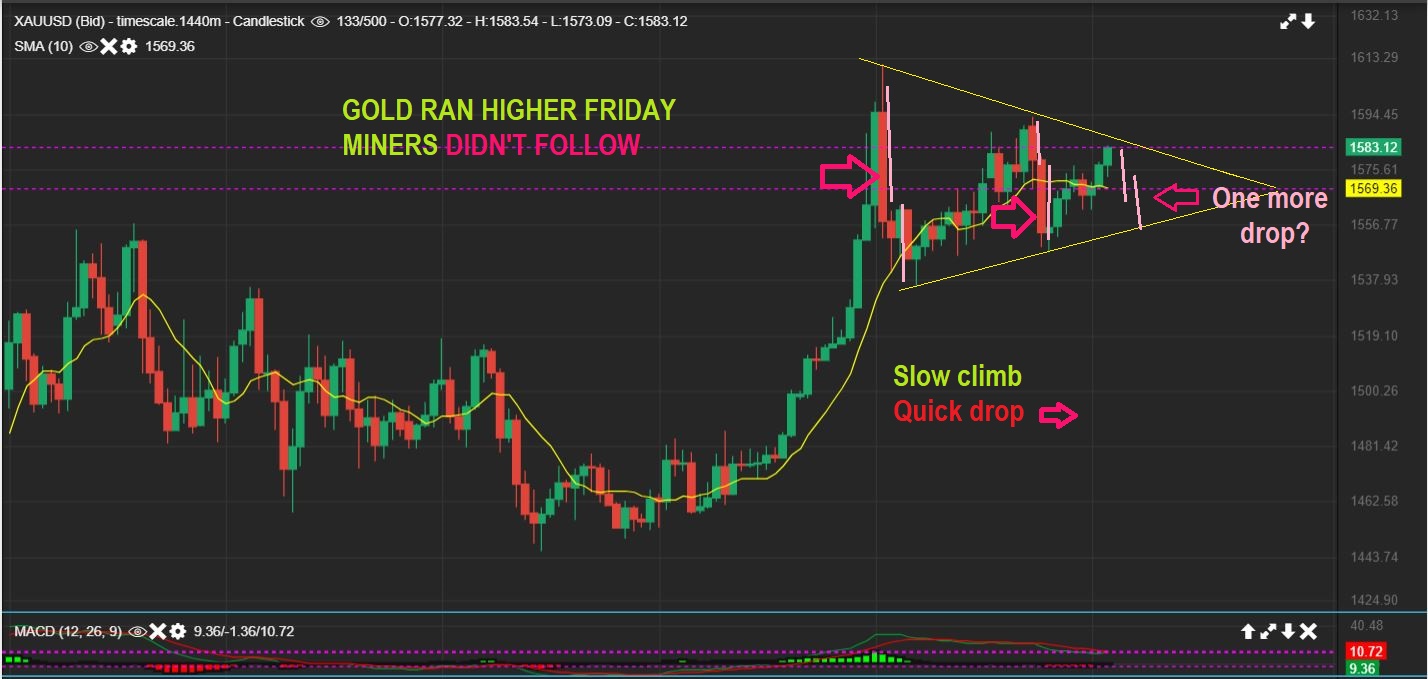
GOLD chart – Notice how price slowly climb higher, then Quickly drops! Can’t you picture one more drop in Gold here, like I have drawn? Triangles are repeating wave patterns often, so we could see Gold drop next week, and I personally will not be surprised. THAT may be a buy area before a break out higher. We’ll see.
.
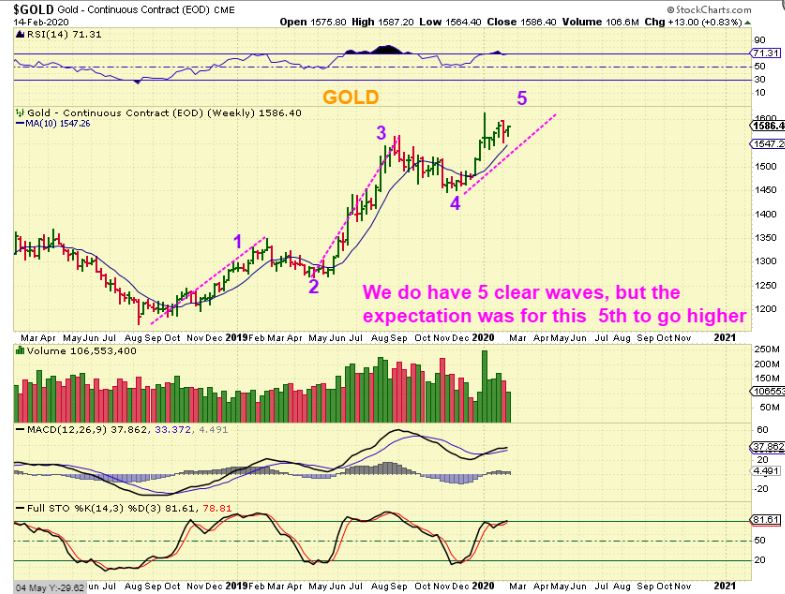
GOLD WEEKLY – If Gold pops & runs now, it may finish a 5th wave up. My thinking is that as time goes on, we really need miners to start following gold higher out of their choppiness. If they don’t, they could just gradually roll over into the next ICL. Not a steep deep drop, but a new low. Bull market ICls can be milder than the ones we saw in 2013, 2014, 2015.
.
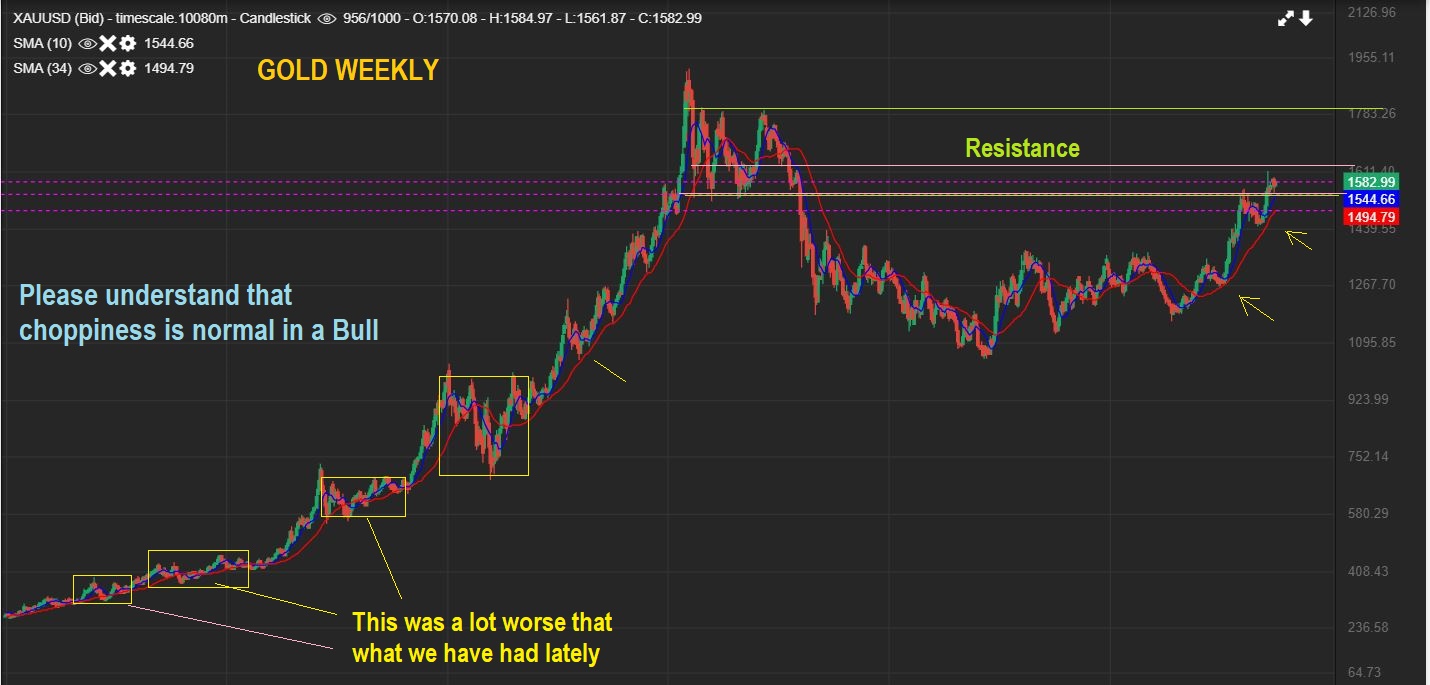
GOLD WEEKLY CHOPPY – Gold is choppy because it has reached resistance, as shown before. Choppiness is normal, even in a Bull market. Look at the yellow Boxes on the left. They are MUCH longer & more frustrating than the current tiny chop shown on this chart with the last 2 or 3 ICLs. Riding a Bull is not always as straight up as people think.
.
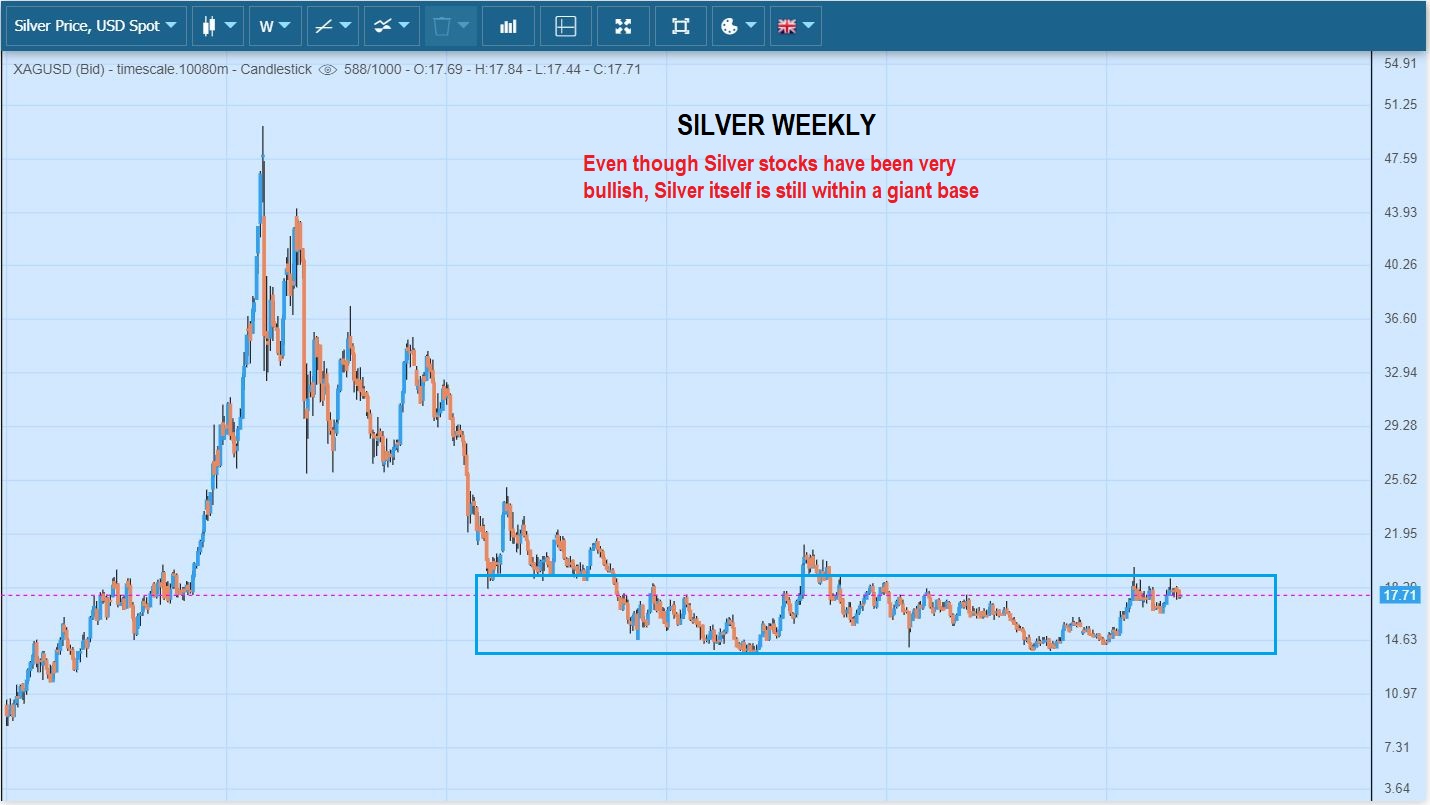
SILVER WEEKLY – Silver is actually still basing out. When this starts to run, Silver stocks could really catch another bust of energy. They have been leading Silver and have paused recently.
.
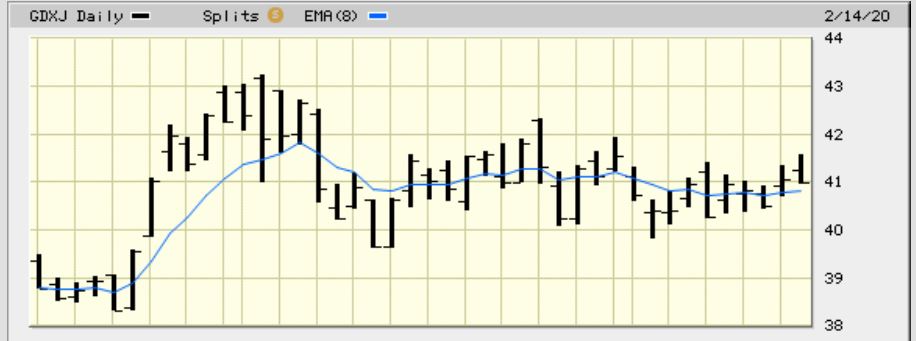
GDXJ DAILY – This is the chop. GDXJ has actually just been trapped in a range that is Roughly $2, from $40 to $42. If Gold does drop as mentioned, GDXJ could visit $40 again, and then Maybe we’d get our rally higher if Gold then breaks that triangle to the upside. This chop is not bearish, but those using options or leverage have felt the pain.
.
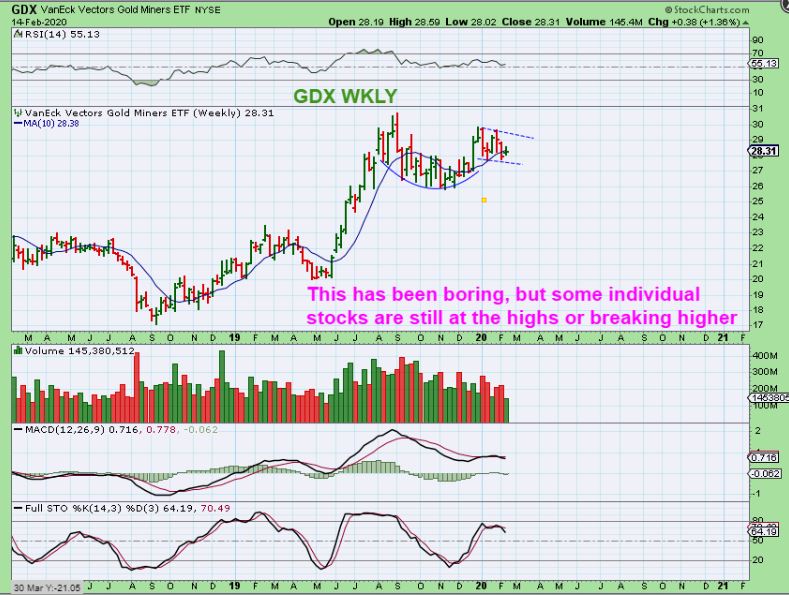
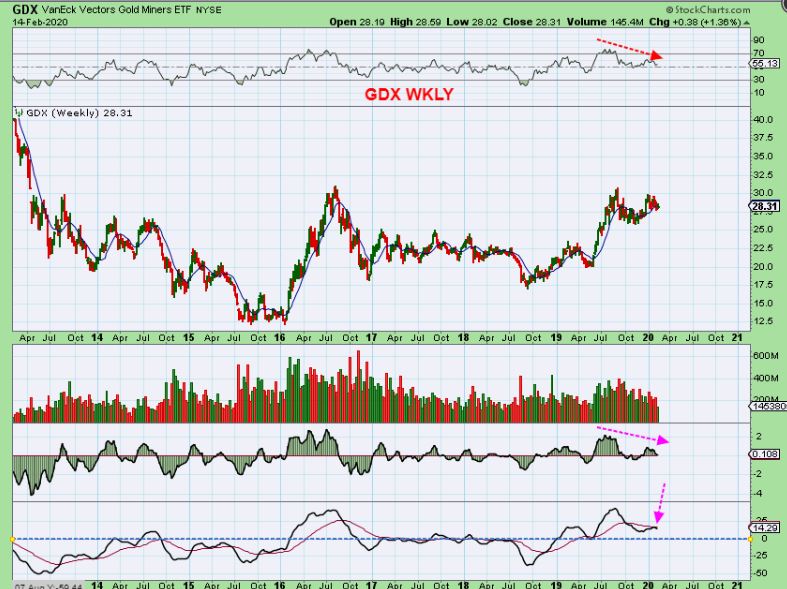
GDX WEEKLY – Long ago I called for this handle-like formation, but some individual miners have broken to new highs. Personally I don’t like this MACD set up, and we need to rally out of these lows soon to change it.
.
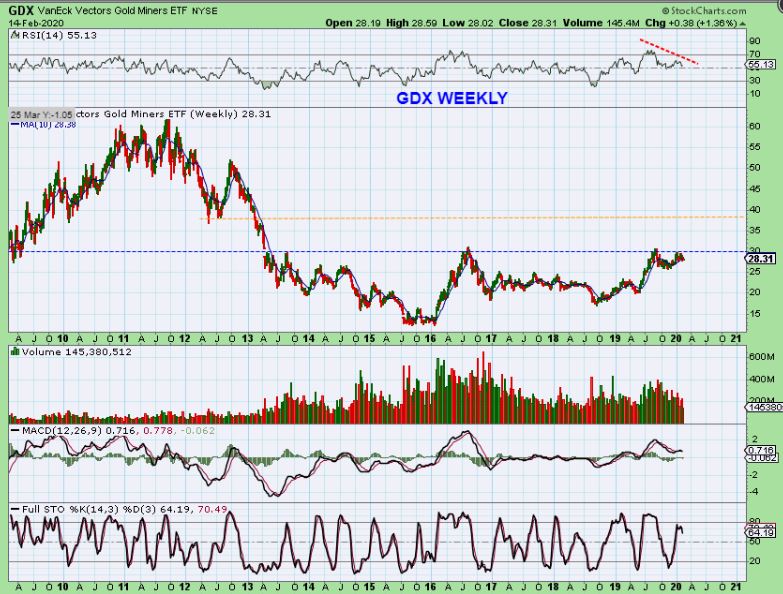
GDX WEEKLY RESISTANCE – This is why the chop has persisted.
,
GDX WEEKLY INDICATORS – The indicators indicate a lack of strength and the current inability to break out higher. They could improve with a break out rally, but time is starting to run out. If Gold drops this week, yet Miners can hold up a little, both could then rally out of their triangles, and that would improve this set up.
.
– The General Markets continue Higher.
– Oil seems to have bottomed, I see a weekly swing low in Oil, Xle, and the OIH. XOP made new lows.
– The USD rallied strongly out of an ICL, but that did not slam Gold down.
– Gold is chopping in a large triangle, but the Apex is still a little further ahead.
Note: Previous leaders like KL, SVM, HMY for example, are not the leading higher this time. They have been pulling back to the 200 sma area. With that thought, You want to look at Barrick (GOLD), FNV, AUY, ELYGF, EQX and several others that I have been pointing out. THESE are breaking to new highs this time as the etfs chop sideways. I do have the concerns that they may become the only ones that break out on this run, and that we continue a sideways chop into the next ICL for April or May. For sure, the sideways chop is boring, frustrating, yet can be productive for future rallies.
.
~ALEX
.
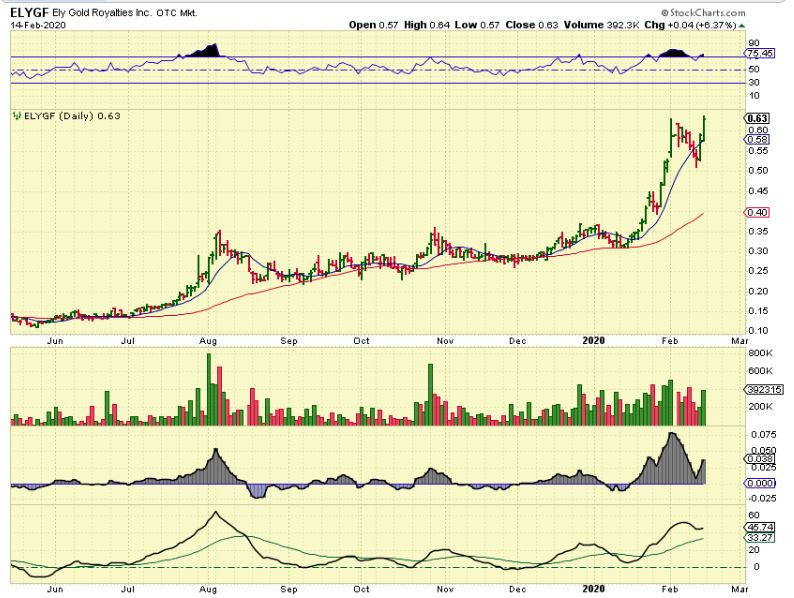
ELYGF is at new highs again and may be breaking out after consolidating that big January run up
.
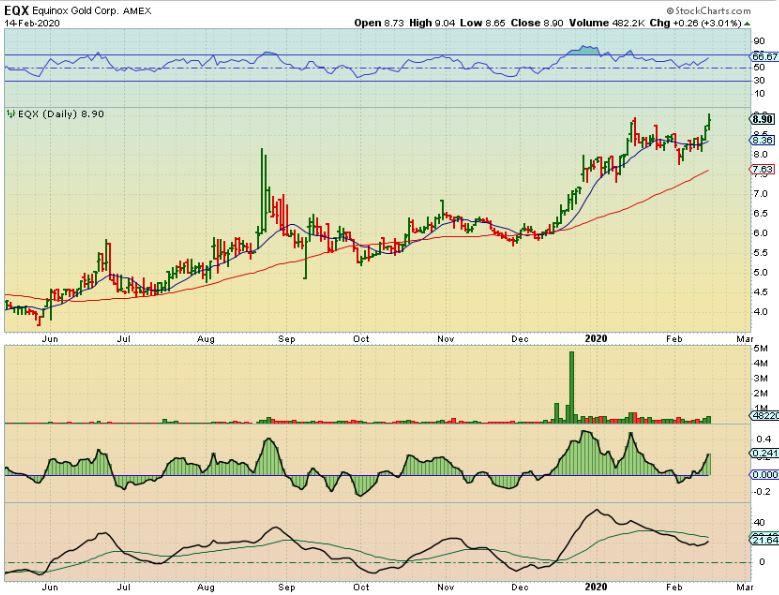
EQX is also breaking higher from a consolidation, so we are seeing former leaders pulling back and newer leaders emerging during this choppy time for GDX, GDXJ, and SILJ.
.
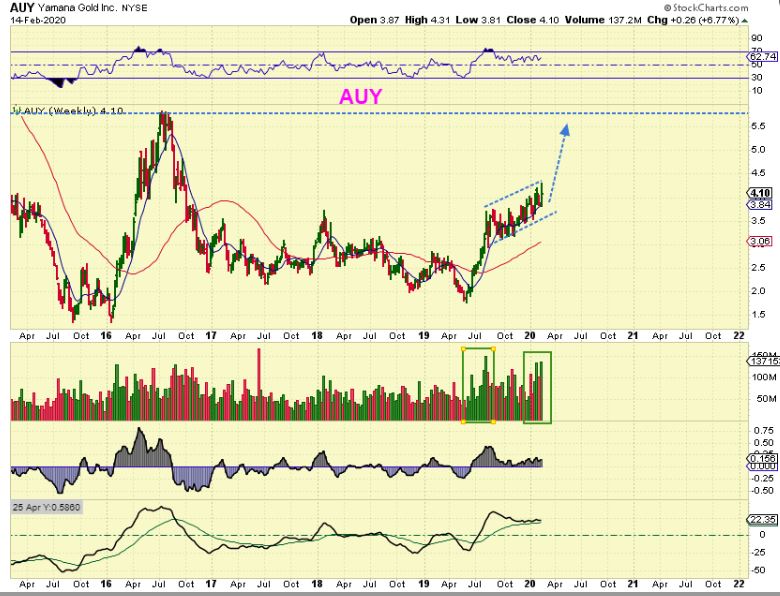
AUY WEEKLY – AUY hit new highs after releasing earnings, but what I have been saying about AUY is that it has been choppy with new lows as it slowly climbs the 50sma. AUY at the November ICL to now has been a choppy 30% gain. Not a bad buy & hold really.
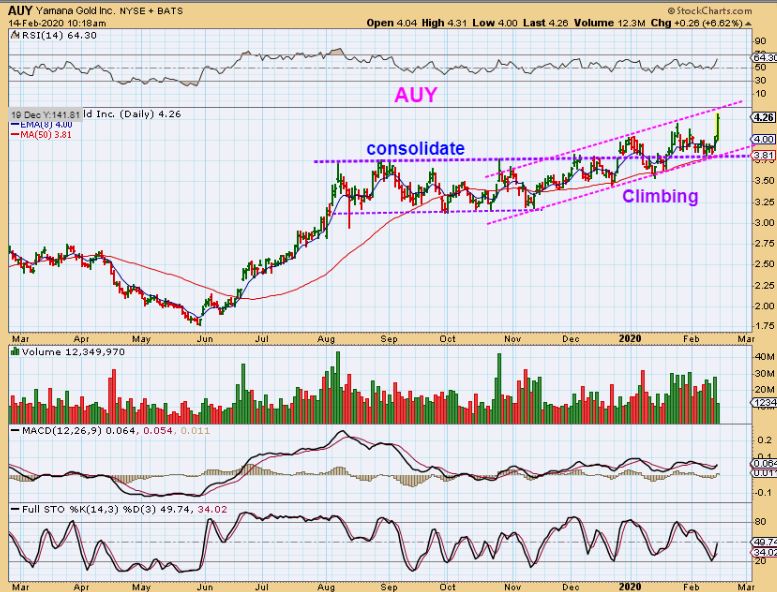
And after releasing earnings that were favorably welcomed, I would say that this climb can continue. It has formed what is known as a bullish running correction in the bigger picture. It is choppy, but pushing higher.
.
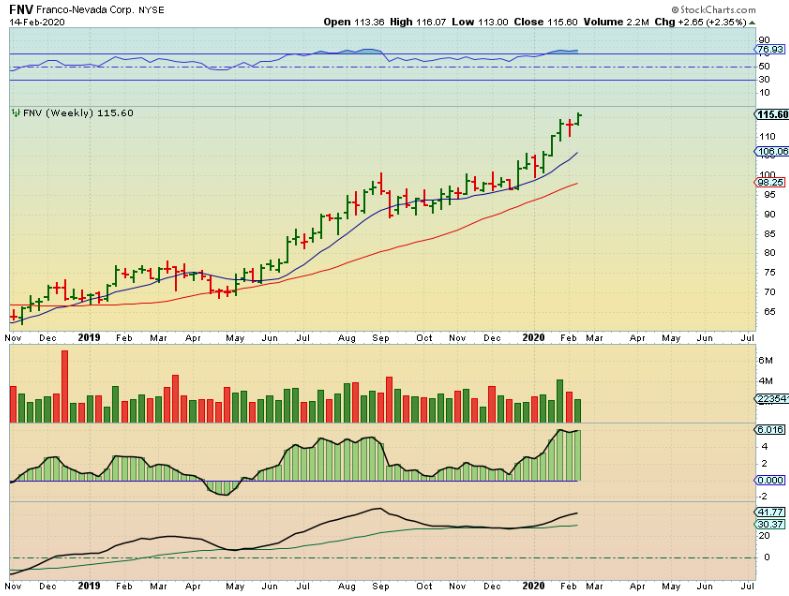
FNV WEEKLY – This broke to new highs in December, back tested the 10 week ma, and has also slowly been moving higher. The chart is obviously bullish.
.
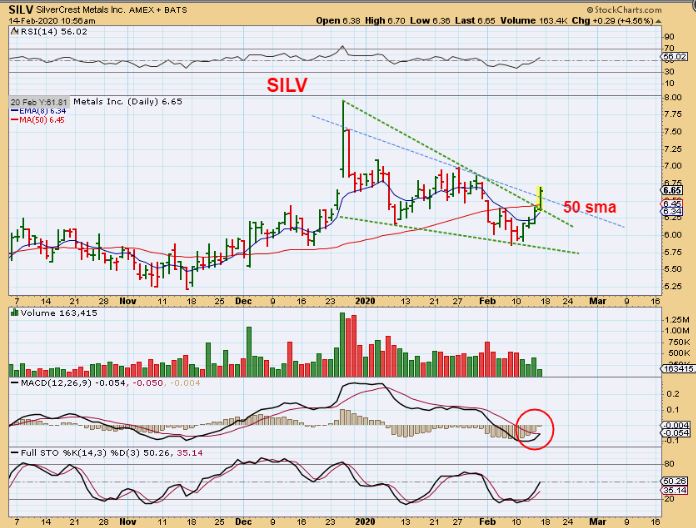
SILV DAILY – I noticed that USAS & SILV started to improve this week too, so that is a good sign after most Silver stocks took a dip. SILV is actually an EXCELLENT Big picture chart, running $1 to $8 and then consolidating here. It broke the 50 sma Friday an hour into trading.
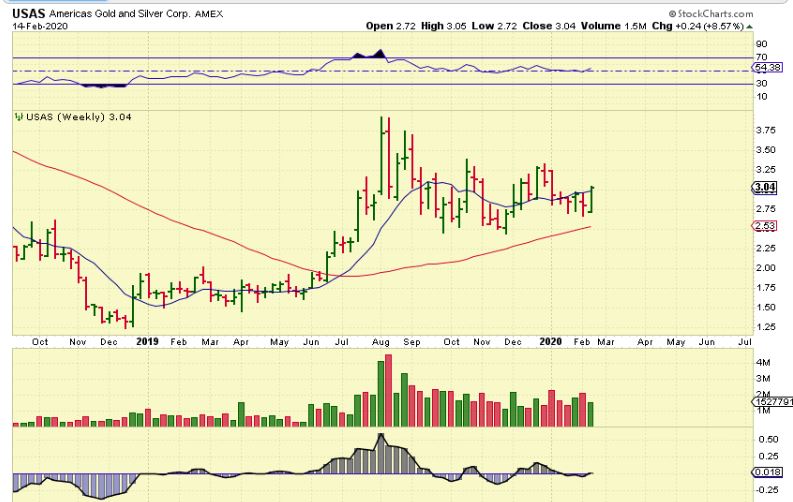
USAS – This is actually a Bullish set up on the weekly chart too, so Silver stocks might be preparing to join the push higher again. This is a Buy, but it could remain a bit choppy too.
.
SO THERE ARE SOME MINERS HITTING NEW HIGHS AND SOME ARE STILL LOOKING LIKE THEY ARE SETTING UP BULLISHLY. IF YOU ONLY RIDE THE ETFS, YOU ARE ENDURING CHOPPY SIDEWAYS ACTION.
,
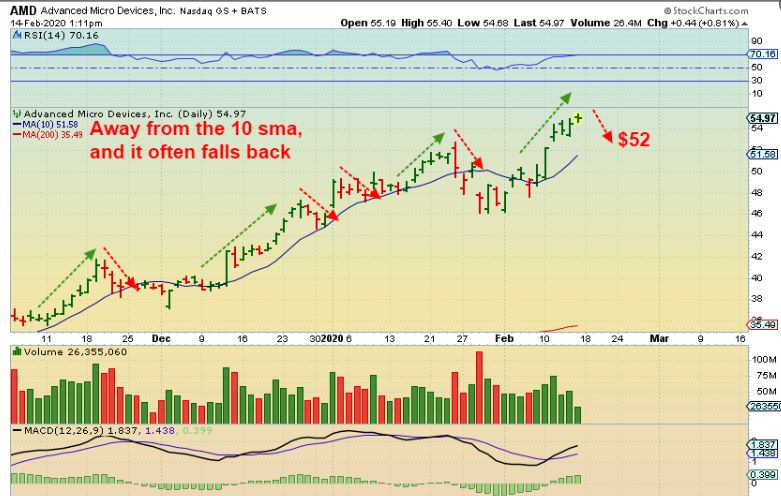
SIDENOTE: AMD DAILY – I DO NOT RECOMMEND OVER TRADING THE TRADES MENTIONED, however as a trader, I do occasionally exit & try to re-enter my trades later. AMD often gets above the 10 sma & then goes sideways or drops back to the 10 sma, so I took this trade from $50 to $55 and locked in gains. If it drops, I’ll re-enter, but it may just run off higher if these markets go parabolic.
.
THE BIG SURPRISE FOR MOST WILL BE MY VIEW ON THE MJ SECTOR
.
Recently I discussed that, even though the MJ Sector is choppy, it could be a ‘bottoming process’ for many of the companies that have been selling off drastically. Once loved, now hated, the bottoms may be forming, so I want to discuss that again briefly. KNOW THAT AT THIS POINT, THE SECTOR IS CHOPPY , HARD TO RIDE OR TRADE AT TIMES, AND MAY NOT BE FOR EVERYONE UNTIL THEY START TRENDING HIGHER. This is just to show you what I am looking at going forward.
.
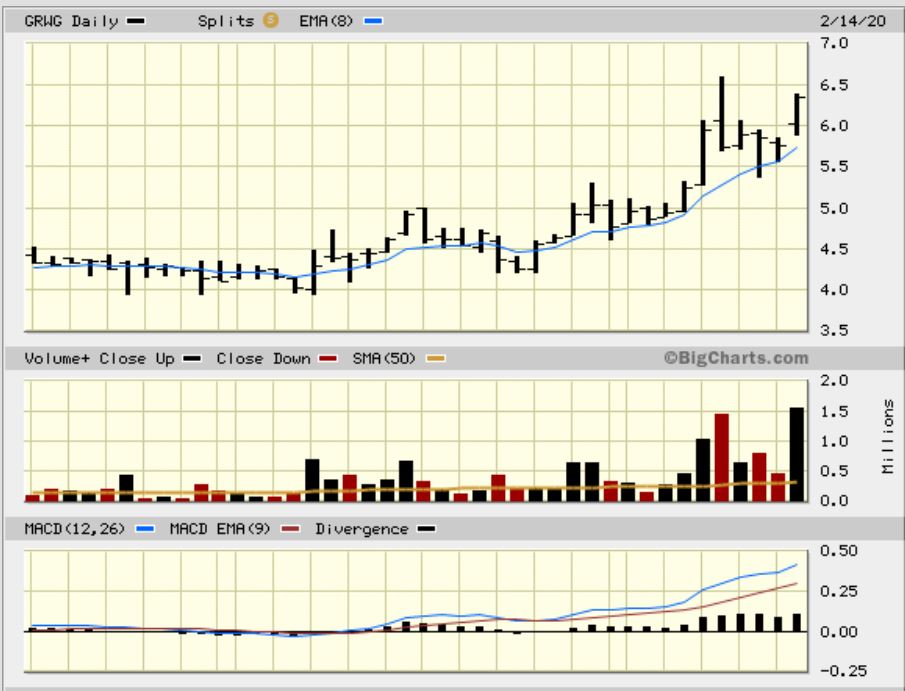
GRWG DAILY – I have discussed that GRWG showed good earnings and was rewarded with a slow uptrend starting. It closed up 11% Friday. It is the Big Picture that I have been pointing out…
.
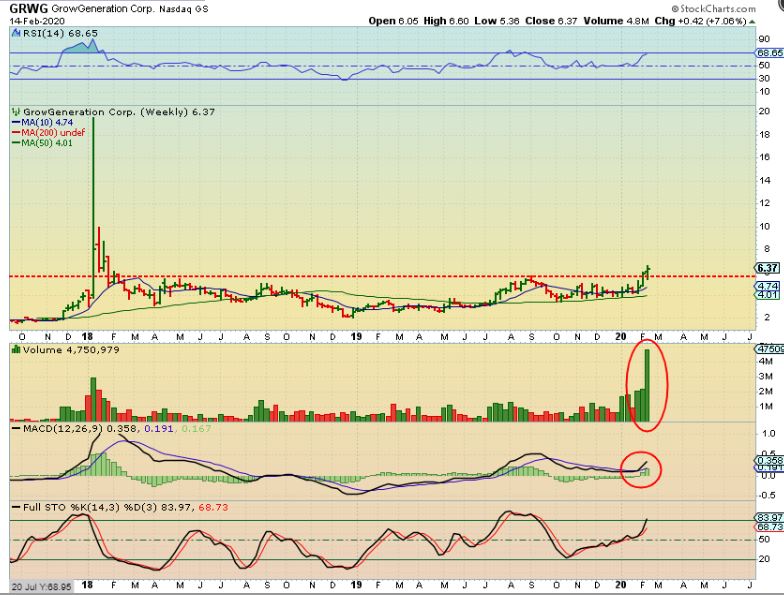
GRWG WEEKLY – After bouncing off of the 50 week MA repeatedly, while others were breaking to new lows, we now have that break out that I was hoping for. It may or may not run straight up, but this will likely be much higher a year from now, since it has a 2 year base to break & run from.
.
LET ME WALK YOU THROUGH MY THINKING ON CGC
.
CGC DAILY – I pointed to CGC when it shot out of the lows in November. It has been chopping rather violently, but I used this chart to show that it was actually still putting in higher lows. Moving above the moving averages was what would be the next possible bullish move, but earnings were ahead. Caution was warranted.
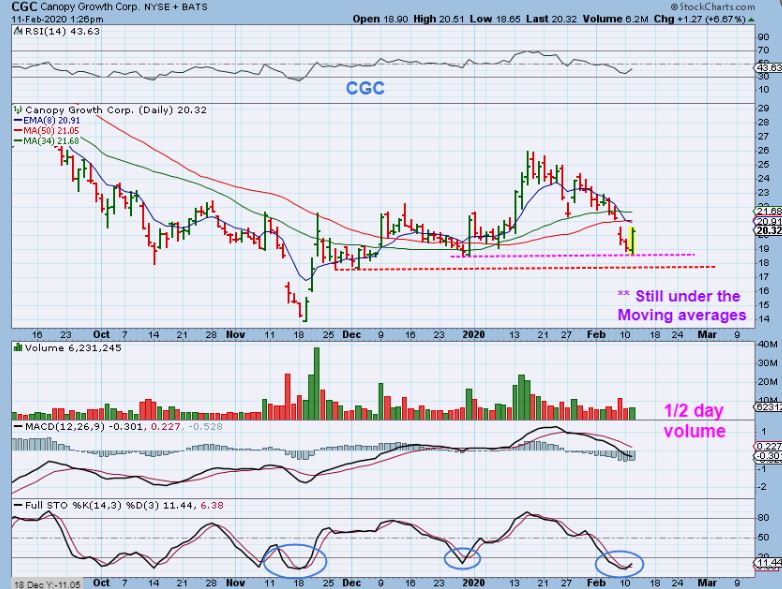
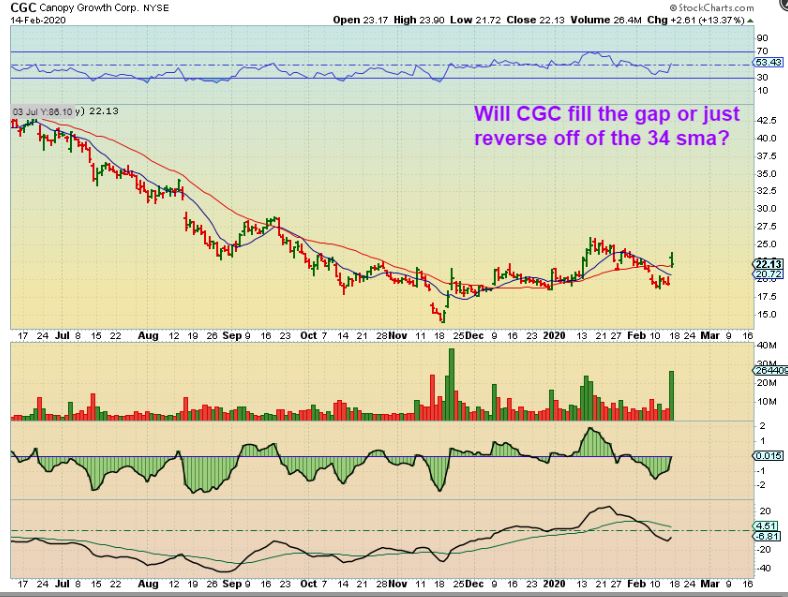
CGC DAILY – 3 days later ( Friday) earnings came out and CGC gapped up 20%. The whole sector actually gapped up in reaction to CGC earnings. This is very promising that the lows are actually in, but this chart was drawn Friday morning to show that it could drop to the 50sma & gap fill and then run, or it may just take off. Either way, it looks oversold and should eventually make a run..
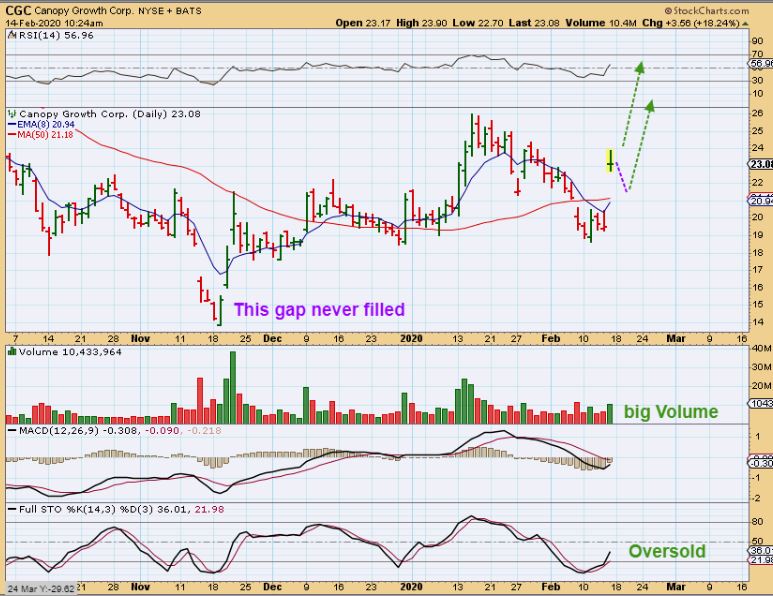
CGC DAILY – CGC closed with the drop to the 34sma. Big Volume. Still oversold. It does NOT have to fill that gap, but it might do so. If it fills it and reverses back over the 34 or 50sma, I think that is a buy, because…
,
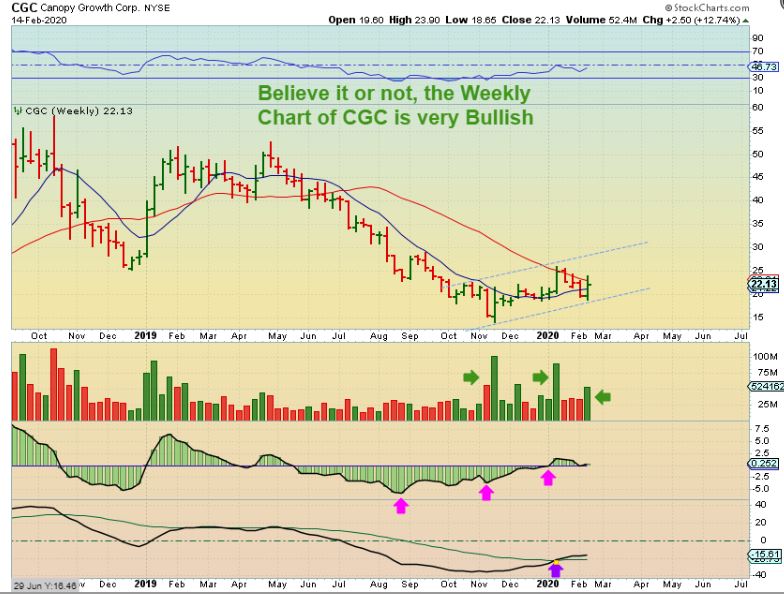
CGC WEEKLY – This weekly chart is really just about as bullish as they get. It may be choppy on a daily basis, but I see CGC making great gains after getting above the red line. Over time I think that the $14 low is going to look cheap 🙂
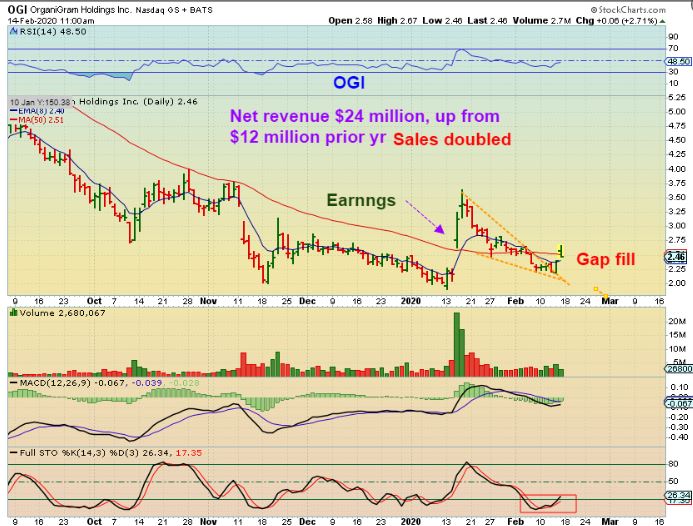
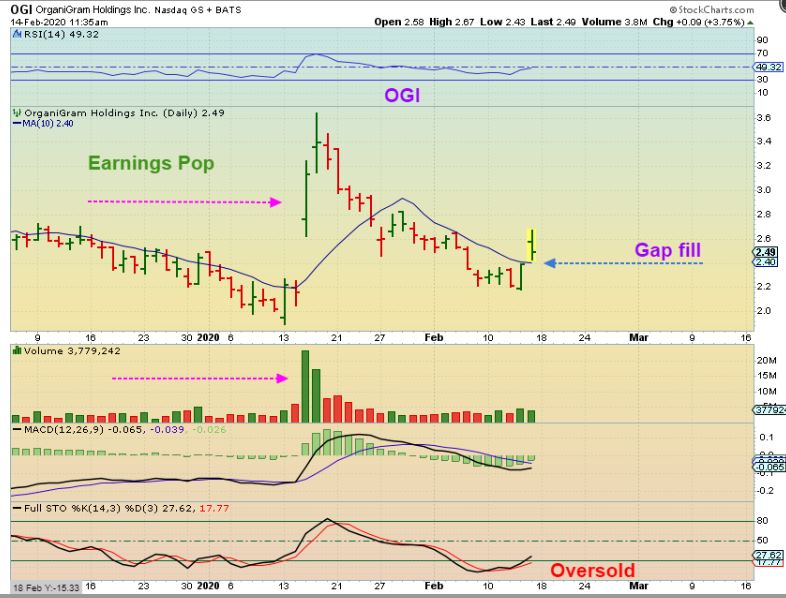
OGI DAILY – So I was watching OGI all morning, because I remembered that it POPPED when it released earnings in January. I see a bullish descending wedge break out. It gapped open with CGC and I said in the live area that I was buying when it gap filled. I drew this chart from 11 a.m. Read the chart for details as to why it popped in January.
OGI DAILY – This is a close up at 11:30. I Bought that Gap fill , volume was excellent, and now I needed to see a reversal higher. How did OGI close?
.
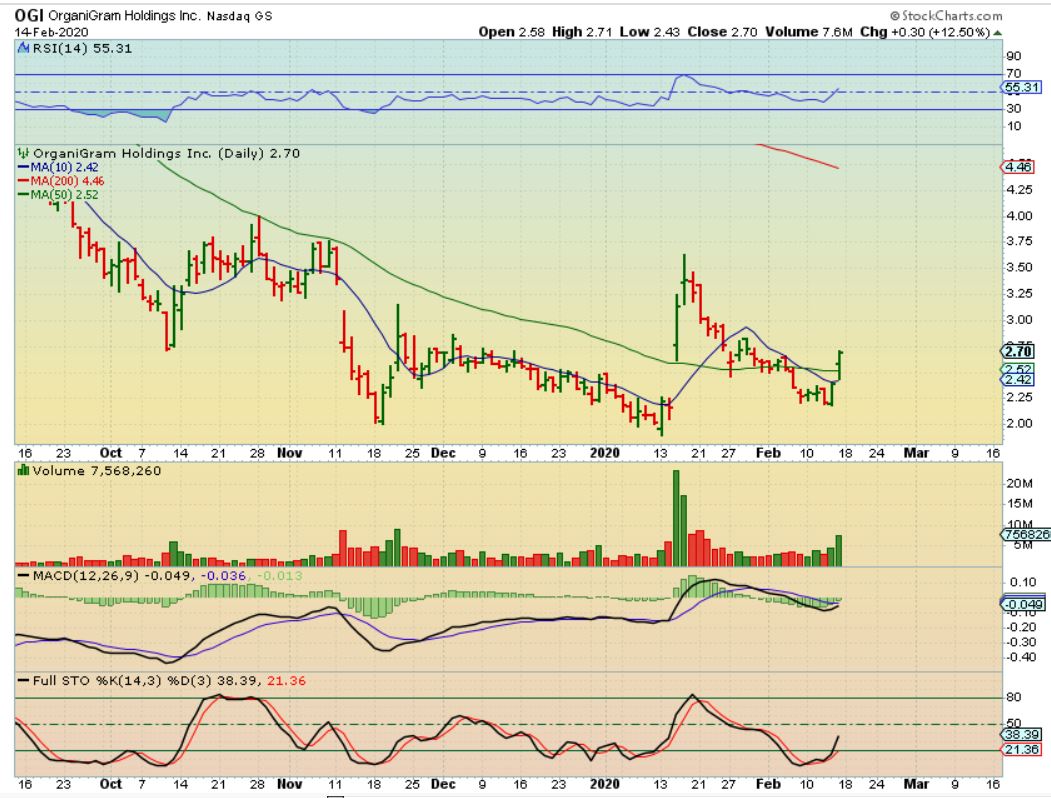
OGI DAILY – Organigram flipped upward and closed up 12.50%. THAT is really bullish Action and let me show you why this is a buy to me….
.
With OGI, we have …
1. This was an earnings Pop of about 100% in January
2. Then it gradually sold off to fill that gap. It is filled.
3. It then gapped over the 50sma, filled that gap, and closed back at the highs Friday
4. The MACD & RSI look set to cross upward. It could be choppy, but this looks ready to go.
5. This is still oversold and now has a higher low above Januarys lows. I’m in.
.
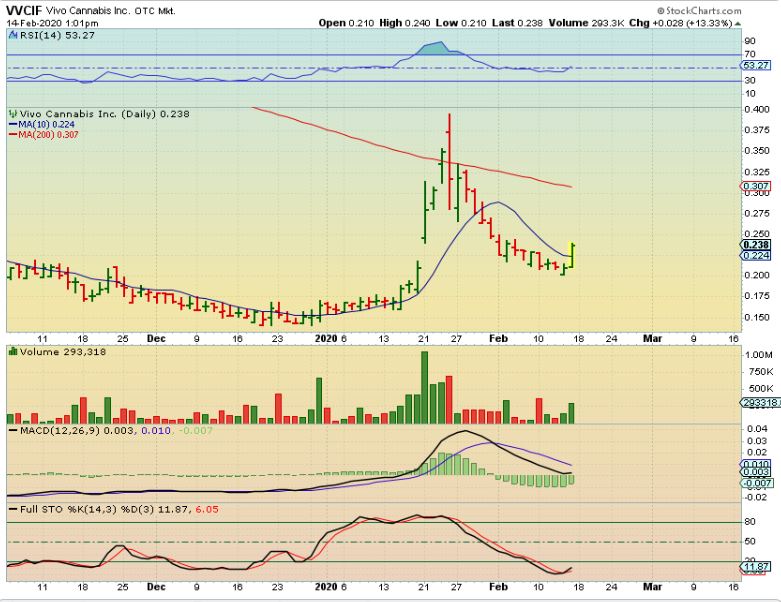
VVCIF DAILY – I also saw VVCIF and many others start to reverse & put in a higher low after filling a prior gap. This was captured midday when it went from 21 to 23 cents, and…
.
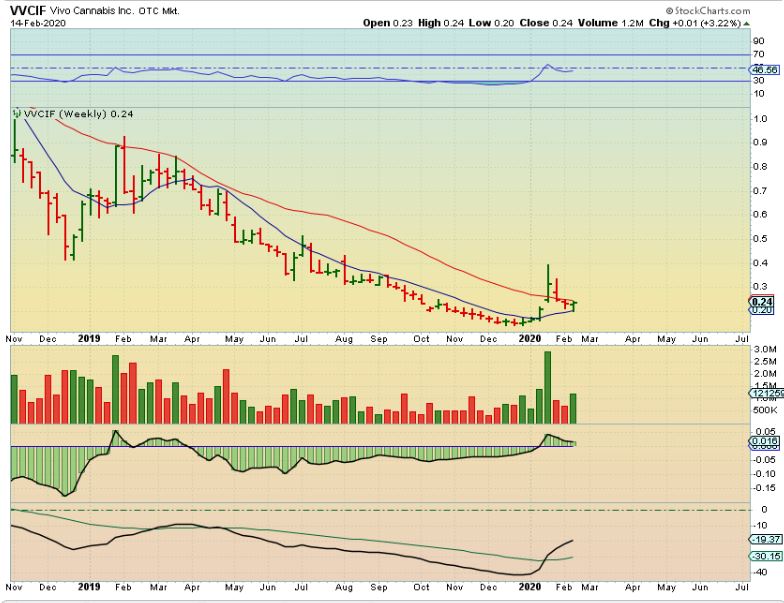
VVCIF WEEKLY – Vivo closed at 24 cents and the weekly chart bullishly reversed off of the 10 week ma.
.
.
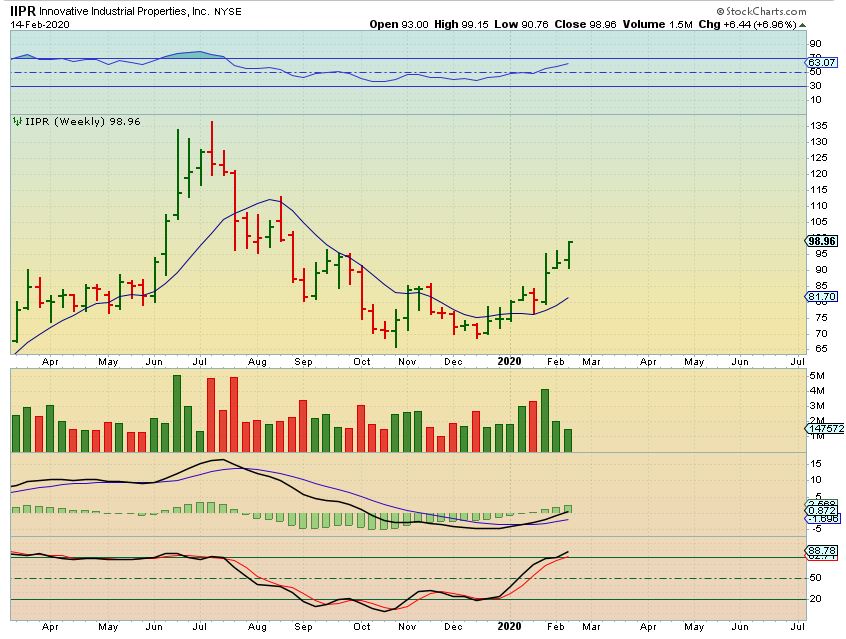
IIPR WEEKLY – You can see that IIPR already put in the lows in late October after selling off from $135 to $65. It regained the 10 weekly ma , back tested it, and is now moving higher.
.
I see MANY MANY bullish looking charts in this sector, and they look to be forming bottoms, so I will continue to cover it. The upside potential can be big in this area, but will they run straight up or be choppy? please know that the choppiness and way that these can swing widely may not be for the investor or trader looking for a nice smooth ride higher. We’ll see how it plays out, but I am in GRWG, OGI, EDXC , and may take another position soon. I traded a few of the smaller ones and they also seem to be trying to bottom ( CNBX, CBDS, NUGS, EDXC, etc) . As I mentioned in December, It may be choppy, but these look like they are putting in their lows. If you are seeing what I see and are interested in a position, it may be best to just start small and see how it goes. One more thing…
.
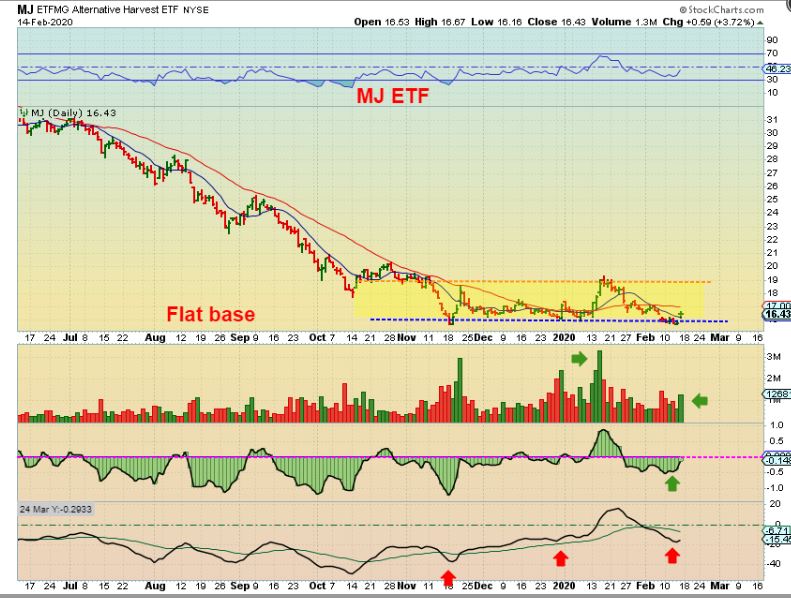
MJ ETF DAILY – Not an easy ride, but the ETF for this sector also seems to be bottoming too. We saw it run from $15.66 to $17.66, then it dropped back to $16 & ran to $19. Now we have a reversal back at the lows. A run to $19 may be next, you could also just take a short term trade from $16 to $19 & sell. What about the weekly?…
.
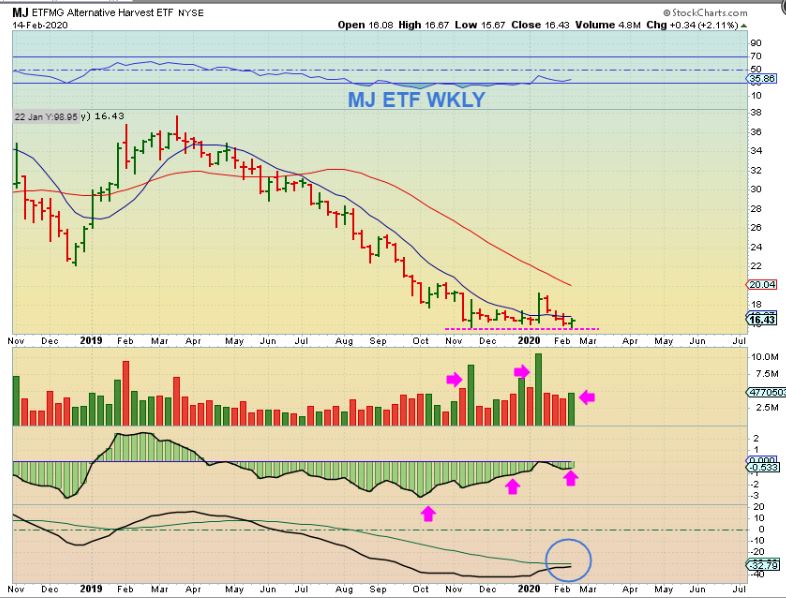
MJ ETF WEEKLY#1 – Using my indicators, this does appear to be forming a bottom. Another view is..
.
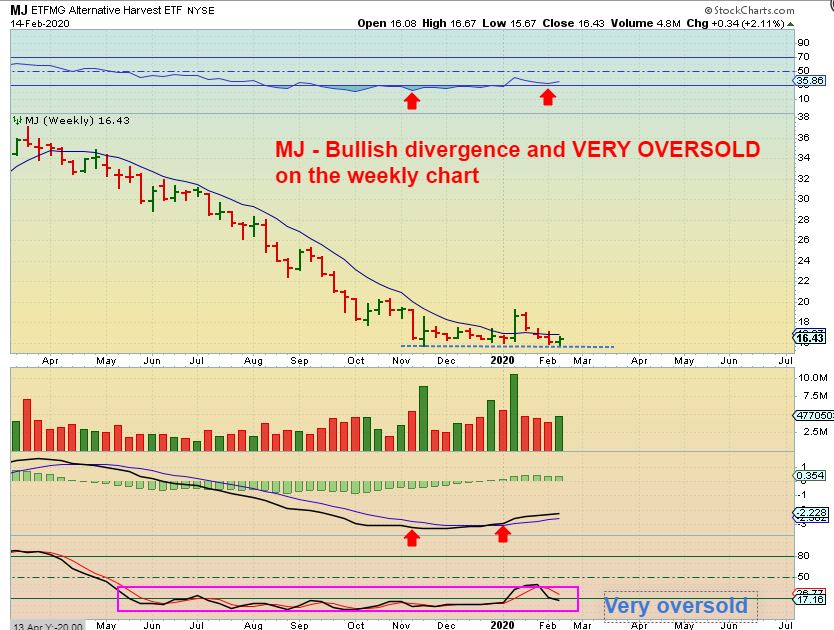
MJ ETF WEEKLY #2 – This is with standard RSI, MACD, & STOCHASTICS setting. This is extremely oversold, yet we see a weekly MACD cross as it bounced along the lows.
,
Again, this sector can be bumpy, but I feel that it was extremely hated & got a bit overdone to the downside. It now looks to be bottoming. I have seen a few earnings releases cause a major POP in the stocks. The decision that you have to make if you are interested in this sector is controlling your risk. It can look like a tempting sector with big potential upside, but BEFORE investing money, I advise that you think about controlling your risk ahead of time.
You can do this with stops under the recent lows, but also by controlling your own position size, right? Let’s say that you put 5% of your account in CGC, MJ, or OGI for example. If you get stopped out, you wont even lose 5% of your account, you would lose a fraction of that 5%. On the other hand, if someone decided to try a ‘get rich quick’ trade and puts 40% of their account in, hoping for that CGC $15 to $50 trade, there is obviously higher risk to that account. To that person, I would simply recommend controlling risk by preparing for the possible unknowns. Why not start smaller, and only start with a company that has its earnings already out, and one that had a good reaction after the release, or the ETF. Then if it starts to trend higher out of the lows, you can add on each dip to the 10sma. Risk is controllable and it helps to prepare for the unknown and control position size. You may only lose a fraction of your total investment, but if it trends higher, the gains can add up.

