
February 8th – The Weekend Report
Happy Weekend to all. I have collected roughly 20+ charts to try to tell the story of the markets this week. Some of the sectors still seem a bit hazy & directionless due to the recent choppiness that has prevailed and continues to now. Since we have discussed the various possibilities repeatedly already, I am going to try my best to just be brief and to the point with each chart. Then we can just watch how things play out next week for more clues. To the charts!
.
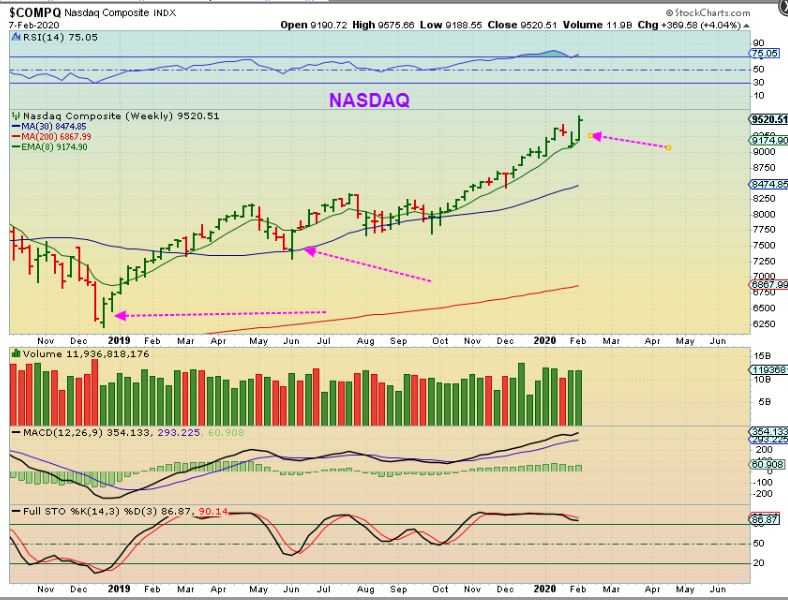
NASDAQ – We see a bullish weekly candle out of the DCL. Price reversed at the weekly 8 ema, so it remains bullish.
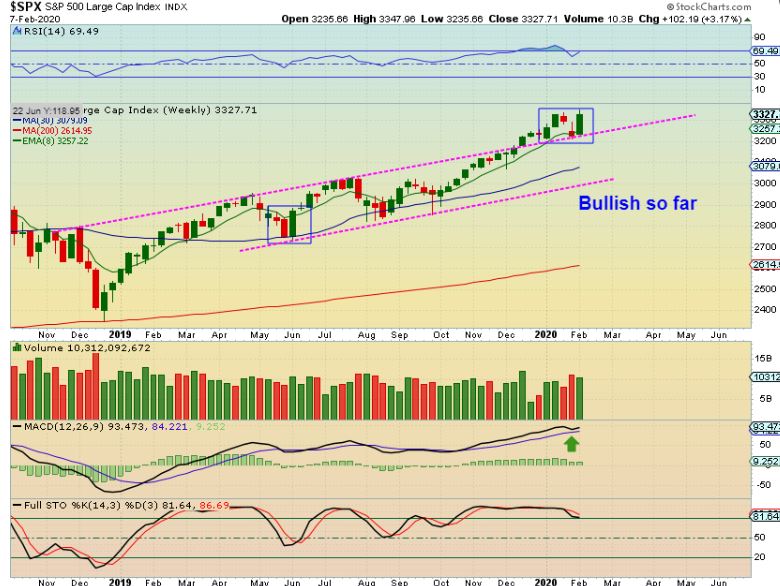
SPX WEEKLY – The SPX sold off Friday, but the weekly chart is bullish.
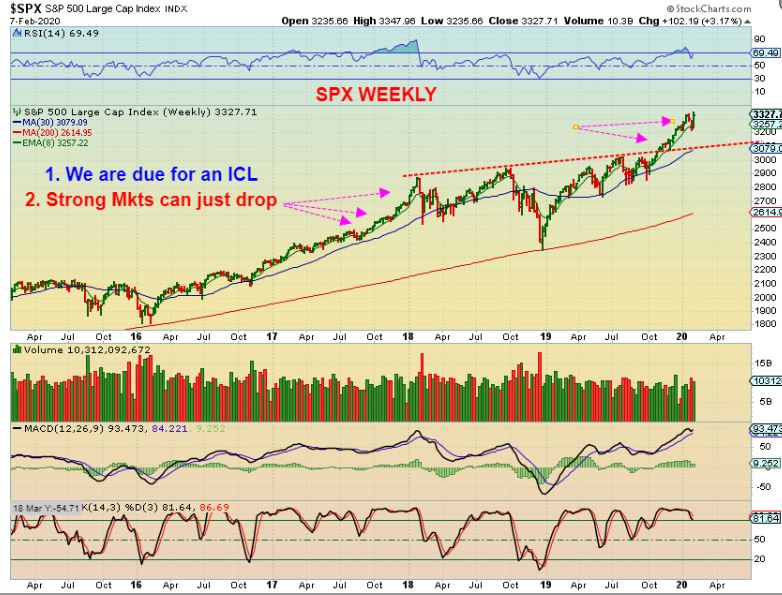
SPX WEEKLY – A strong market running in a steep manner can go parabolic into a blow off top, but when an ICL comes due, they can also just roll over. As discussed in many prior reports, Since we are in the timing for an ICL, anyone long would gradually raise stops on the daily charts.
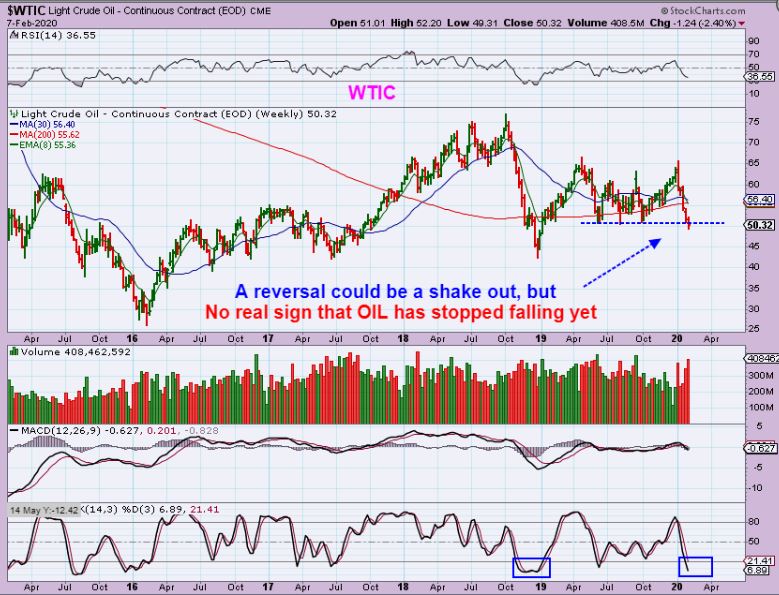
OIL WEEKLY – A reversal candle would be bullish, but we got a DOJI instead. That is a candle of indecision, so next week is important for oil. Can selling continue?…
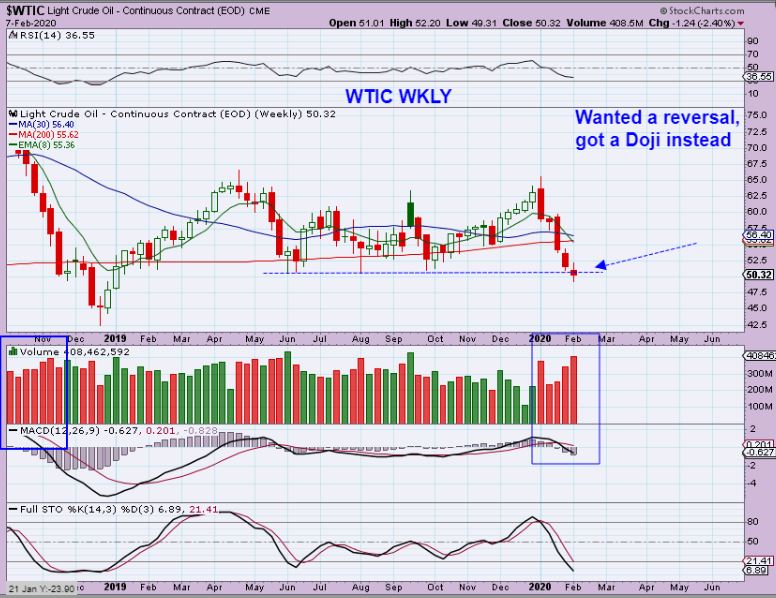
OIL WEEKLY – We broke the lows , so it may become a quick shake out, or…
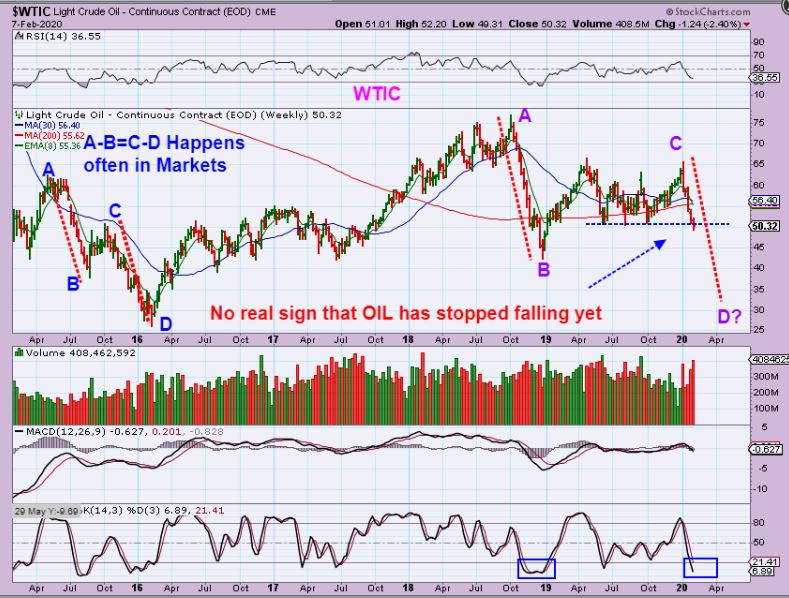
OIL WEEKLY – It is not out of the question that Oil could continue to drop after a brief pause, back to 2016 lows, as shown here. For now, I am thinking that Oil just remains sideways & choppy like 2016-2017. Timing-wise a dcl is due.
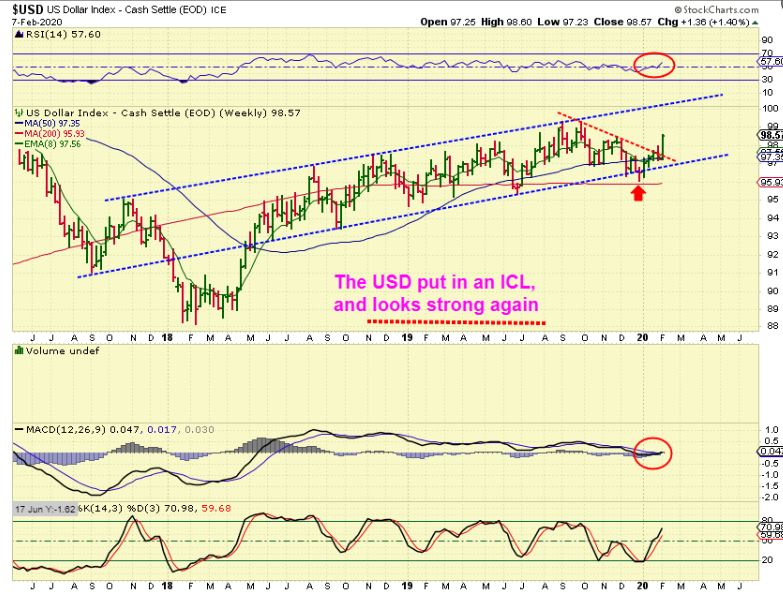
USD WEEKLY – A couple of weeks ago I mentioned that I thought the USD put in an ICL. It had a big surge this week above the 50 week ma. This move has not crushed Gold, but I’m sure it doesn’t help.
.
NOTE: It is becoming more obvious as time goes forward that something is not quite right with this sector. Why do I say that? Simply because GOLD is doing what we expected, but it is not in sync with SILVER. Also both GOLD and SILVER are also not acting in SYNC with the Miners. They are charting out 3 separate paths, and now even individual Miners are doing different things ( some very Bullish and others look more bearish), so this is a more recent change that needs to be addressed. I will start by saying that the longer that this mixed picture plays out, the less clear things will get.
.
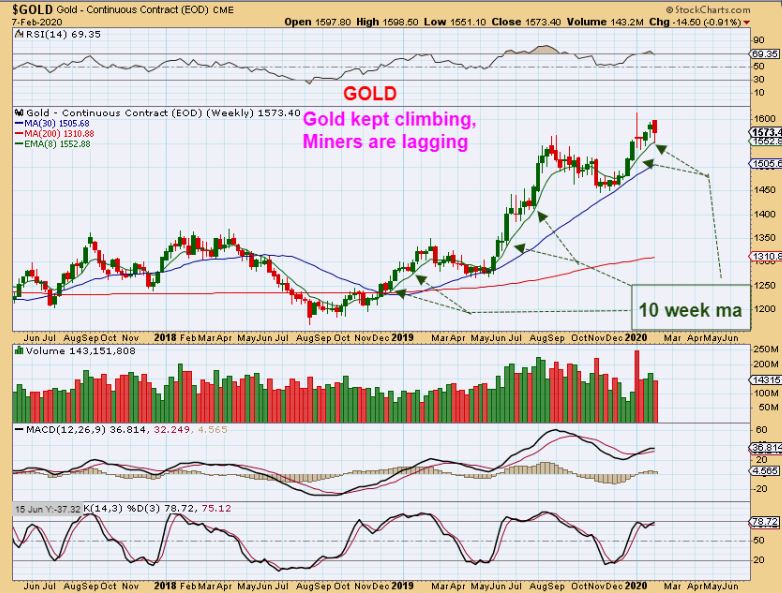
GOLD WEEKLY – Notice Gold is obeying the climb at the weekly 8 ema. That is a bullish characteristic as it pushed to new highs 4 weeks in a row, but notably- Silver and now Miners are not following. They are choppy and that gets more concerning the longer time goes by.
.
GOLD WEEKLY – Now that Gold did as expected and made new highs, this could easily become that 1-2-3-4-5 complete, and then an a-b-c correction would lead to the next ICL. Sadly Miners did not follow to new highs yet.
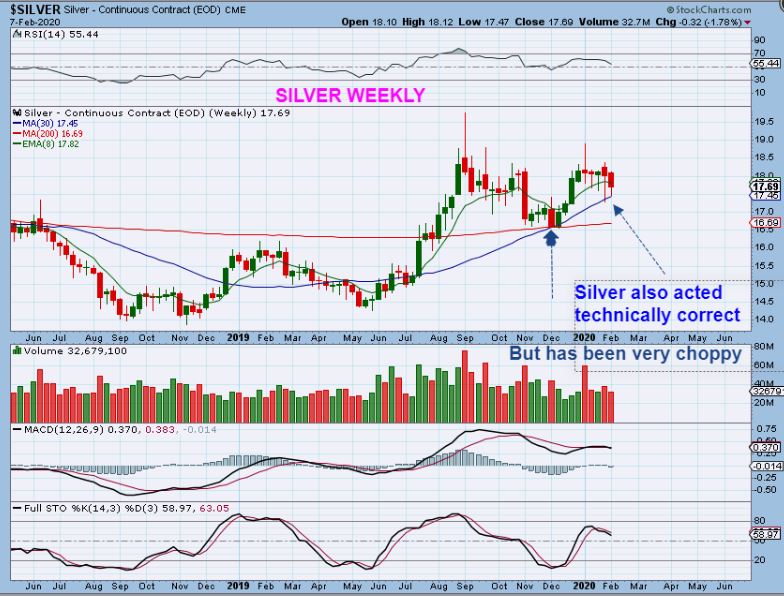
SILVER WEEKLY – Silver is also acting bullishly, but it has been very choppy and sideways. This can continue and frustrates the Silver bulls. Silver stocks seem to be dropping to the 200sma one after the other.
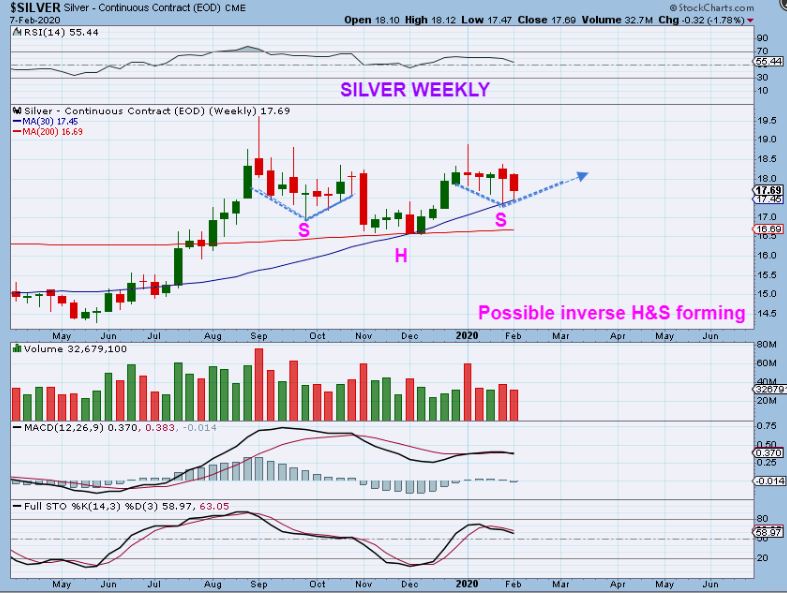
SILVER WEEKLY – I can picture this chop continuing and forming an inverse H&S as shown, since Silver seems to have a dcl in place .
.
For the Miners, we are now seeing individual Miners acting differently from each other. After a good earnings report, Hecla Mining became very strong. ELYGF, BALMF, NEM, DRD, and a few others are at the highs again this week, but others look to be dropping down to their 200sma. HMY, KL, &SVM, as examples, were beautiful charts that have broken down. I will discuss that later. The longer this chop sideways continues in GDX, the more the upside chances are threatened and the dip into the next lows will become more likely ( Time runs down). I will continue to cover this sector daily, but for this report I am just showing Big Picture possibilities. I will show the Good with the Bad.
.
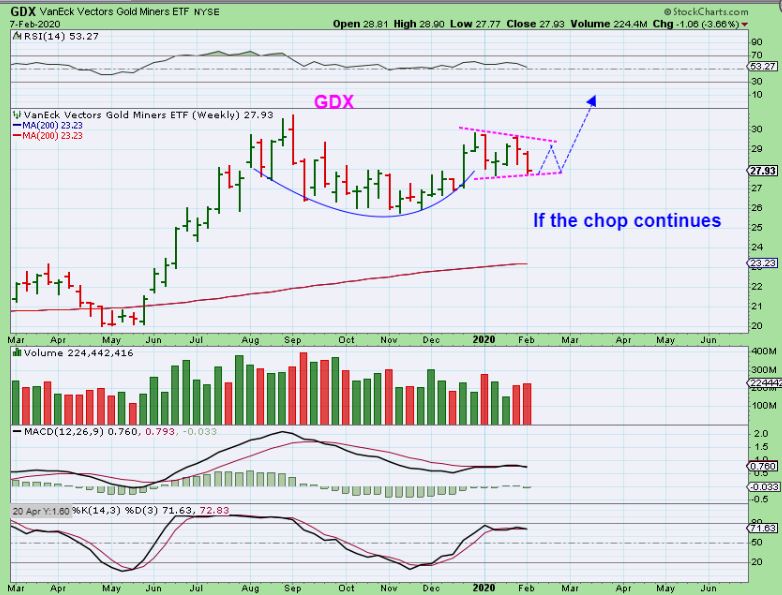
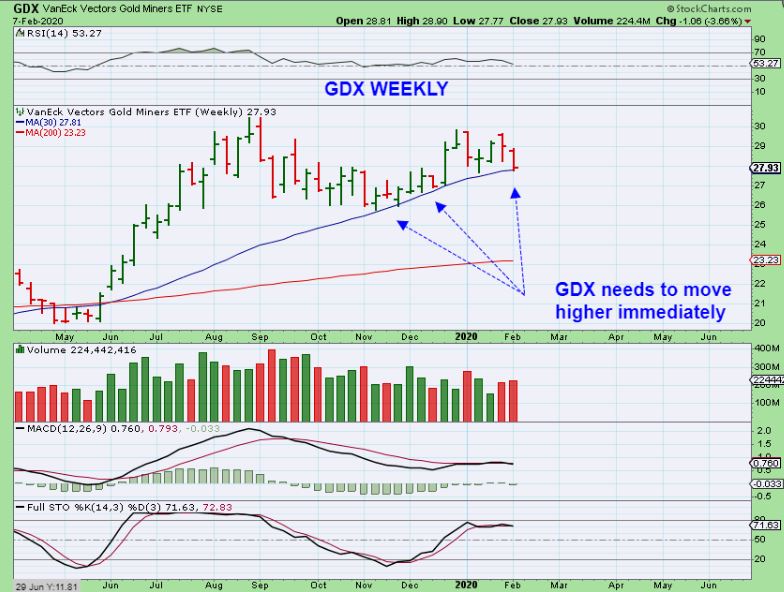
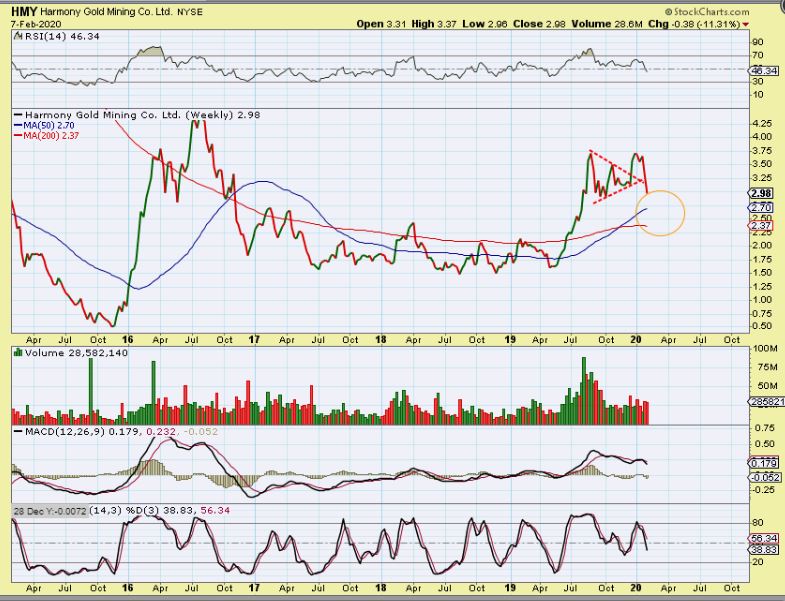
GDX WEEKLY – This would be that cup & handle scenario, and it is still valid. This is bullish, but time is running out & since Gold is at new highs, this is lagging. The other problem is that some other cups ( like HMY) have broken down. THAT COULD BE A WARNING, SO CONTINUE TO USE STOPS.
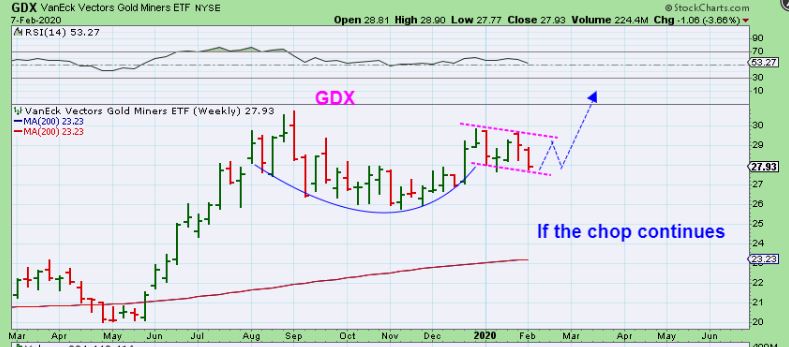
GDX WEEKLY – Same idea, but the drop this week would have to stop & a bounce would need to come in next week. GDX needs to bounce NOW. Further downside ruins the cup & handle if you ask me.
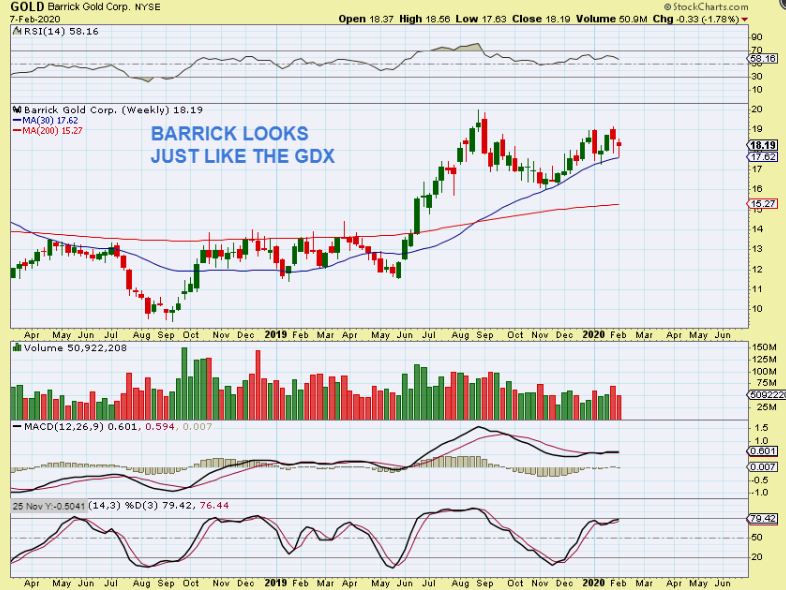
BARRICK WEEKLY – If Barrick drops to the 200 sma, GDX could drop too. The charts are almost identical.
GDX WEEKLY – Zooming in, I need to see GDX stop dropping now. It is on the 30 week ma. I would say that next week is ‘Do or die’ for the GDX & GDXJ etfs. A break of the 30 week ma is concerning to a degree.
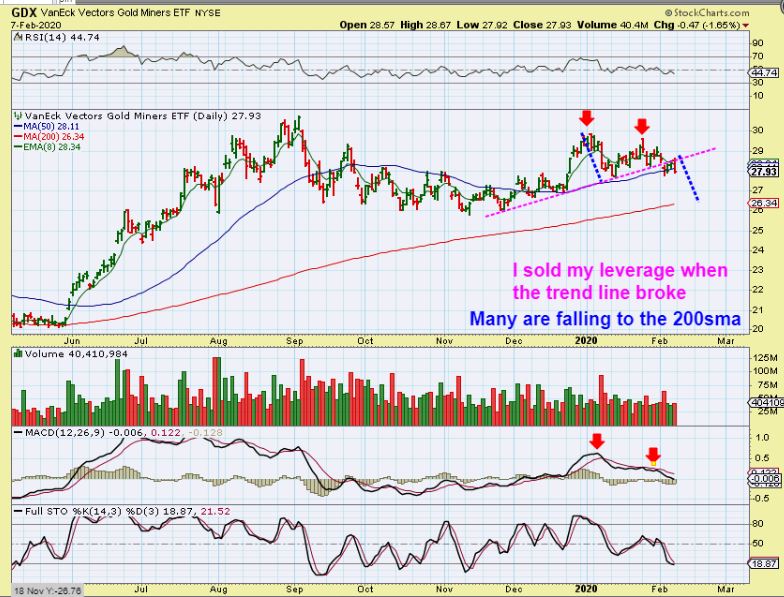
GDX DAILY – This is possible if Miners experience a short term break down to the 200sma. I stopped out of leverage on that trend line break. What would this kind of drop do for the big picture though? Would the Big Picture no longer be considered bullish?
.
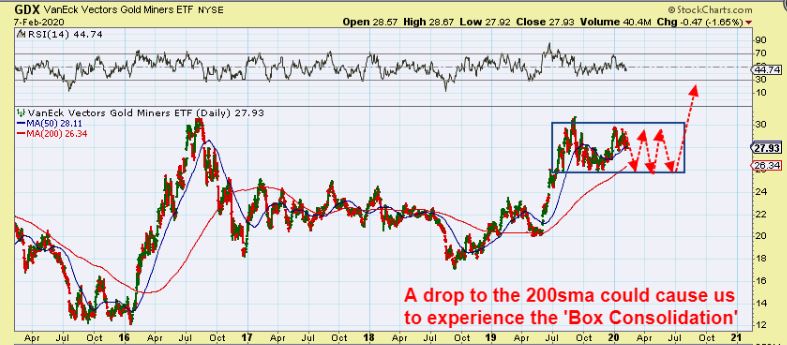
GDX DAILY – We would probably end up with a ‘box consolidation’, prolonging the agony for longs & shorts. I will say that during a bullish box consolidation, individual miners can still out perform. I expect that possibility from Hecla, and we’ve seen it in ELYGF.
.
GDX WEEKLY – I noticed that the sideways chop heading into May 2019 was looking similar to our current sideways chop. It eventually dropped into that ICL.
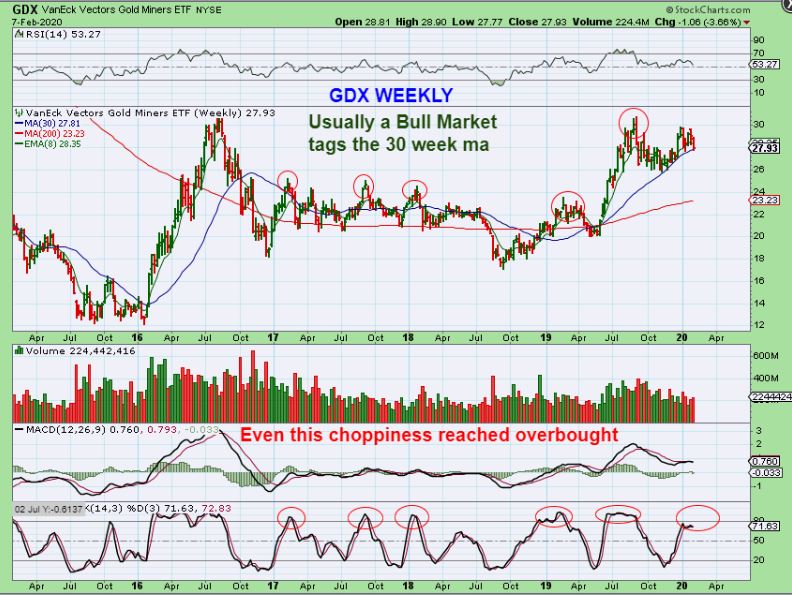
GDX WEEKLY – Riding the 30 week ma is viewed as bullish. We haven’t reached over bought, and even the former rallies in sideways chop did reach overbought, so this would seem to indicate that a final push higher is still possible. Maybe we’ll just pop & get a double top for now, or…
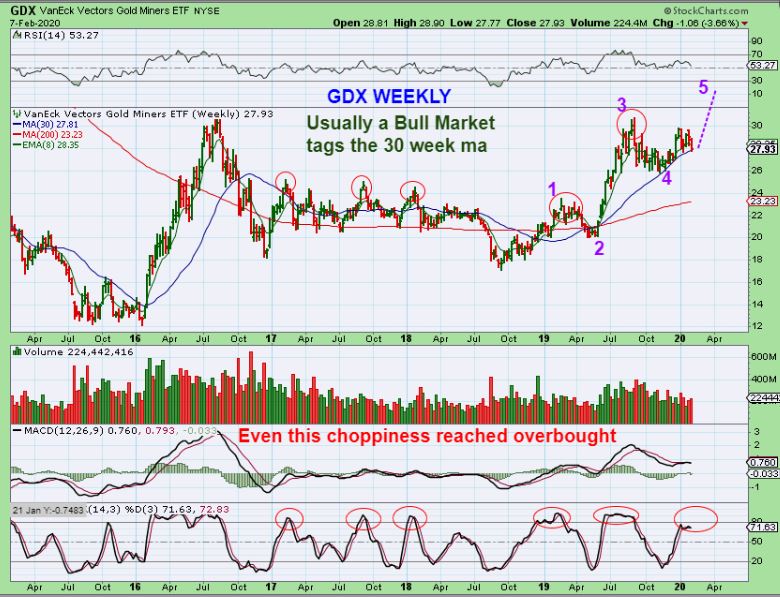
GDX WEEKLY – Riding the 30 week ma and pushing higher from here could be a 5th wave for Miners too. Next week could be do or die.
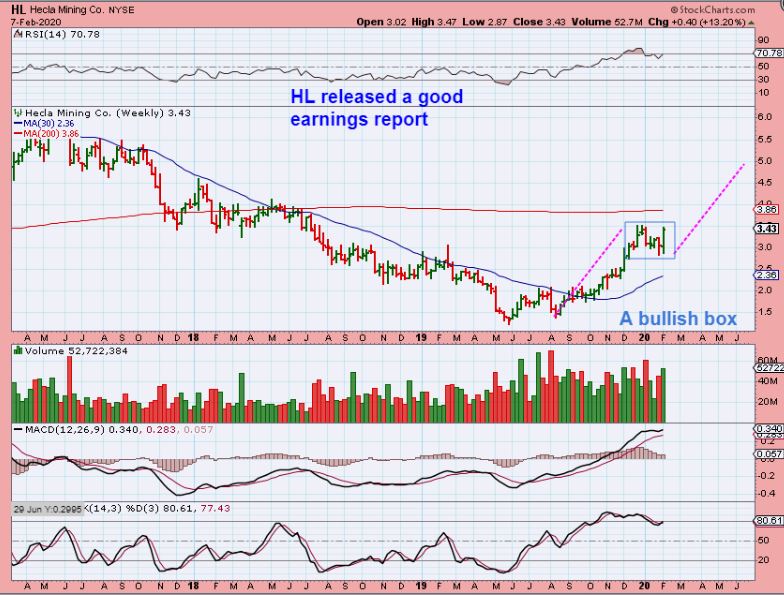
HL WEEKLY – HL surged 13% last week with positive earnings. I bought it and added, since I have seen other Miners rally while GDX & GDXJ Chopped. Now let me discuss that next…
.
ELYGF – While GDXJ has been choppy, ELYGF has been charging higher. I see a possible bull flag, so this can push higher 1 more time, However I had a sell order in at 60 cents and sold a chunk of mine. Why?…
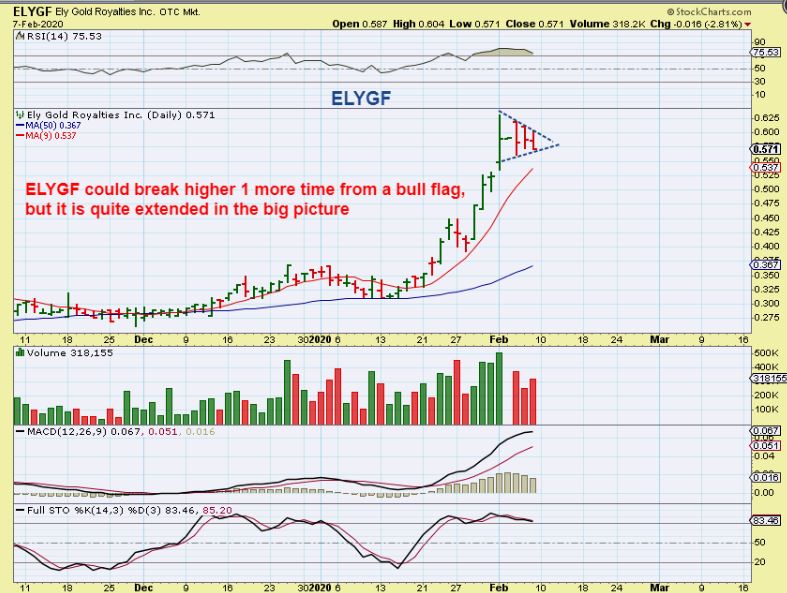
.
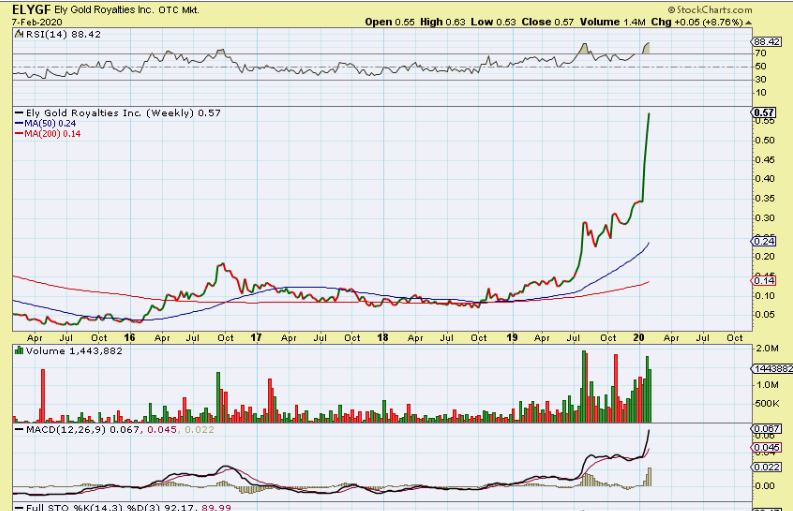
ELYGF WEEKLY – This now looks like the TSLA of Miners on a weekly chart, right? Even though I bought this as a ‘Buy & Hold’, I have seen parabolic moves many many times in my life, and they often crash back down. Why give solid gains back just to buy & hold if it may be unsustainable? I finally sold a large chunk of my holdings while holding on to some just in case the bull flag pops higher. I was up over 200% on some and added more during that consolidation, so I’m up well over 100% even on the additional shares just since October. I do hope to re-enter after a drop.
.
There is no doubt about it, the longer that the chop in Miners carries on, The more disappointing it gets for the 2nd daily cycle performance. We can’t control that, the set up should have accelerated higher after forming a cup & handle, but now some individual Miners have started to break down ( even former leaders like HMY, KL, & SVM for example). What we can control is our position size and stops or exit points as we wait for this to continue to unfold next week. I will briefly discuss HMY below.
.
Enjoy your weekend!
.
~ALEX
.
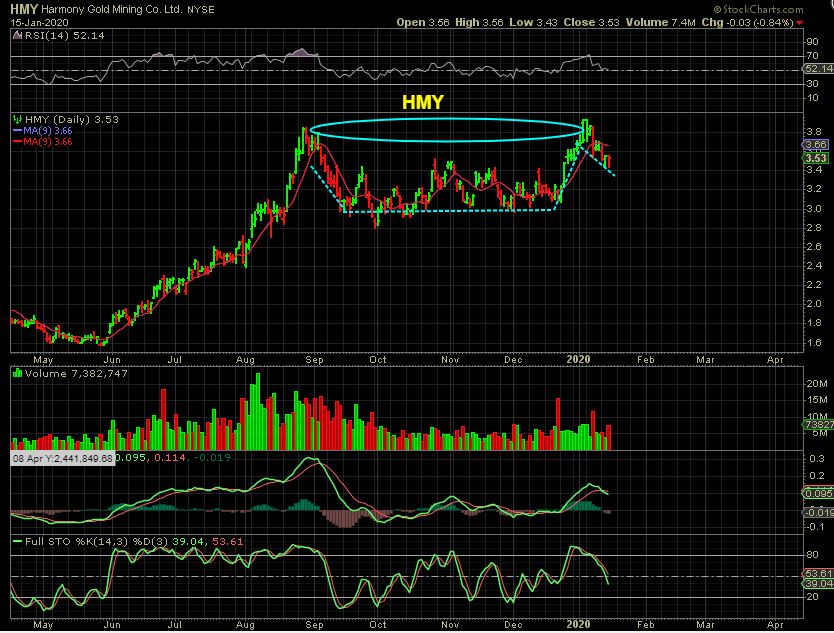
ANATOMY OF A MINER – I want to show you a great set up that turned bad using one of my favorite Miners from the 2019 Summer run higher- HMY.
.
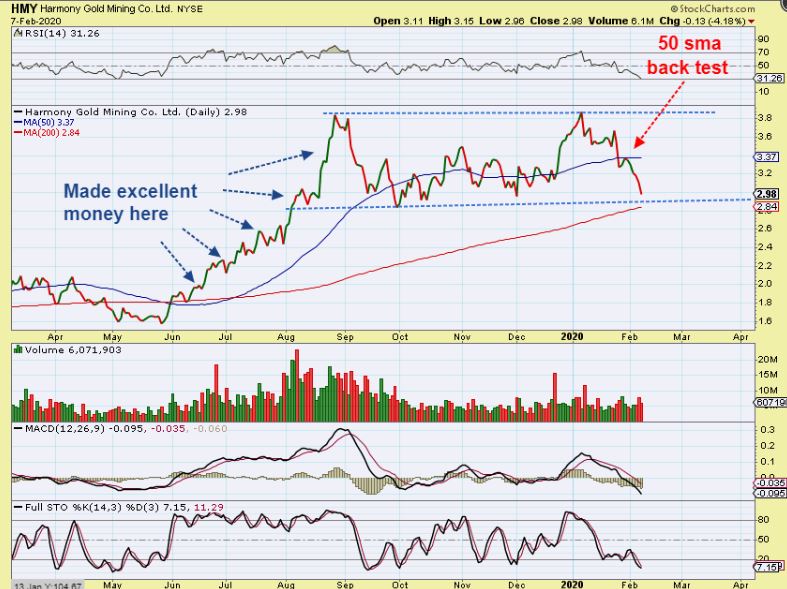
HMY – This was an absolutely beautiful Cup & Handle in Mid January. I pointed out that it could be bought here with a tight stop under the handle. The handle shouldn’t really drop more than 1/2 of the height of the cup to remain strong.
.
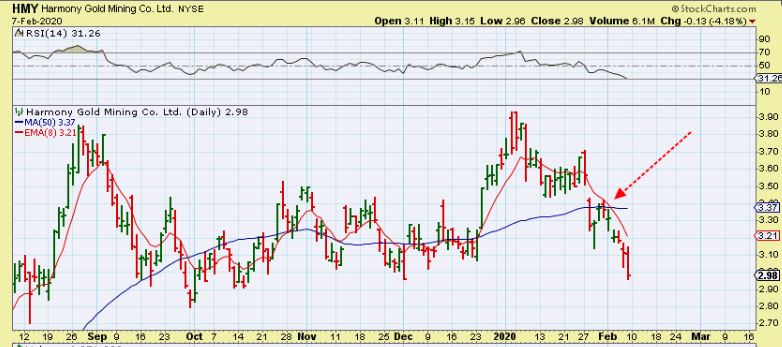
HMY – Suddenly HMY broke the 50sma at the end of January & failed at the back test too.
,
HMY – Even the big picture bull flag popped bullishly but then dropped. It now seems to be headed for the 50 week ma, which is roughly the 200sma on a daily chart. DOES THAT COMPLETELY RUIN THIS STOCK?…
.
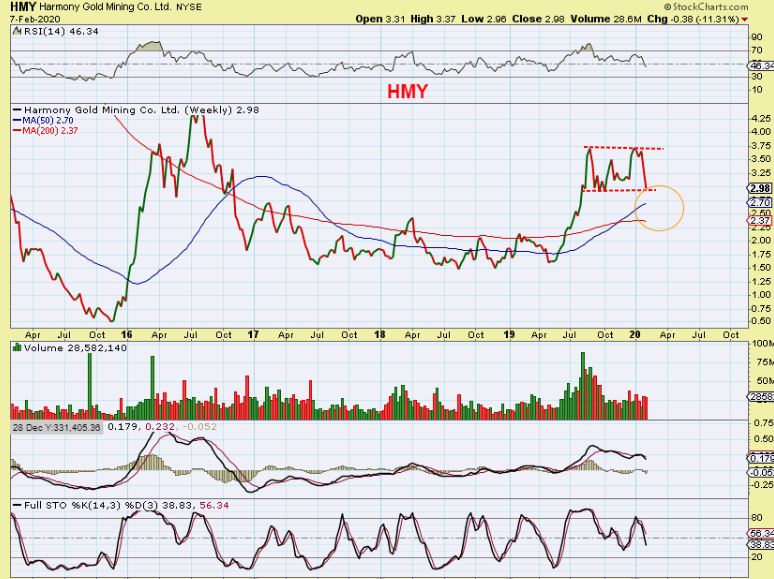
HMY – It could be a box consolidation forming here too. The weekly MACD was weak on the 2nd peak. This has more work to do.
.
HMY DAILY – We’ll see what happens at the 200 sma daily chart. A bounce there possibly gives us that box consolidation shown above and this is getting oversold. So the cup & handle was broken, but the bullishness in the big picture was not (yet).
.
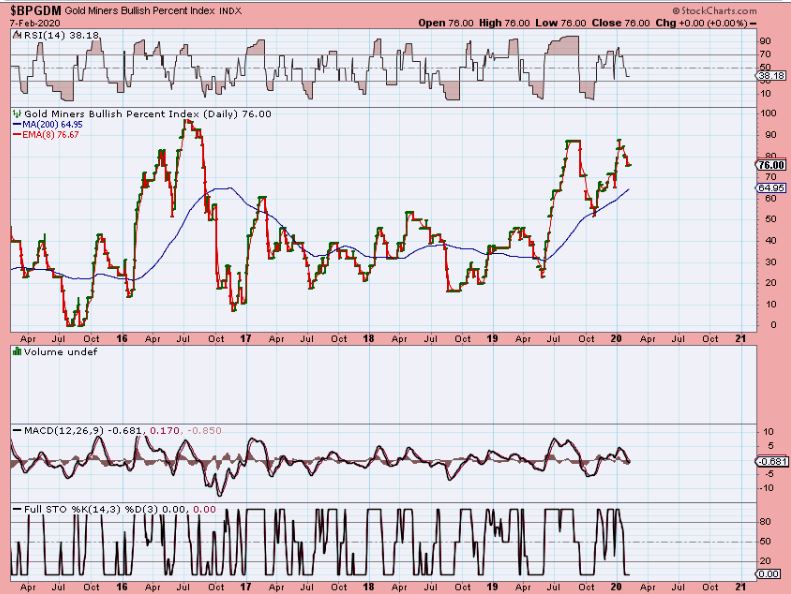
With some Miners look good and others breaking down, the ‘breaking down’ part just has to be changing the look of the sector to a mixed one with time running later in this Intermediate Cycle. The BPGDM ( Bullish % Miners index) is still reading 76 , so that is still bullish. It is oversold too, so maybe Miners will bounce next week, but these are just a few things that I am watching & Keeping an eye on. WORST CASE SCENARIO may be that we don’t get a solid rally until after the next ICL? And that could come in April May again, just like last year? Let me show you…
.
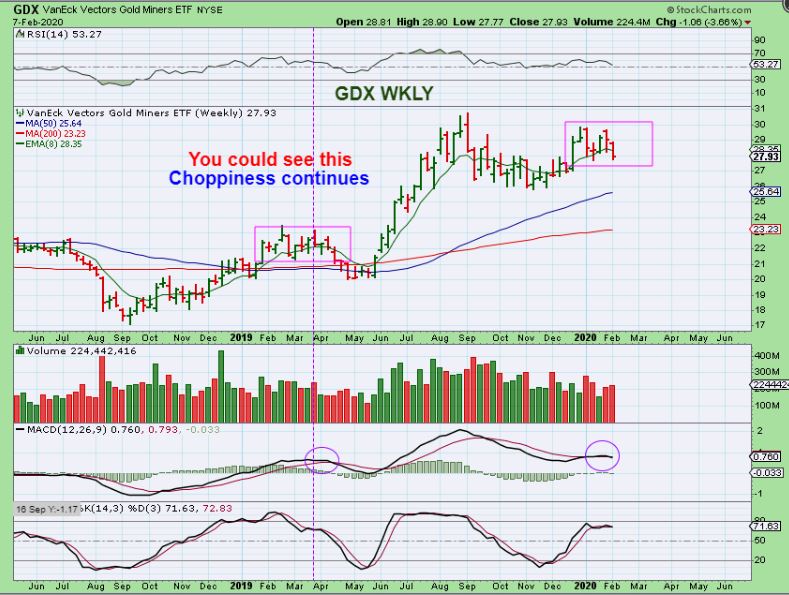
GDX WKLY – So this Choppiness that we endured last February to May 2019 may reflect the choppiness ahead? I’m not saying that it will be exactly the same, but simply a sideways choppy Box Consolidation to the rising 50 week ma. I am pointing out this possibility for 2 reasons.
1. We are seeing good stocks break down like this ( HMY) as Gold made new highs, and
2. Even though this does not erase the bullishness in the big picture, you DO NOT want to ride this leveraged.
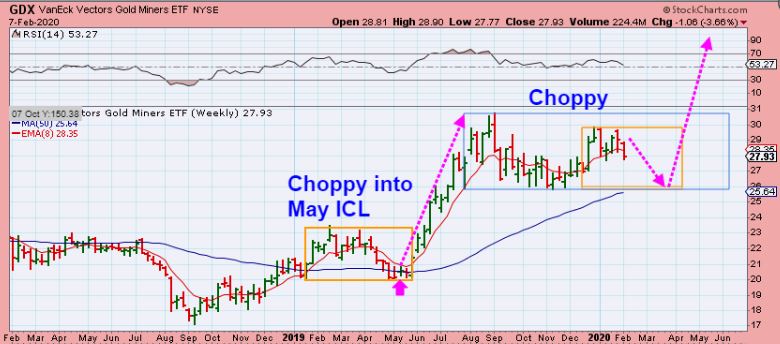
,
With GDX WKLY sitting on the 30 week MA , as shown in the report, Next week could give us further clues as to how this will play out. We need to see a higher close next week, or I would lean more toward a choppy continuation period.

