
Friday January 24th
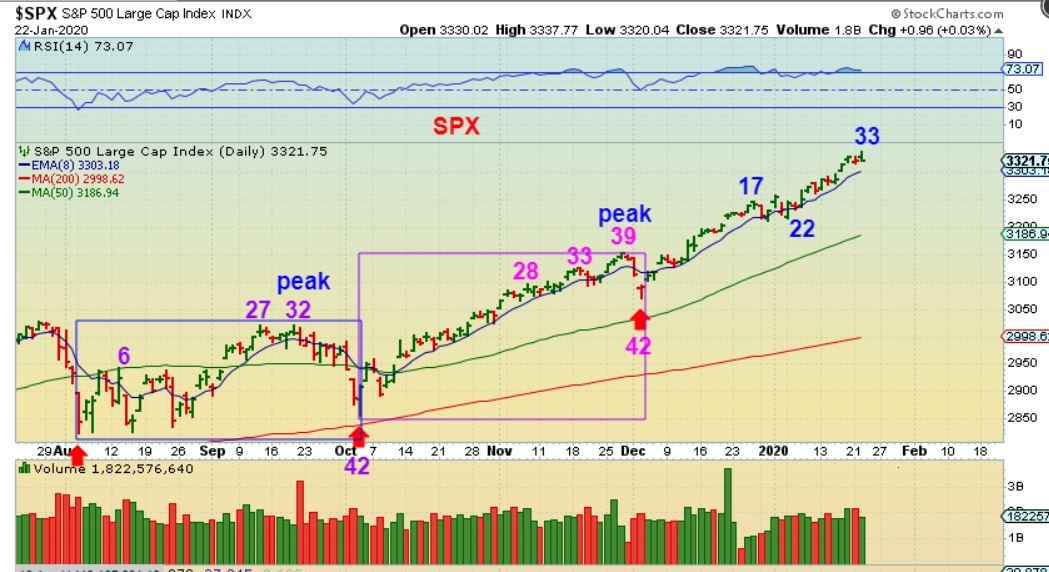
FROM YESTERDAYS REPORT : SPX – A peak on day 32 in September and a peak on day 39 in November . We were on day 33, so it could extend futher. The FED DAY would be a day 38 peak and again, that is possible since we had a day 39 peak last time.
.
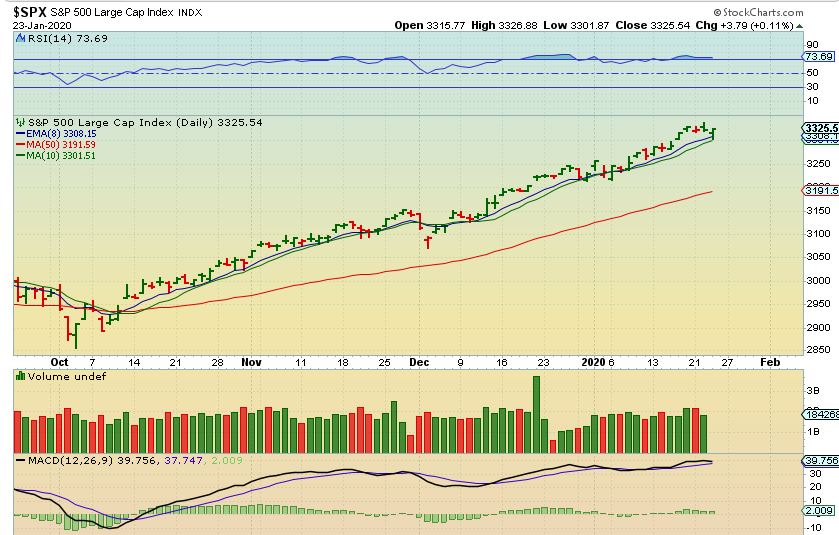
SPX – A drop to the 10 sma and reversed higher. This can rally further.
.
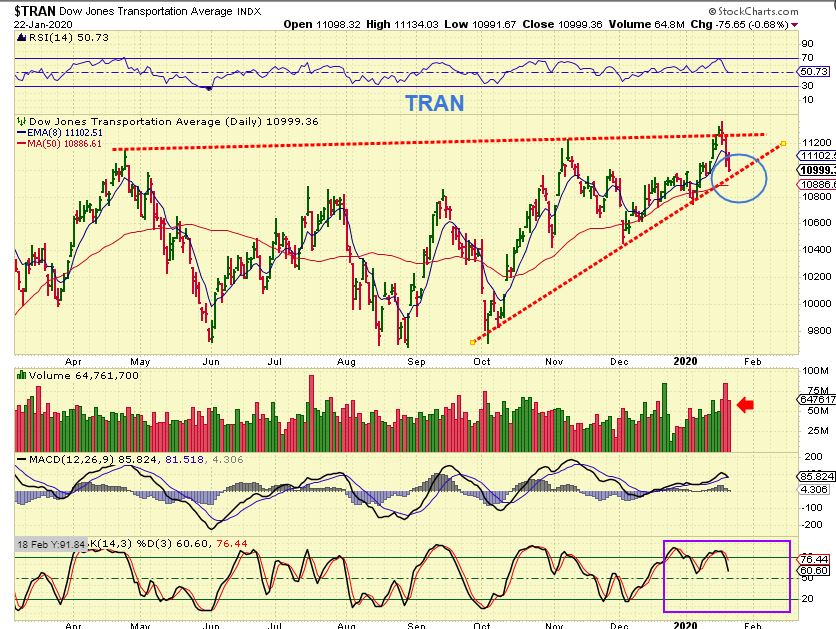
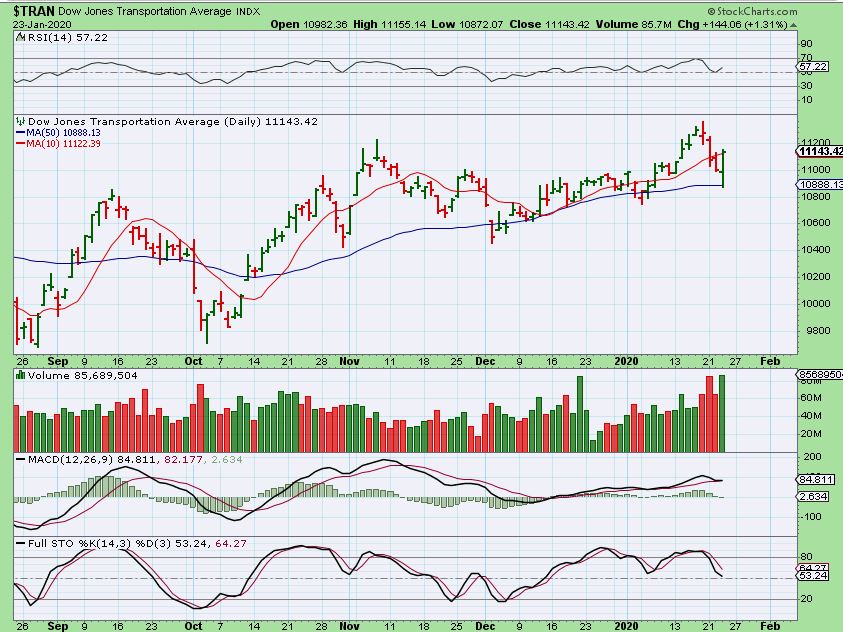
TRAN CONCERNING? – I saw a drop in the TRANSPORTS that looked rather serious, so I pointed out that I was watching that 50sma area.
,
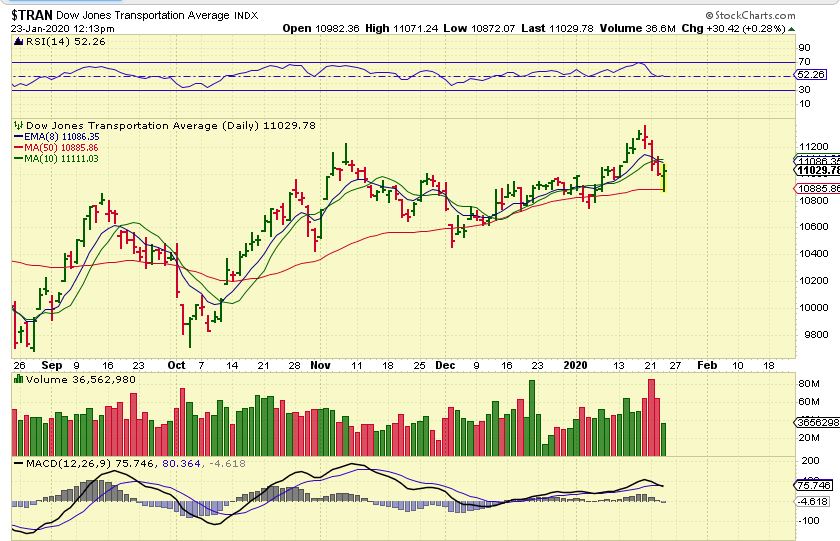
TRAN REVERSAL – Wow, a perfect reversal by midday. I posted this at 12:13 in the live area as it reversed and was up 30 points. Would it close like this?
.
TRAN REVERSAL – No, it would close even stronger, now up over the 10sma and up 144 points on the day. My advice? DO NOT short this market yet.
.
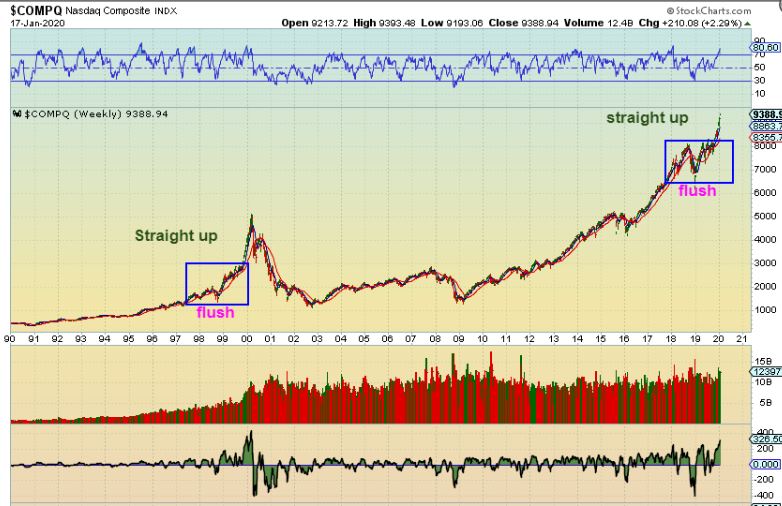
JUST A REMINDER: NASDAQ PARABOLIC TOP in 2000 –We just want to be aware of the idea that it is o.k. to be long the markets, but use stops because if they get too steep, they do eventually all top.
.
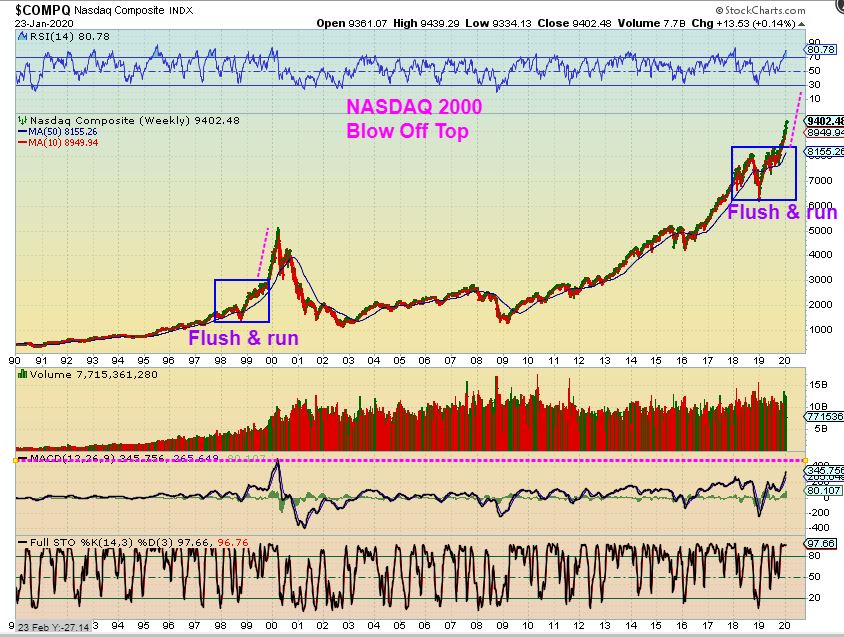
UPDATE –That was a Jan 17 chart, and here you can see an update. This can still run higher, but caution is warranted. We are due for a DCL, but this may even run higher after that if it rivals the 2000 blow off top.
.
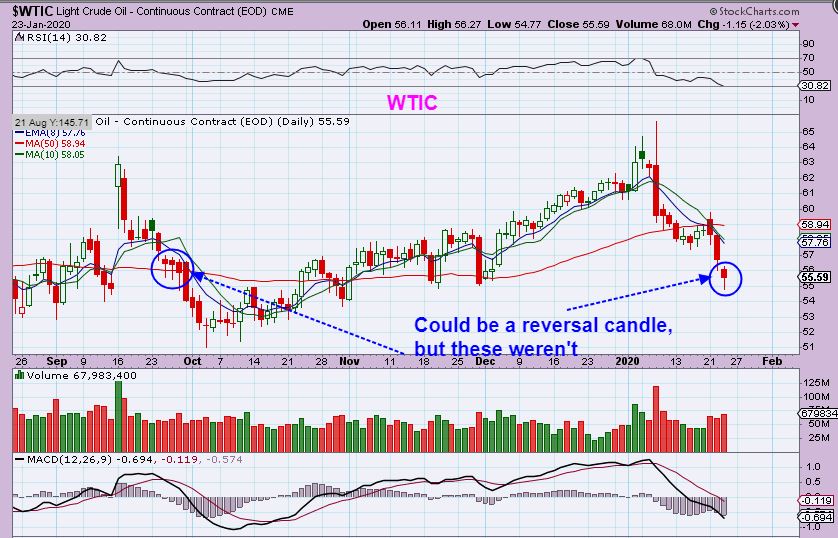
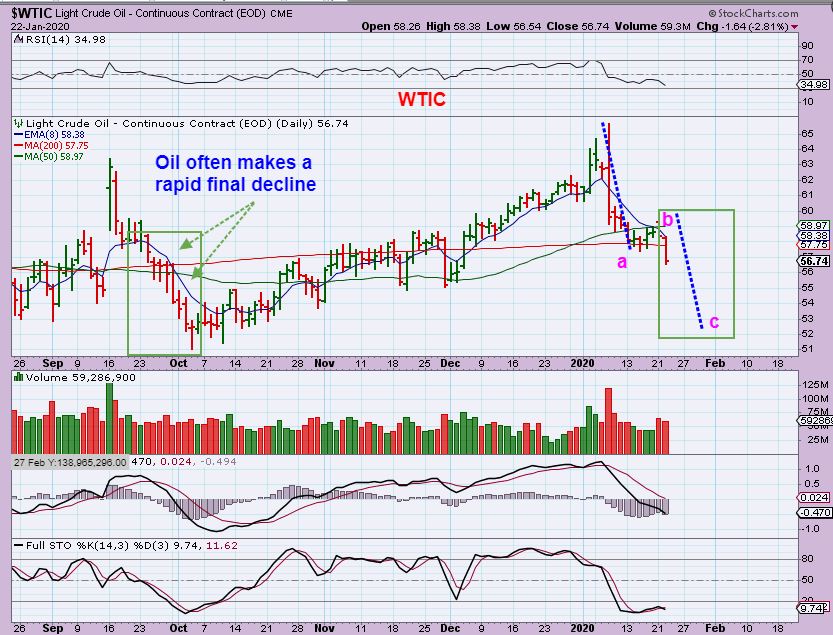
WTIC – I see a reversal candle, but we did have that on the September sell off too. That was not the bottom of that sell off. Let’s look at yesterdays chart next…
.
MY CHART FROM YESTERDAY : WTIC – We have all seen OIL accelerate when it sells off, often several days down in a row. If we get that here, it may resemble this. I’m just going to let it play out into a dcl and go from there.
.
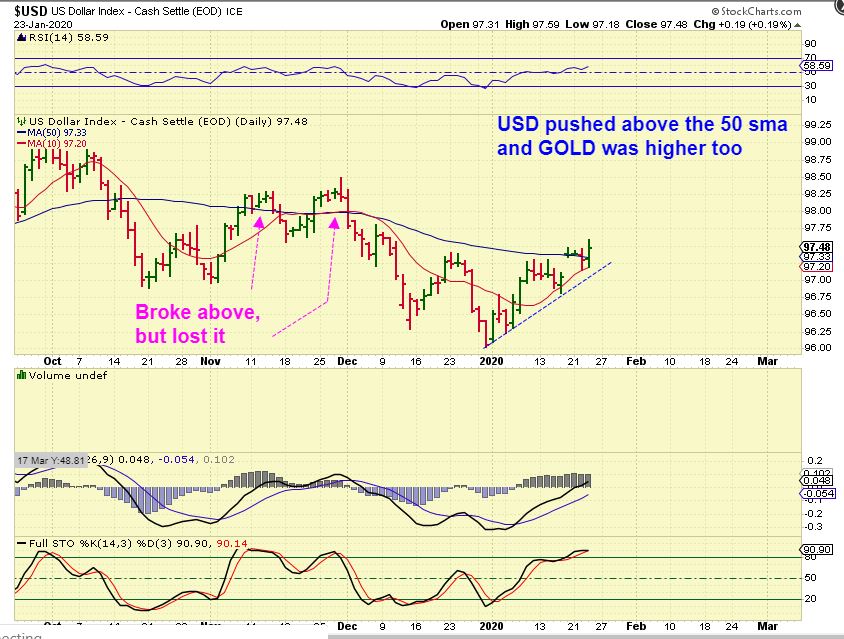
USD DAILY – The USD broke above the 50 sma, but Gold moved higher with it. On the last daily cycle, the USD broke that 50 sma twice, but it still rolled over to new lows.
.
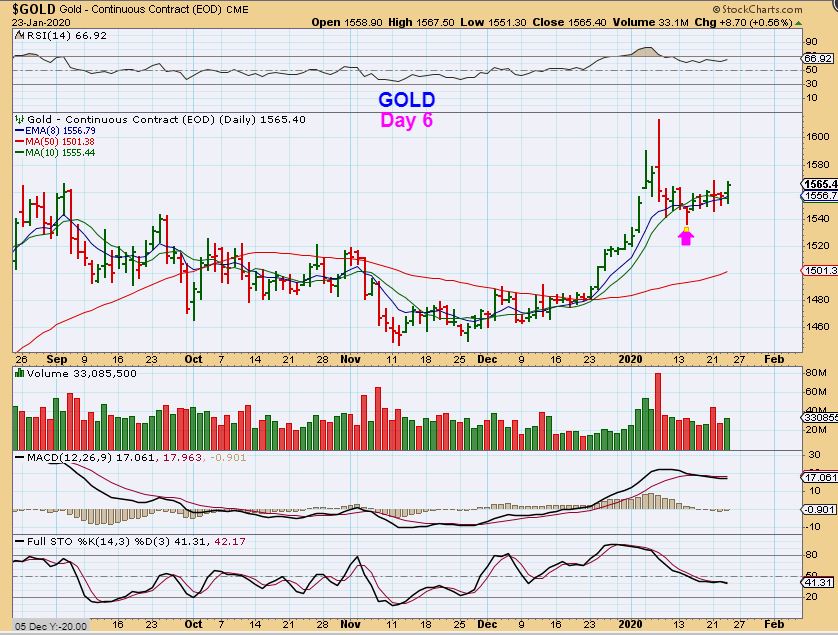
GOLD – Gold perked up with the USD breaking higher too. This looks to be day 6 of a new daily cycle.
.
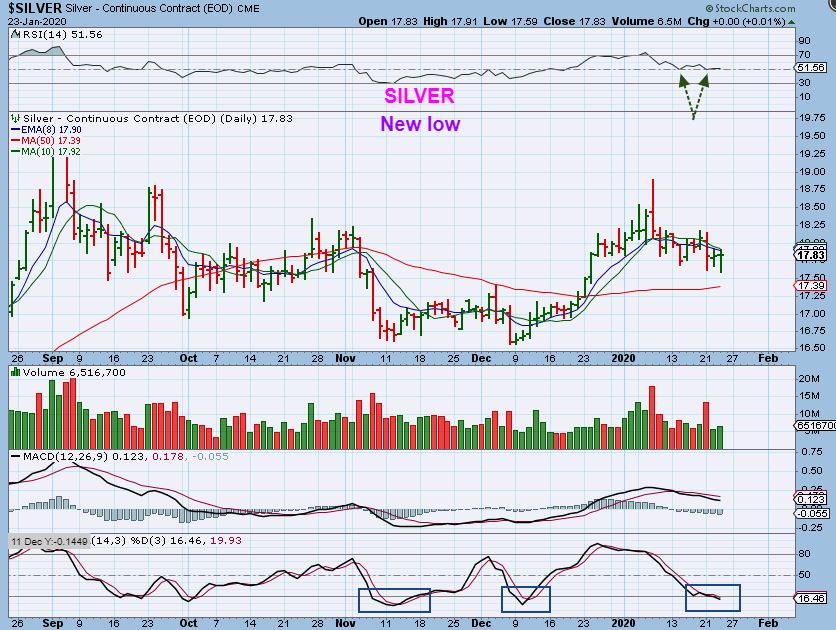
SILVER – Silver made a SLIGHTLY new low, and reversed higher. The RSI did not make a new low. This looks like day 34 for Silver.
.
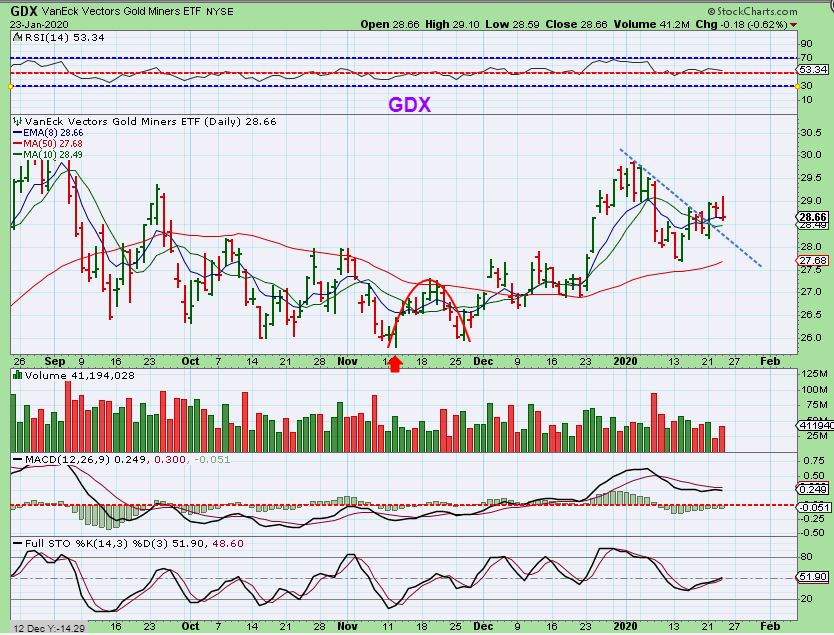
GDX – GDX rallied to a new daily cycle high on day 6 and then sold off. I got a lot of questions of concern & fear of “What if…” with yesterdays price action, but I have my parameters in place. A break of the lows means the trade turned invalid. If it stays above the lows, then it remains valid. Period. Emotions must be set aside to allow a trade to play out. Look at the November lows and you’ll see that that Low was almost tagged ny the end of the month and then it moved higher. ..
.
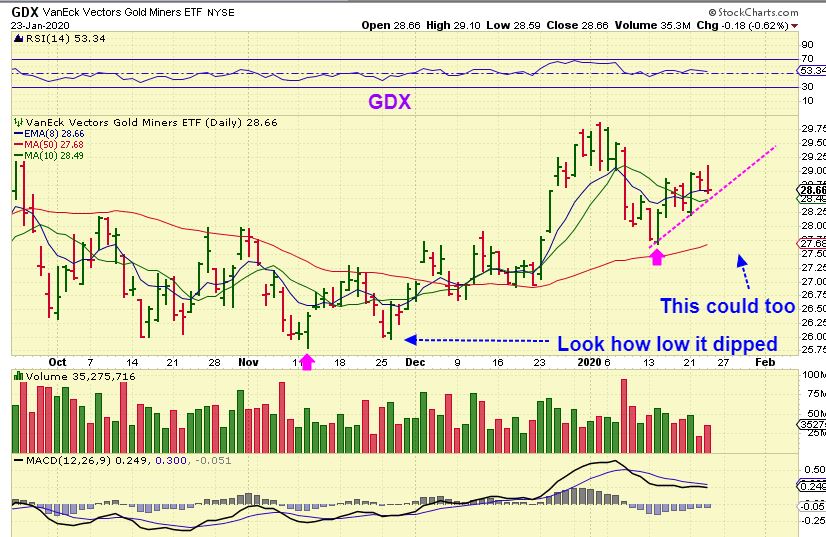
GDX – So if price dropped back to the lows then, and yet it stayed bullish, doesn’t that mean that this could too? Yes, and we have seen this many times in the past. You cannot control the price after the lows are in, you can only set your parameters and go from there. In fact…
.
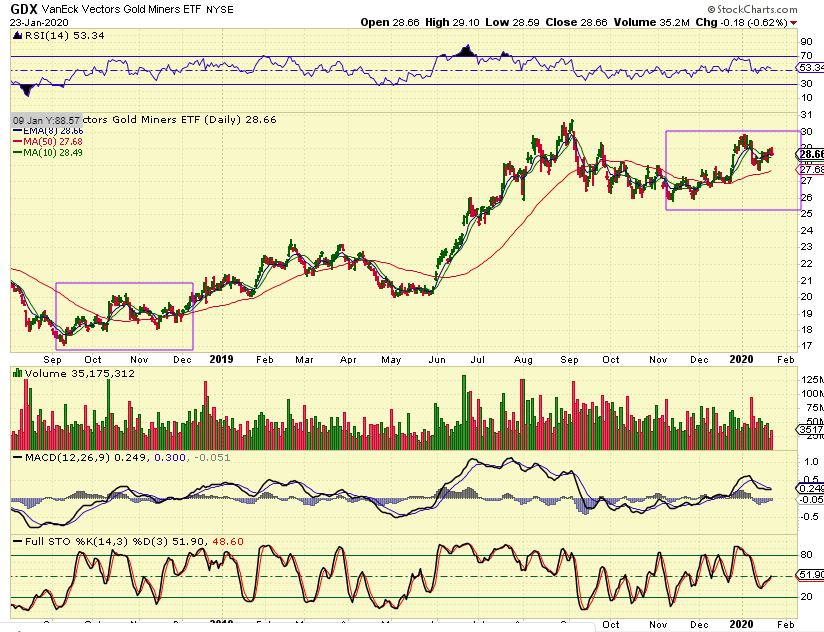
GDX – I already showed this example recently with choppy similarities. That purple box can happen again and the trade still remains valid. In the move out of the September 2018 ICL, price was choppy and moved up & down FOR MONTHS. It was much worse back then, but it eventually moved higher without taking out the lows.
.
EDIT: I have written and rewritten this conclusion several times. This is not how I wanted to end the report, but I need to explain Miners again, due to the concerns shown yesterday. I am not concerned, but others are, so I will address that here…
.
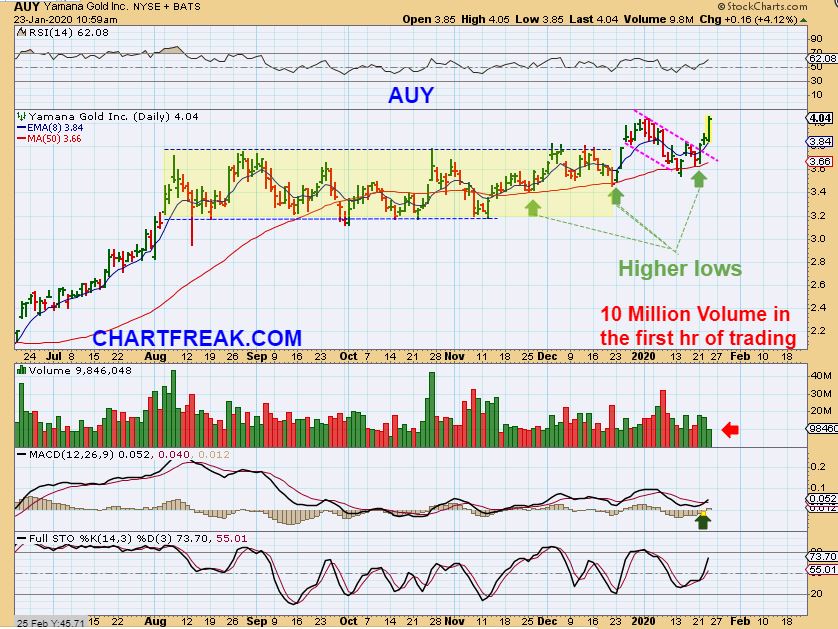
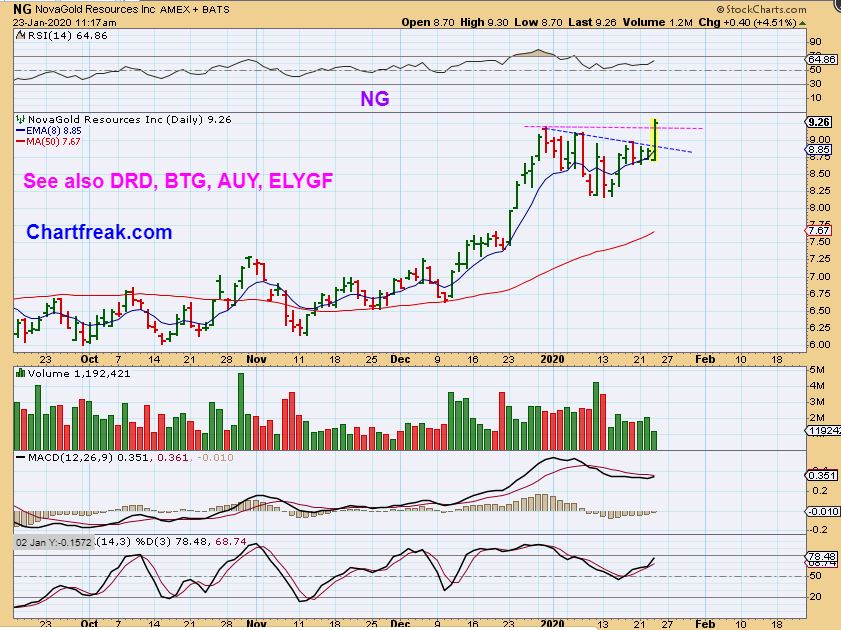
When it comes to the current trade in Miners, I was in the live section pointing out that some Miners like NG, DRD, AUY, etc were breaking to new highs Thursday morning & midday. By the end of the day I saw nervousness, doubts, and fear simply because GDX couldn’t hold its highs of the day while Gold did. I know that most here likely understand from past experience that price can get choppy and frustrating and that is normal, but for others price action concerns them and they think that each day means something bad or something good is happening. The truth is that each days price action can just be wiggles too. I am always posting charts showing how price can bounce around for weeks and as long as the lows aren’t broken, it is a valid trade ( not a broken trade set up). We cannot control that price action day to day, so we just have to allow the trade to play out. Again, I was posting that I was seeing a few Miners breaking to new highs, but GDX didn’t break out because the majority of Miners in that ETF just aren’t at their highs yet. That doesn’t mean that they are bearish. When the other Miners begin to break higher, GDX will too. If they begin to break down, GDX will too, but right now Most Miners look fine.
.
Also remember that it may just be a matter of perspective that can be affected by leverage. Emotions are funny in choppy trade, and some may need to get out of leverage or lighten up if they find that that trade does not fit their style. I personally am fine with the current price action, but every reader must decide for themselves what they are more comfortable with? Leverage? No leverage? Watching it while on the sidelines & trying to jump in after a break out to new highs? Or staying invested in it now that GDX seems to have a confirmed dcl in place. The choice has to be yours, using my analysis and your own.
.
For me, Many Individual Miners look bullish and some even broke to new highs yesterday, so I am still in my trades in this sector. I will point out a couple of those Bullish Miners below and you can adjust your portfolio before the weekend if you feel the need too. Why not review the charts of GDX posted in this report above again. You will see that we have had choppiness in the past out of a dcl too, and unless the lows are taken out, the long trade set up is still valid.
.
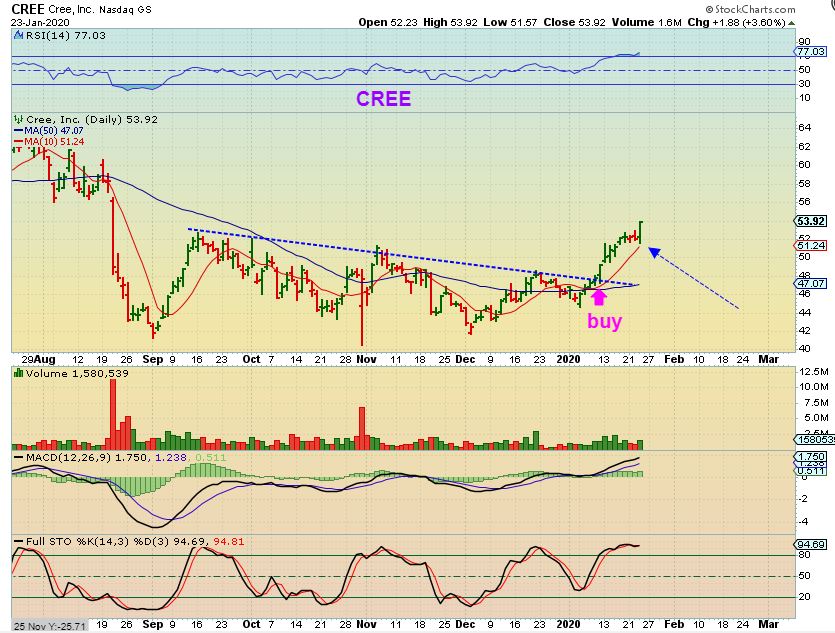
With yesterdays S&P & NASDAQ price action (The drop & reversal at the 10sma), the trades from past reports like CREE, STMP, PD, UBER, TWTR, CRWD, ZUO, AMD, MU, etc etc may also continue to play out Bullishly. That SPX or NASDAQ trade also remains valid above the 13 sma, and those parameters haven’t been broke either, despite yesterdays morning sell off. Take a look at CREE for example…
.
Enjoy your Friday trading.
.
~ALEX
.
AUY – This was a chart from yesterday as AUY was breaking to new highs. This doesn’t look scary or bearish. Some may want to own AUY and sell their JNUG?
.
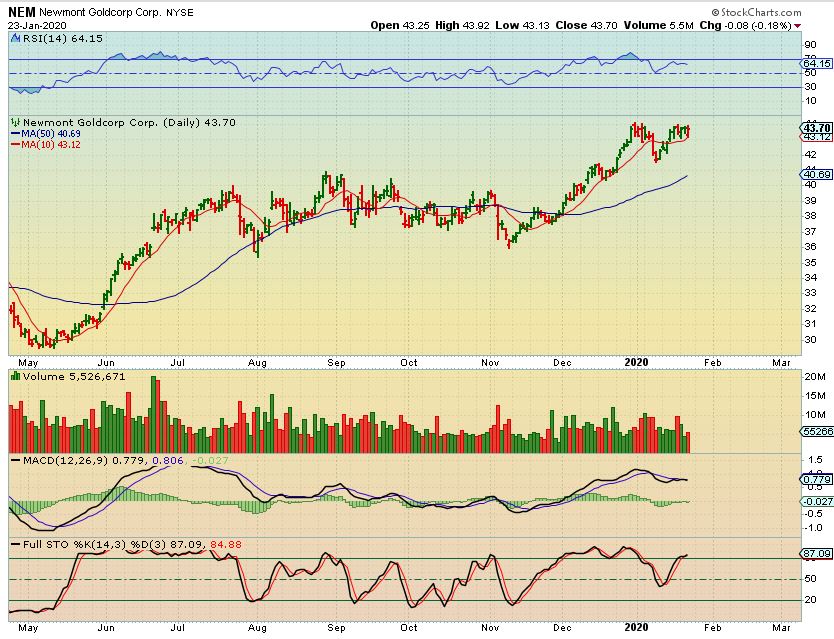
NEM – What does this look like to you? Scary & bearish or Bullish? It can actually drop to the 50sma & still be Bullish. It DOES show divergence at the double top highs, so it may drop before the FOMC Mtg.
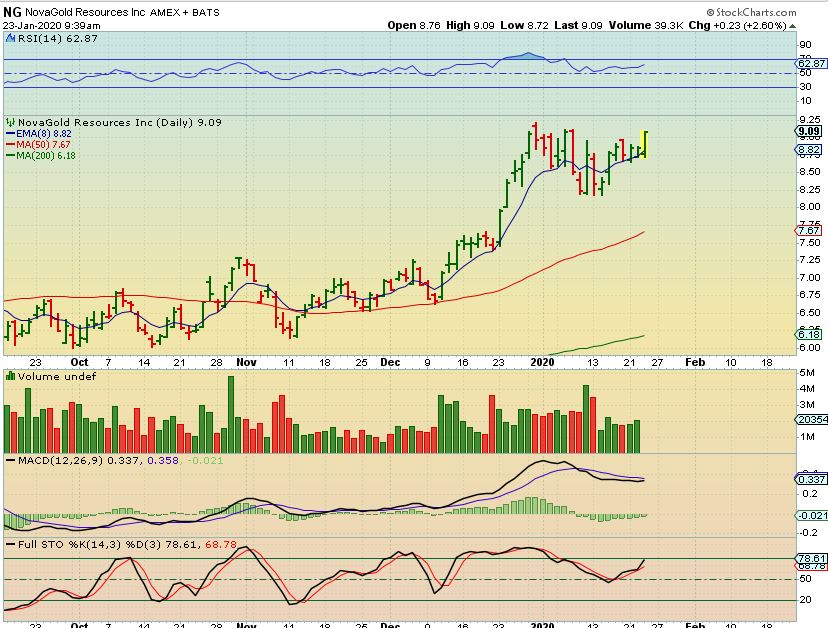
NG -I saw Nova Gold breaking higher, so I posted this at 9:39 a.m.
.
NG – Nova Gold, DRD, AUY, etc broke to new highs , but I see divergence, so the chop may continue for a bit longer. This looks Bullish to me.
BARRACK GOLD – I think that the set up for BARRICK looks quite bullish and I captured this midday.
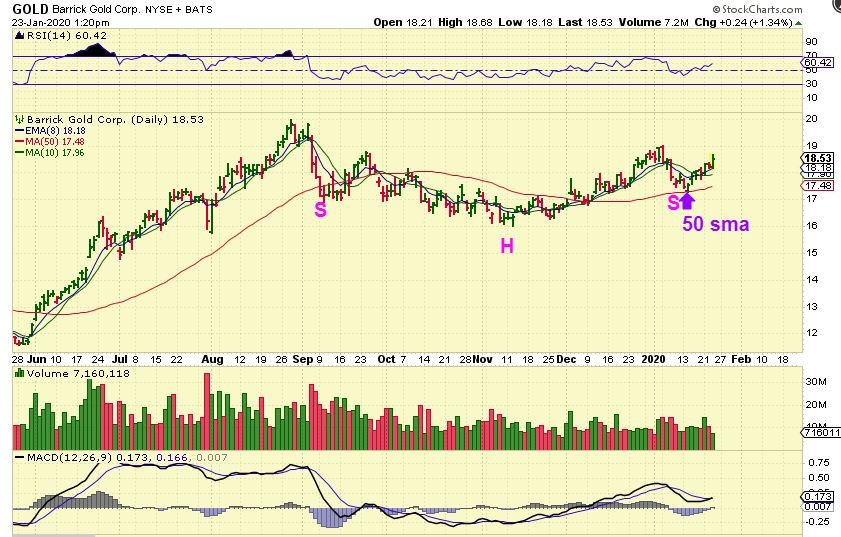
.

