January 18th Weekend Review
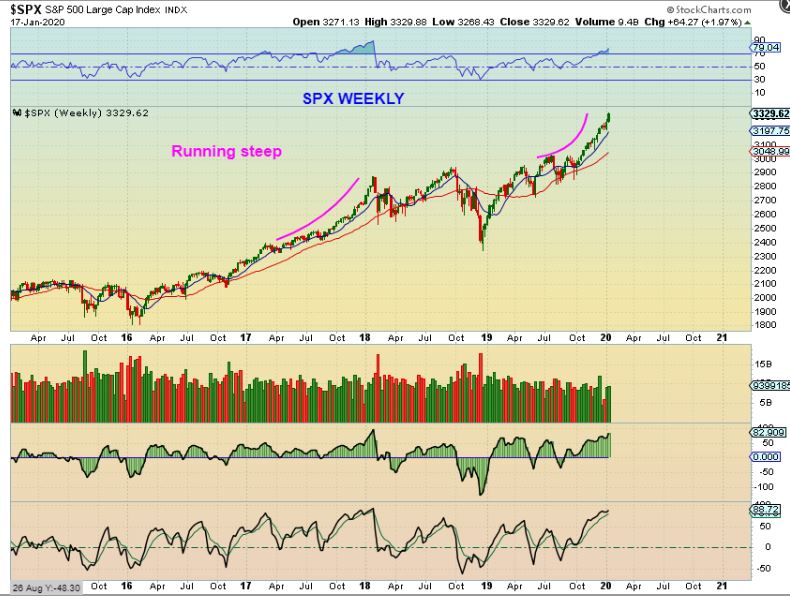
SPX WEEKLY – We have been seeing an incline that is getting steeper as time goes on. It can melt up & go parabolic to a blow off top, or as seen here in 2017, it can peak & plunge. We are coming due for a daily cycle low so at this point just keep your stop at the 13 sma and we’ll eventually get stopped out when a dip comes & analyze things from there.
d
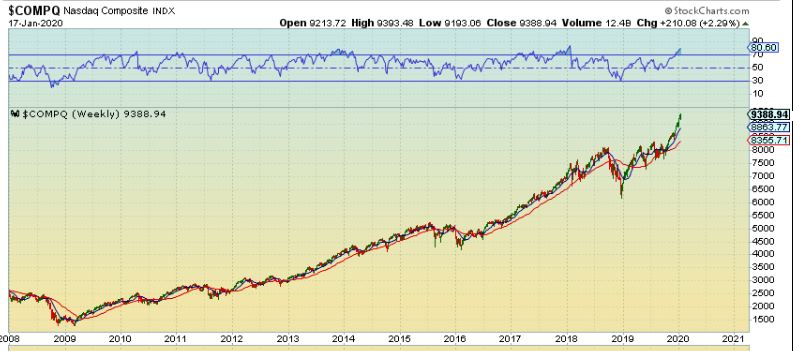
NASDAQ WEEKLY – Notice that the NASDAQ is even steeper than 2017. It is almost climbing straight up and if this continues it will be unsustainable ( Despite the joy and cheering that you will hear in the media & social media). It is NOT something to short now , because a blow off top can Really go a lot further than you’d expect. Let’s discuss this just a bit more.
d
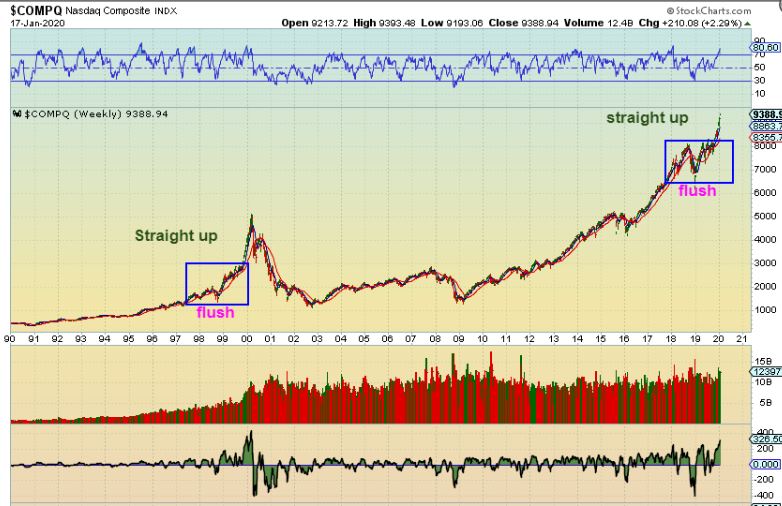
NASDAQ WEEKLY – This is the NASDAQ blow off top in the 1990’s after a quick shake out flush down. It is similar to the straight up move currently taking place. I can’t say how long it will last, but this has been a fairly straight up move since November. It can go higher.
.
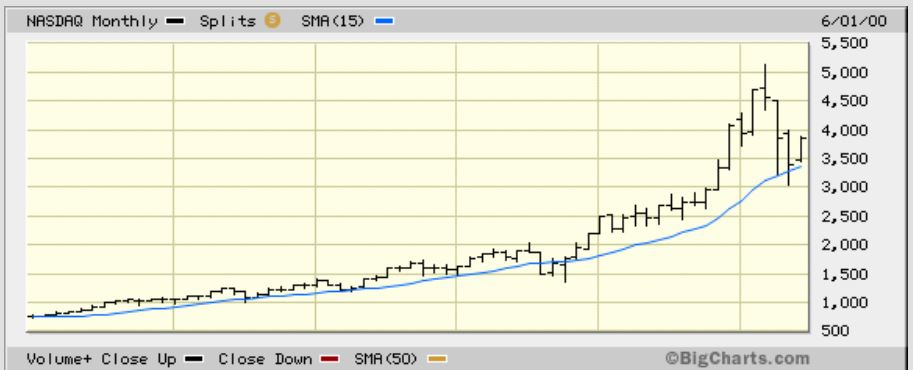
NASDAQ MONTHLY 1990’s – Zooming in on the 1990’s Monthly view, it pulled away from our blue line in November & peaked in March.
.
NASDAQ MONTHLY NOW – You can see the incline here also steepened over the past 3 months . 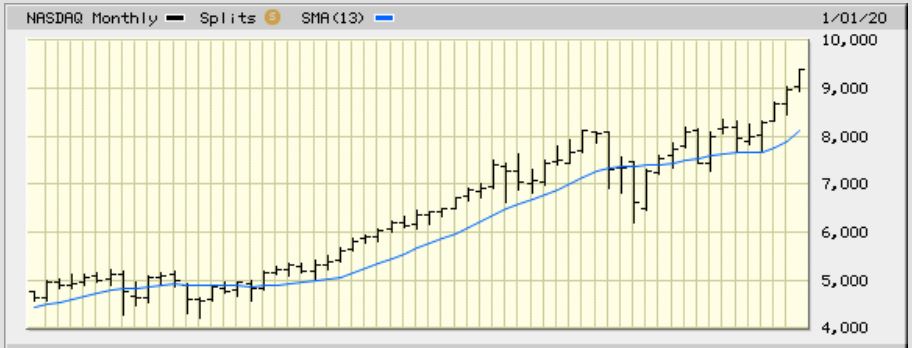
.
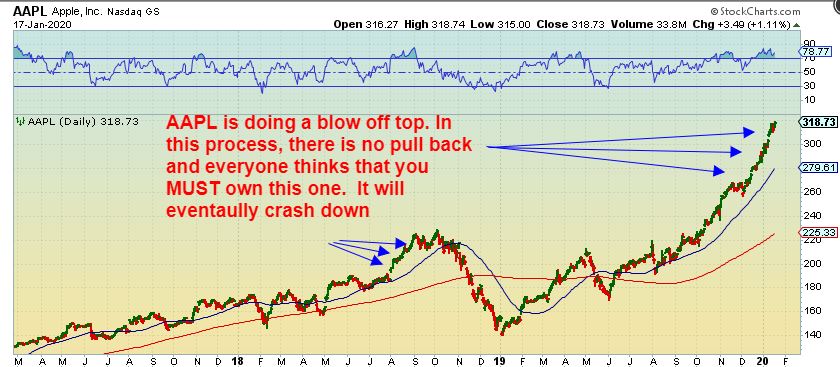
THIS IS THE FIRST SIGN that we may be doing an unsustainable blow off top. Look at AAPL, especially since October.
d
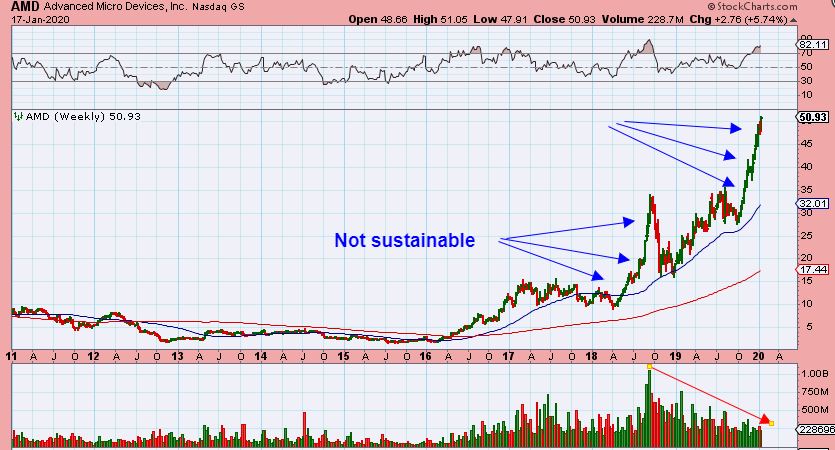
I AM STARTING TO SEE THEM IN A FEW STOCKS AAPL, AMD, MSFT, etc. These moves just cannot be sustained long term and when the selling starts, everyone hits the exits at the same time (Crash). Look at AMD on that last vertical rocket of 2018 for example. Unsustainable long term.
I AM NOT CALLING A TOP RIGHT NOW, but I am calling your attention to what looks to be taking place, and we will watch how things continue to develop as we go forward. There is not a lot of fear in the markets, the Put Call Ratio is very low, and the VIX is also at 12. These are noteworthy points of interest during a rally like we’ve been seeing.
.
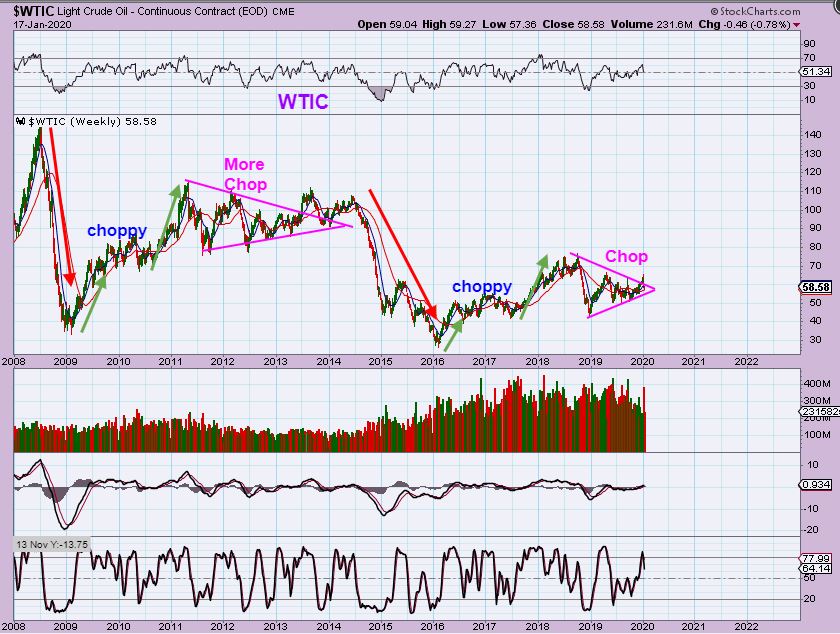
WTIC WEEKLY – This is the very big picture for Oil, and as you can see, the recovery from the crash down in 2014 & 2015 looks very similar to the recovery after the 2008 crash. It was choppy and difficult to trade. Let me review the similarities.
1. The red arrow crash & V-Bottom
2. Green arrows show a run, some chop and a 2nd run.
3. It then got very choppy and the sideways consolidation formed a triangle.
4. In 2013 it broke higher but remained choppy and we may see Oil just shop around sideways going forward too. Basically “Directionless”
.
Things may have changed a bit in the area of the USD & Precious Metals. I’ll discuss what I am seeing and we’ll just have to see how things will play out. I constantly monitor Gold, Silver, and the Miners in the daily reports and will continue to do so.
.
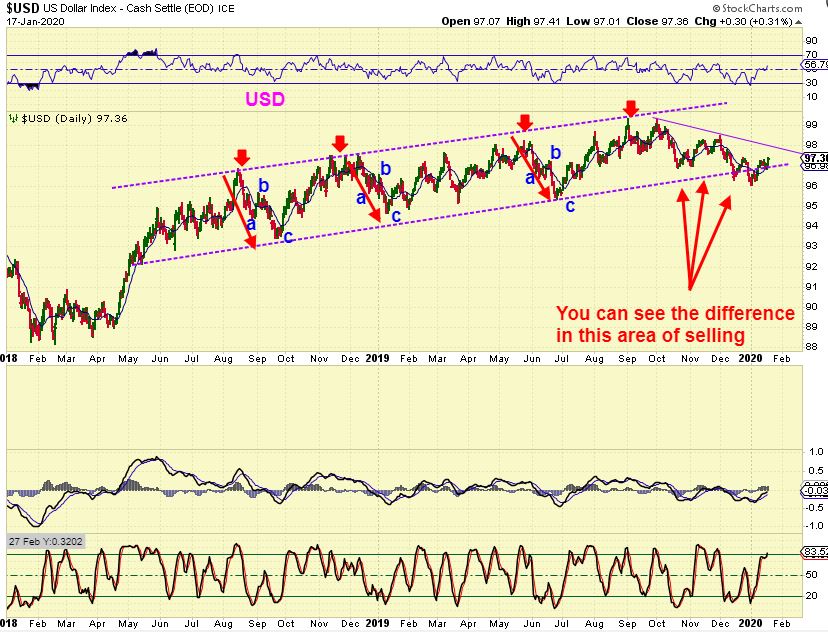
USD DAILY – Most of the drops into the past ICLs were a-b-c type drops, and made higher lows. I have pointed out this change… This last sell off has been breaking down to new lows and looks like the start of a break down. THAT would be good for the Precious metals. So what’s the problem?…
d
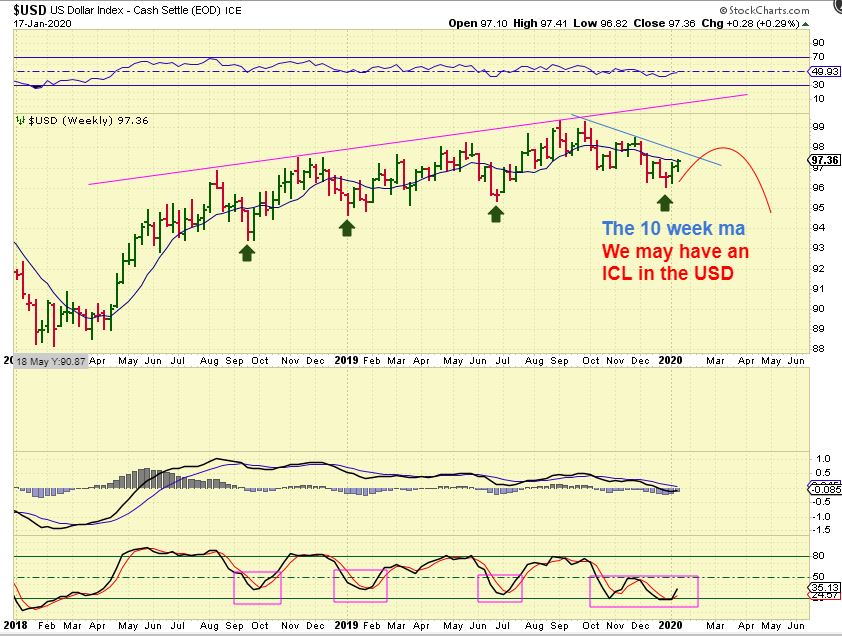
USD WEEKLY – It is starting to look like we might have put in the ICL 2 weeks ago. That means we may see some USD strength for a little while, a temporary probkem for Gold? Perhaps. A break over the 10 week MA & a break of that down trend line, etc. could hinder the precious metals SHORT TERM. Is this already hindering Gold? I will discuss that.
d
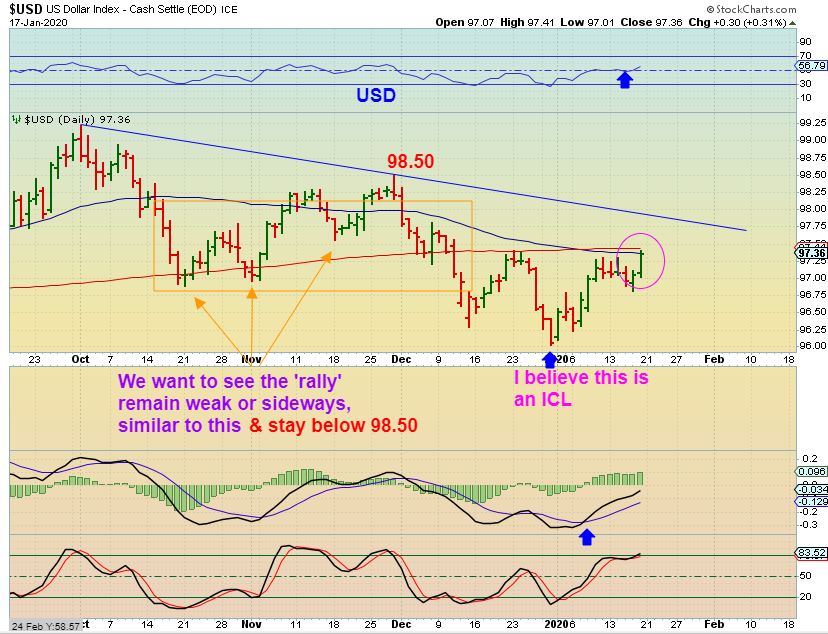
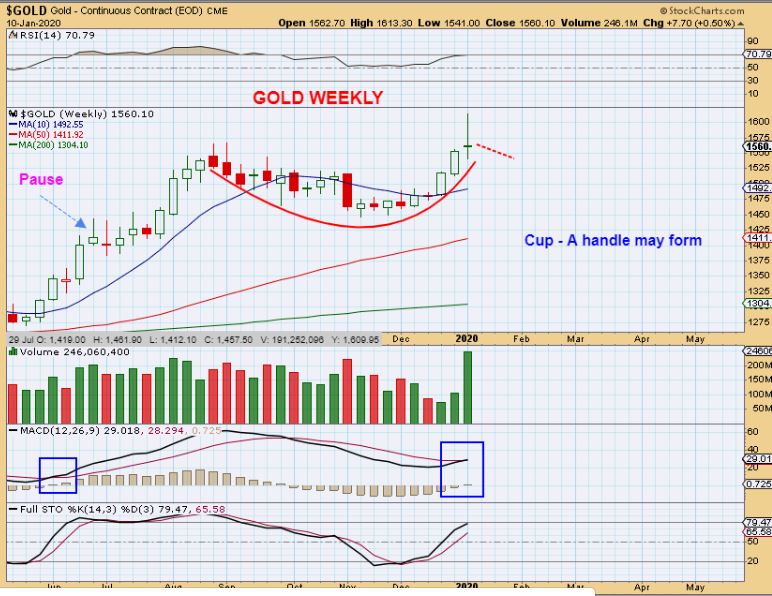
USD DAILY – Even a sideways rally similar to the choppy sideways run of October & November may cause Gold to continue to stall & go sideways too. Gold chopping sideways would form the handle that I have been discussing on Golds Cup. That would also prolong the agony that some feel when waiting for a gold rally, so let me discuss that next.
d
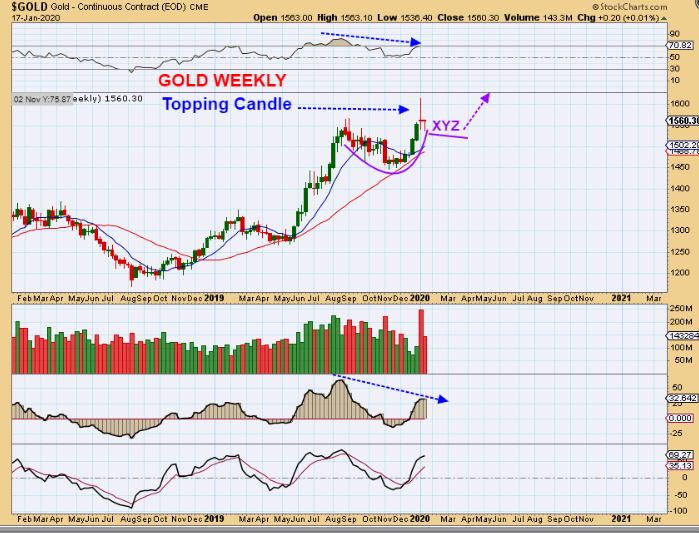
A sideways rally in the USD may cause Gold to continue to stall & go sideways too, like I drew on this chart over a week ago on January 10 after the ‘Iran Reaction’. That was a short term topping candle on the weekly chart. That USD & GOLD chop would form the handle that I have been discussing. And again, That would also prolong the agony that some feel when waiting for a gold rally.
d
GOLD WEEKLY – Gold is also trying to get through the large resistance area that has been pointed out regularly. The ‘Iran Reaction’ forced Gold to surge into that area, but selling overwhelmed the sector that following Monday. This area may take some time to work through, especially if the USD is moving higher.
d
GOLD WEEKLY – So if you can picture a couple of weeks chopping sideways, that may help you to mentally prepare for what may be coming our way. I HAVE SEEN GOLD IGNORE THE USD IN THE PAST AND RUN HIGHER, so we may see higher prices, but for this weekend Big Picture review, I just want to prepare everyone for this possibility and the daily reports can take it one step at a time as the moves progress.
.
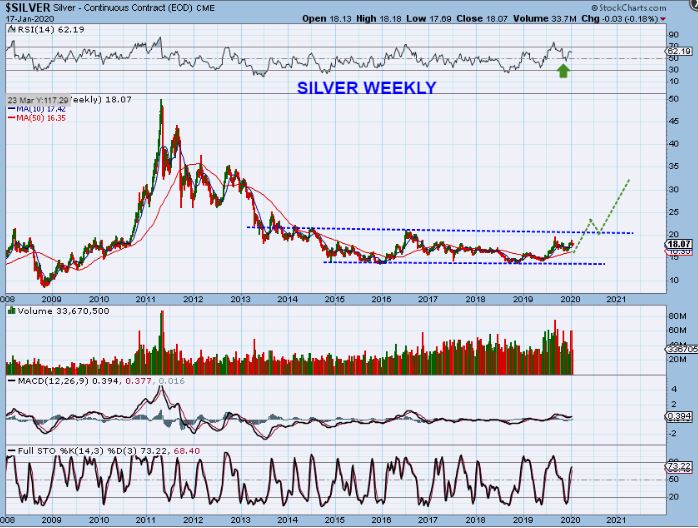
SILVER WEEKLY – The Big Picture for Silver is still longer term bullish as a large multiyear base is forming. This is taking place with the RSI strengthening and with volume increasing. Not only that, several Silver stocks have already move over 100% -200% off of their 2019 lows. The Miners are leading the way.
.
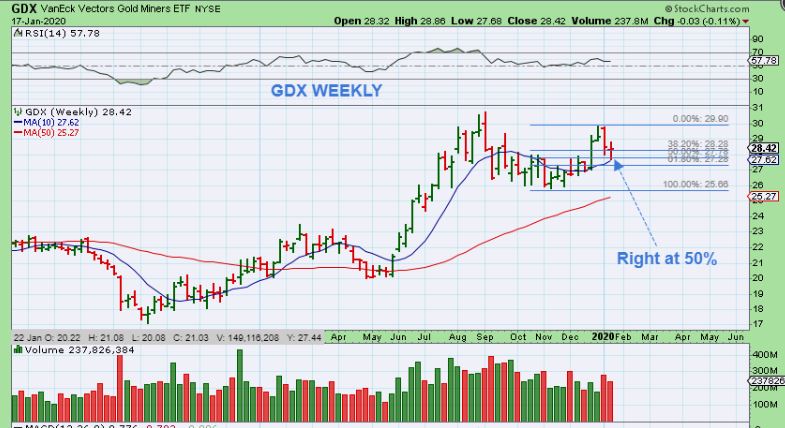
GDX WEEKLY – We have a 50% drop and it landed right on the 10 week ma. This is a normal pull back so far.
.
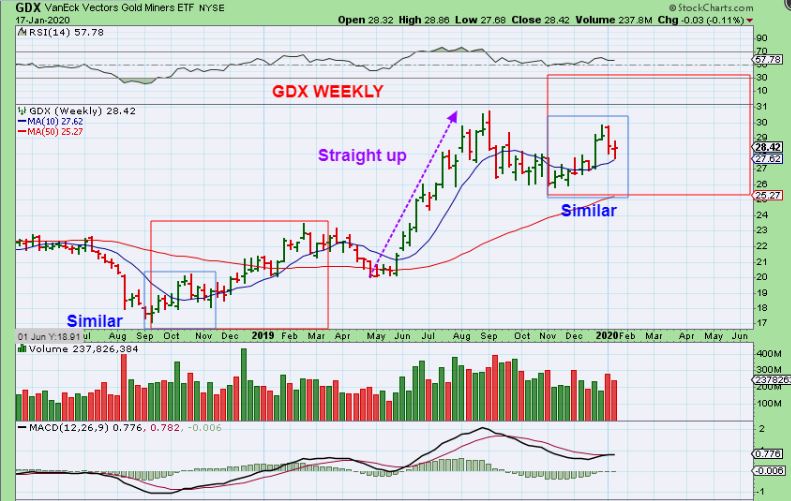
GDX WEEKLY – Look at the little blue boxes on this chart. Do you see the similarities that I see? The ramp up out of the ICL last May 2019 was pretty much straight up, but this one resembles the run out of the ICL in last 2018 so far. That one was choppy and difficult and that made it hard for some traders to enjoy.
.
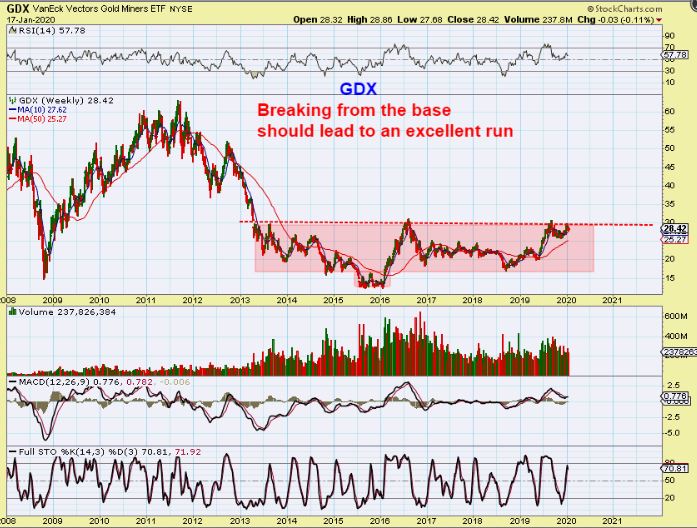
GDX WEEKLY – This is a resistance area too, but I expected the Miners to be able to break out without much of a problem. A break out here should lead to a nice move higher.
,
So that is our updated Big Picture View after another week of trading.
– The General Markets have had many good Bullish set ups to trade that we have been able to profit from, and you can see why. They are running strong & at risk of overheating in a blow off top if they don’t start to correct soon.
– Oil has been choppy and difficult, and that could continue. We’ll keep an eye on Oil in the daily reports.
– Last week I was saying that after that GOLD pop & drop formed a weekly reversal candle, we may see a little sideways action to form a handle on the cup. Now we see the USD moving higher and that could contribute to that kind of price action, but really only time will tell. The precious Metals could also just break higher & run too. Some Miners have been moving higher already. We’ll monitor that in the daily reports too.
,
The Markets are closed on Monday in the U.S. , so enjoy your weekend and the extra day off if you are in the U.S. Thanks for being a Chartfreak with me too!
,
~ALEX
.
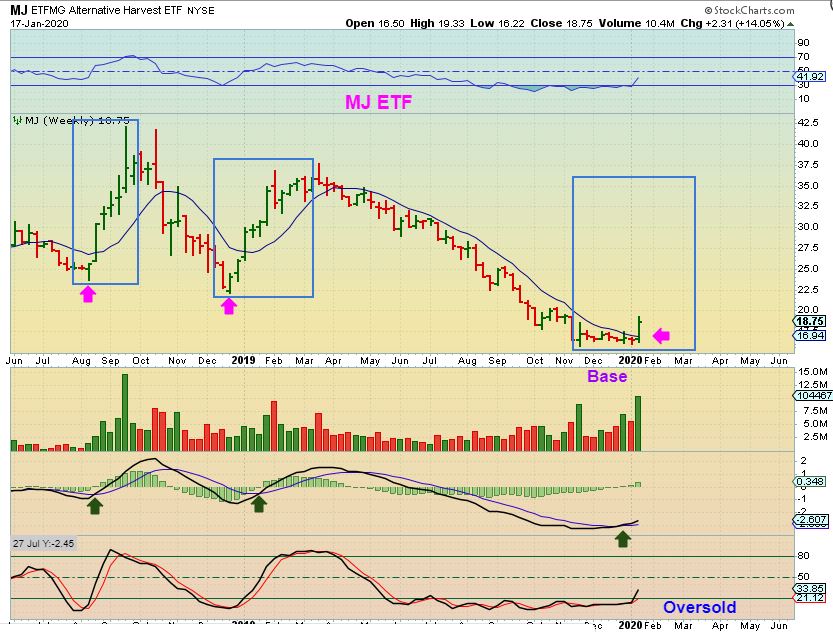
MJ WEEKLY – I pointed out that I thought that The MJ Sector may have bottomed, so this is the weekly chart after the past week of trading. Notice how in the past, when this sector catches on fire, it has gone straight up for a few weeks in a row. Next week may help us to see if we are starting that kind of a move now. This has gone up for 5-7 weeks straight when the buying starts.
c
CRON DAILY – I pointed out some bases that have formed in the sector, like this bullish set up in CRON.
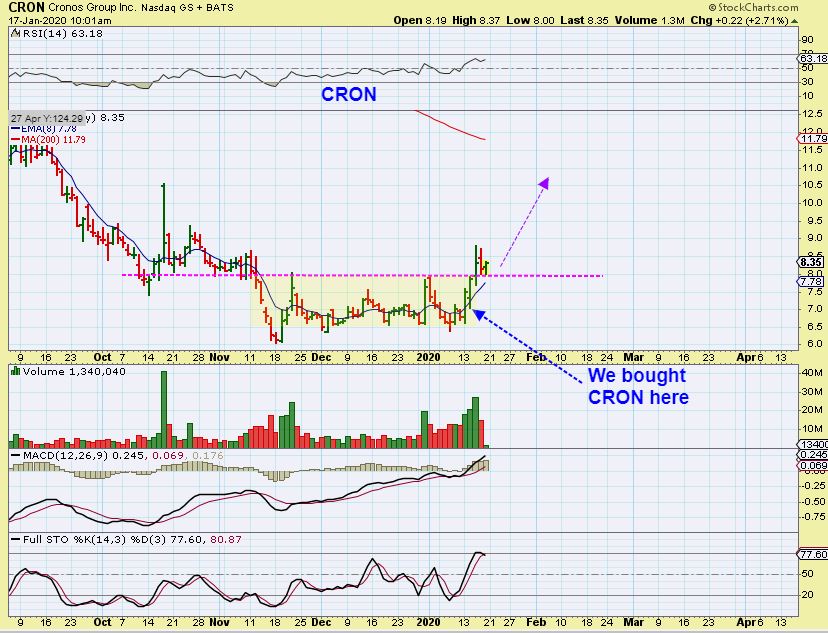
c
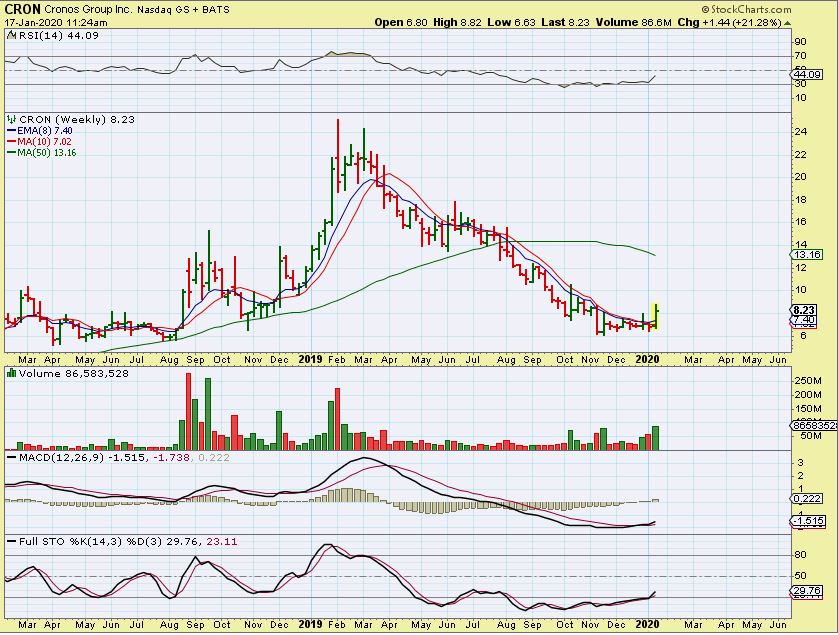
CRON WEEKLY – The weekly chart shows it up 21% last week and with the MACD Cross & increasing volume, we may see more to this action next week.
c
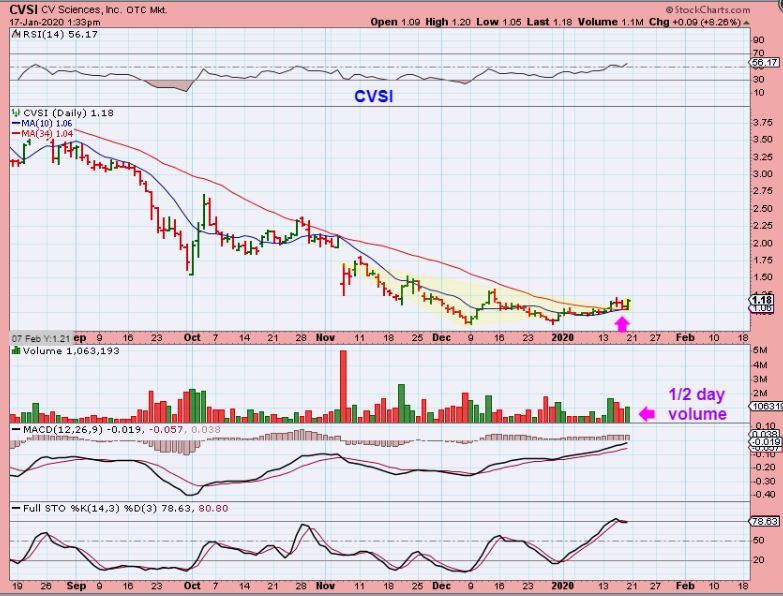
CVSI DAILY – The daily chart of CVSI just turned bullish Friday as it back tested the 34 & 50 sma & began to move higher. I bought this & posted it in the live trading area.
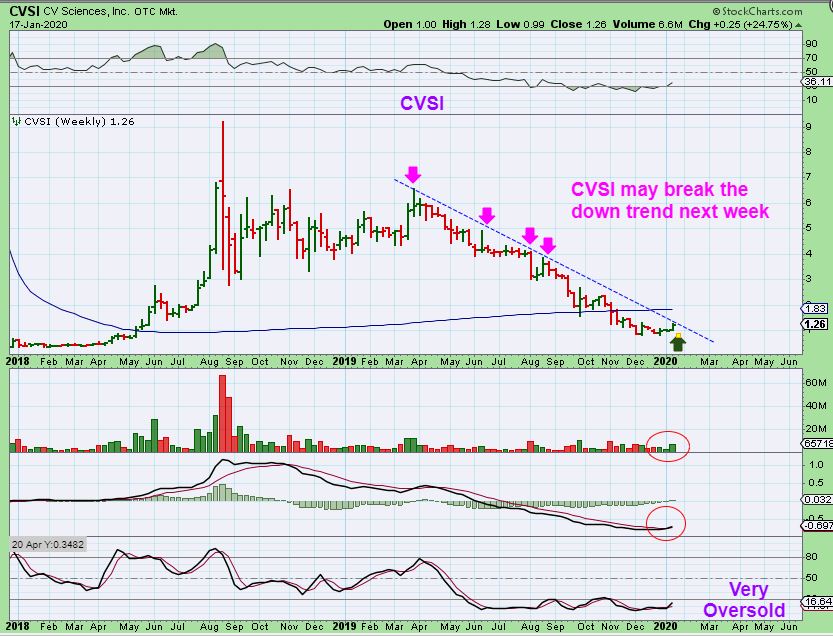
CVSI WEEKLY – The weekly may break out next week.
c
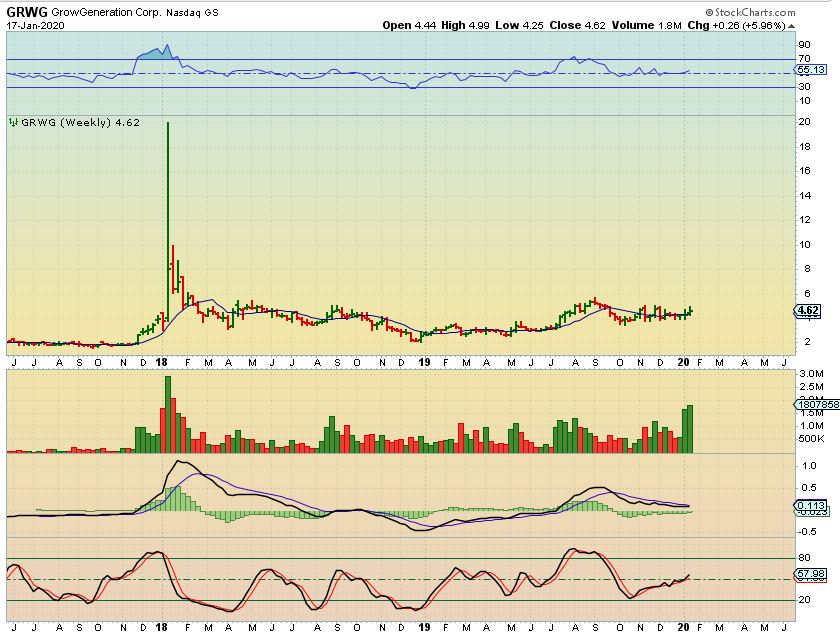
GRWG WEEKLY – This is what I really like about GRWG. It is a very long tight base and the volume is flooding in over the past 2 weeks. When this breaks out, it could really run nicely. I may be a little early, but I do not think that I am wrong on this one. Earnings looked very good too.
.
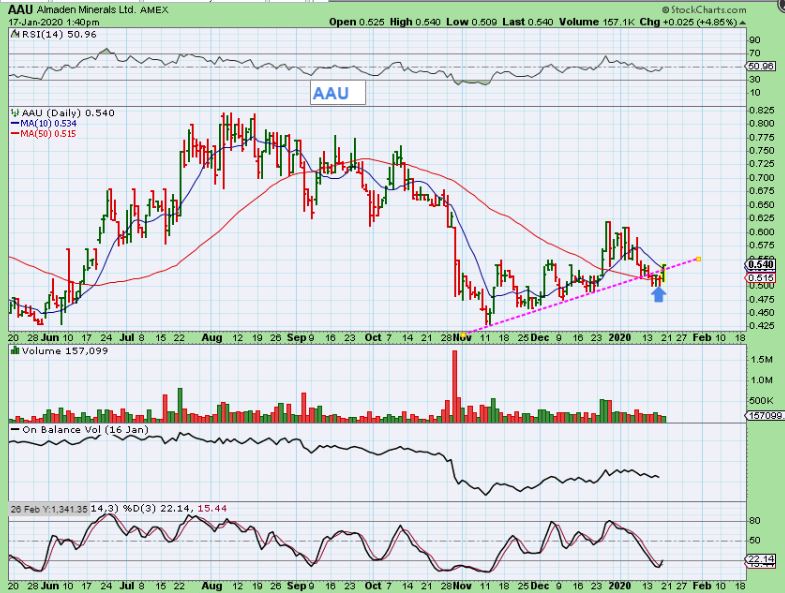
AAU DAILY – AAU started to break higher Friday after reversing on the 50sma , so I posted it in the live trading area (below each report). It was 53 cents when I first saw it, but it started to climb up quickly. It looked similar to GPL- another lagger that started to look good.
c
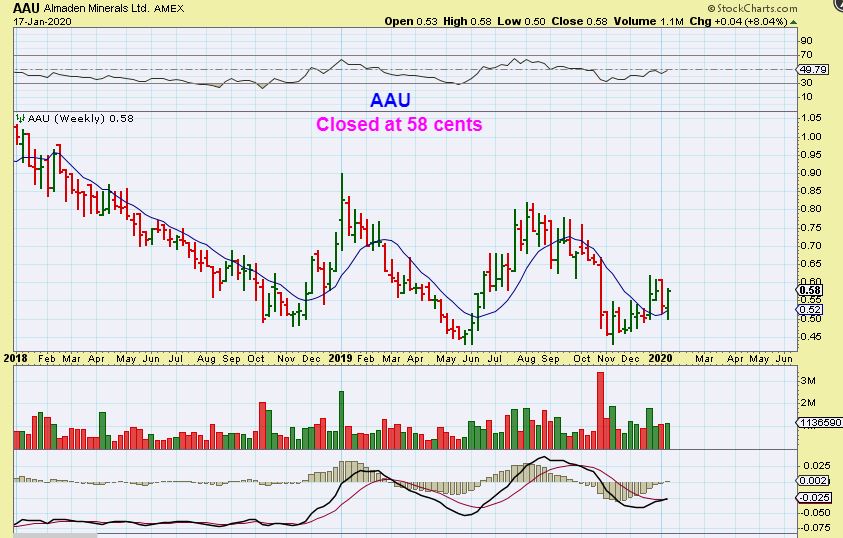
AAU WEEKLY – It actually closed at the highs at 58 cents and looks ready to move higher.
.
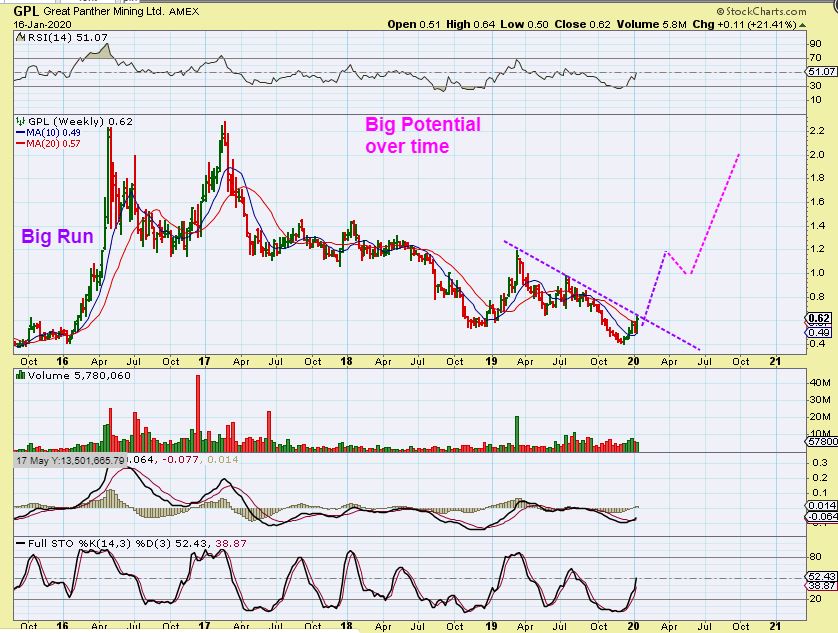
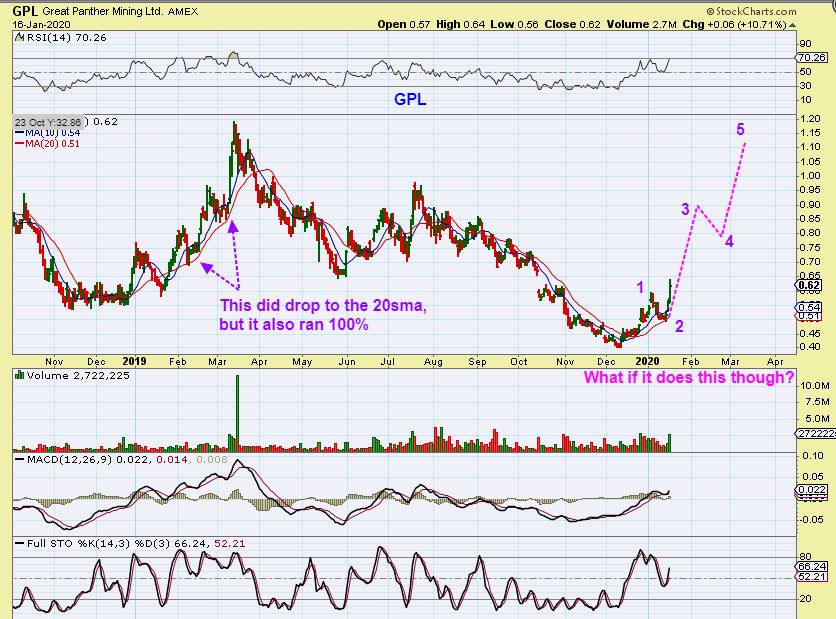
GPL WEEKLY – GPL pushed higher this week, and actually ended up up 21% for the week. It is at resistance, but breaking above this down trend area could see GPL make a nice run ( They released earnings).
c
GPL DAILY – I drew this on Thursday and forgot to put it in Fridays report. Just a vague E.W. type of an idea of how GPL could continue the run to 2019 Highs.
c
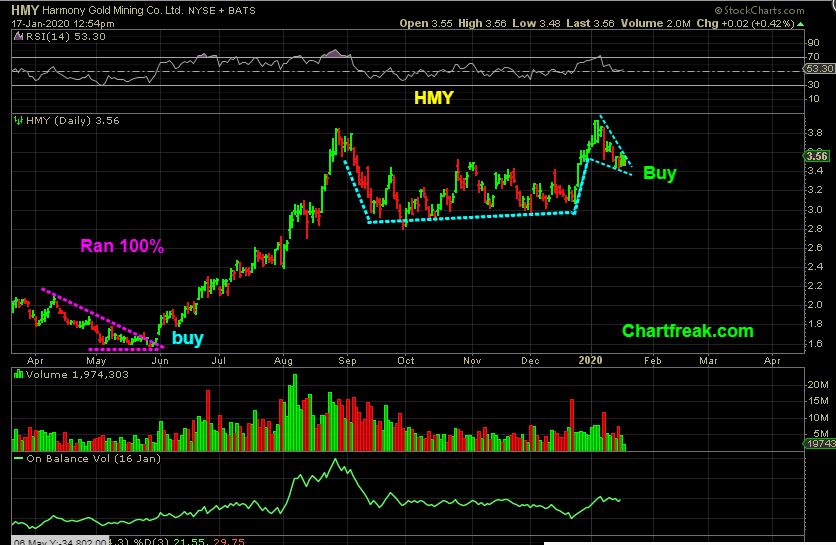
HMY DAILY – HMY looks like perfect cup & Handle at this point. It can be bought with a pretty tight stop, especially if it breaks above the upper trend line of the wedge.
c
.
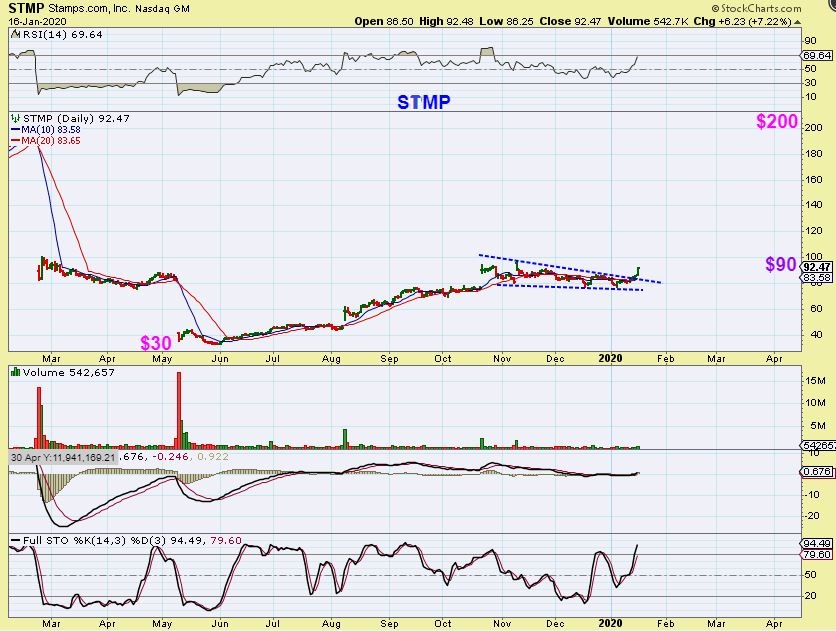
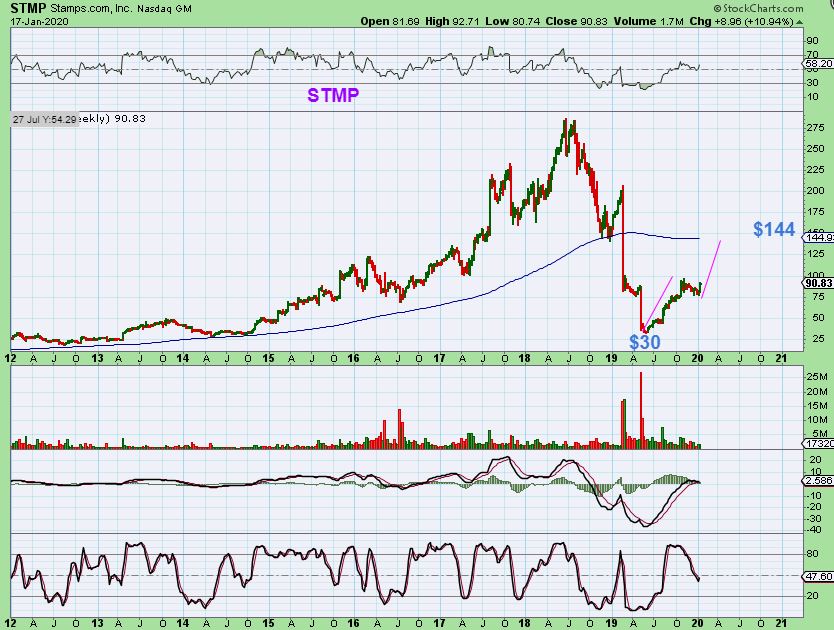
STMP DAILY – I used to trade this company off & on when it made a tremendous run years ago. It crashed but now it just ran from the lows near $30 to $90 again! This consolidation break out is a buy and I think it can run from the $80 area to the $144 area if the markets stay hot. Let me explain & look at the large GAP on the left side of this price chart in March.
.
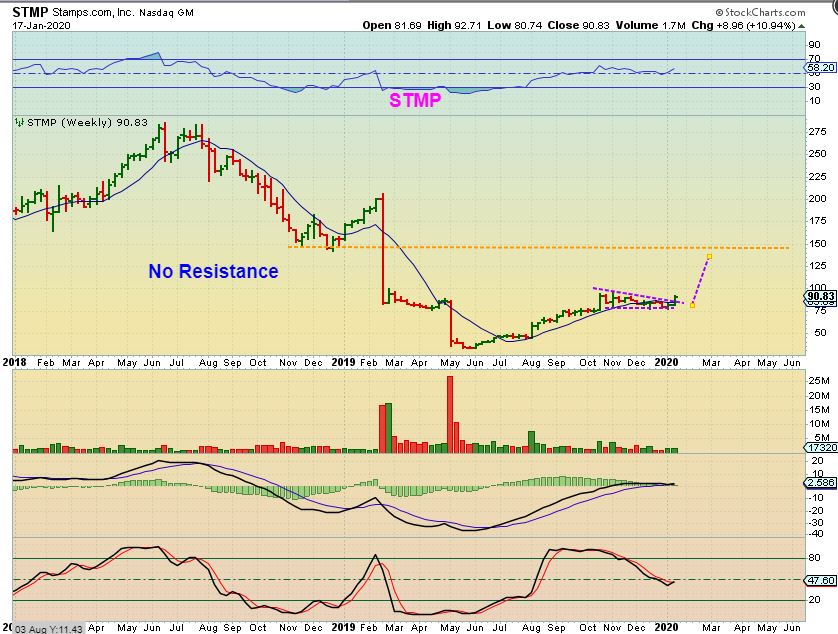
STMP WEEKLY – That is a big gap with no resistance to almost $150. This could be an a-b-c up.
c
STMP WEEKLY – So this is the massive 6 year run from about $20 to $300. Then it crashed. It already recovered from $30 to $90, and a bounce back to the $144 area is possible too, just raise a stop along the way & KNOW WHEN THEY RELEASE EARNINGS.
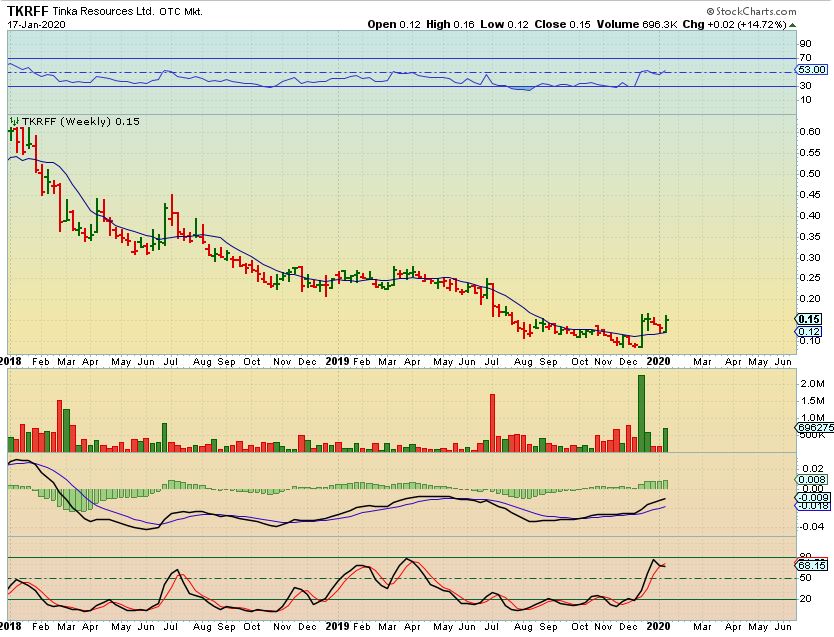
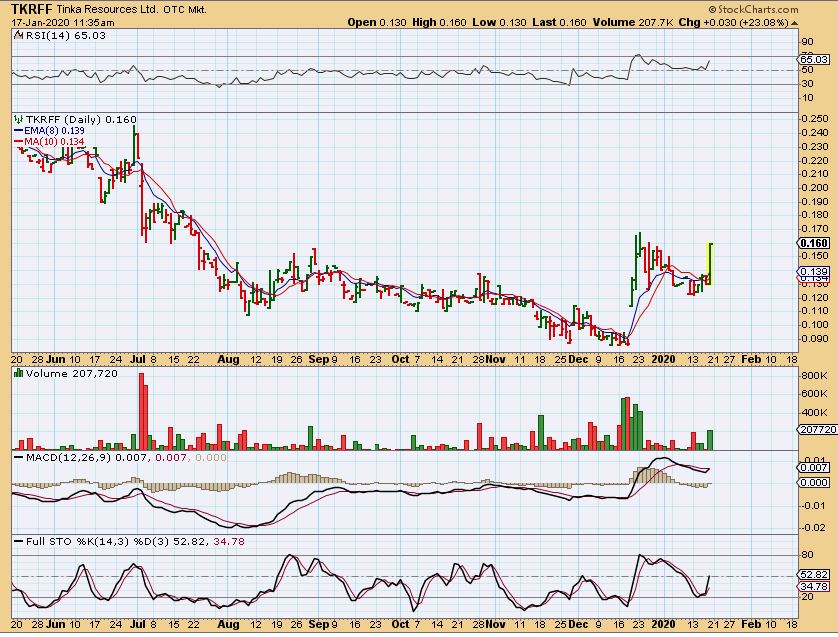
TKRFF DAILY – This resource stock Popped from 9 cents to $0.17 and then consolidated. Now it Popped Friday 23% again. Let’s look at a weekly…
c
TKRFF WEEKLY – I wish I saw this when it landed on the 10 week ma & reversed. This looks very promising and one could start a smaller position & add if it continues to climb higher.