The January 11th Weekend Update
I want to just keep this weekend report simple, so lets get right to the charts…
.
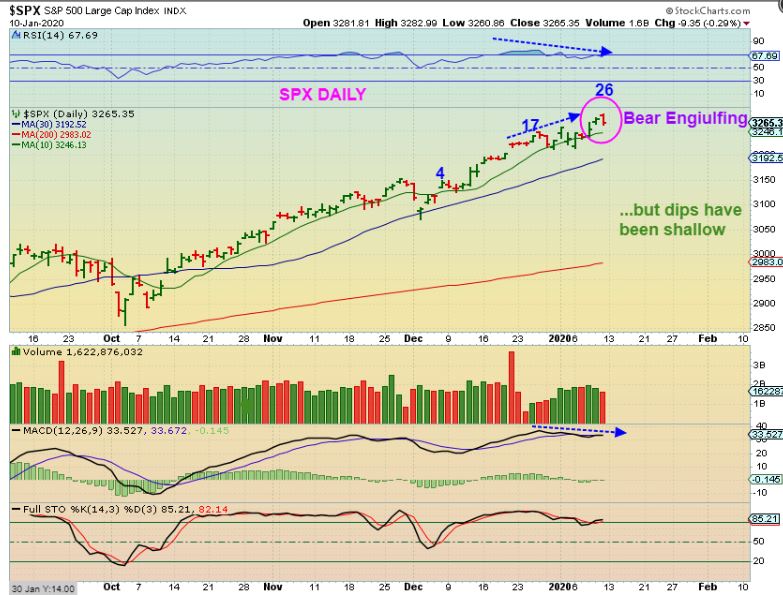
SPX DAILY– I am seeing divergence on the daily chart and now we have a bearish engulfing candle on day 27. This is a right translated daily cycle and remains bullish, however, we are due for a dip to the dcl ( Daily Cycles Low).
.
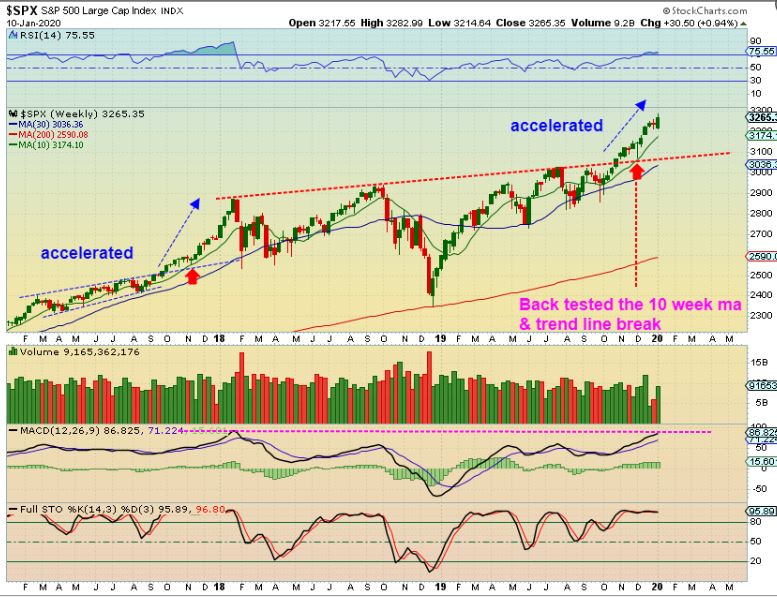
SPX WEEKLY– In the Big Picture we broke out form a 2 year consolidation, back tested that break out and 10 week ma ( Red arrow) , and then the climb has accelerated. This is similar to the red arrow in 2017. These markets can keep running & go parabolic, or they could correct at any time, so using a stop under the daily 13 sma has been working out well.
.
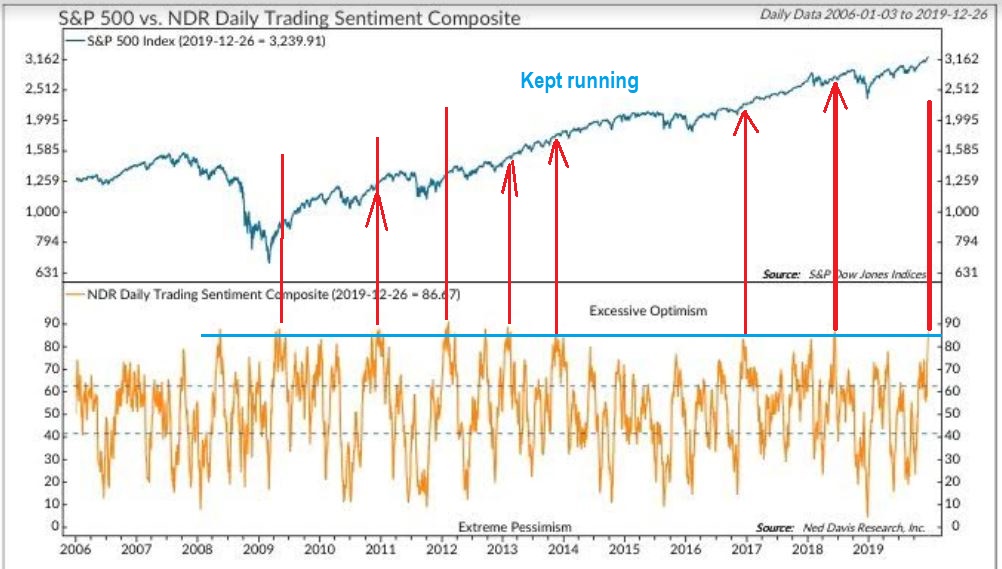
SIDE NOTE ON SENTIMENT – I understand that sentiment is very bullish, but notice that in the past, there were times went this level of Bullishness (Shown in Gold) did not stop a rally from continuing. Instead, I see the optimism died down as the rally unfolded and people became nervous.
.
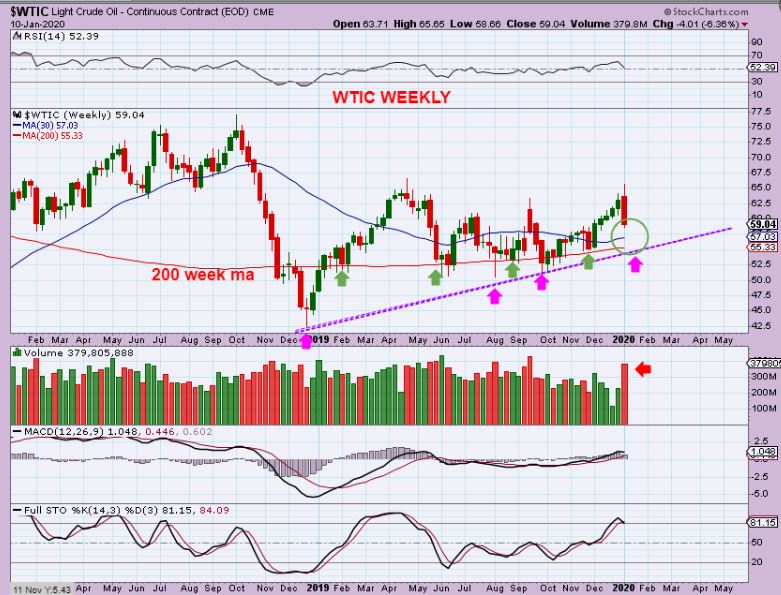
WTIC WEEKLY – Oil Spiked and then had a big drop this week. It does still look like it could drop further, see the chart. On the Far Left side of the chart you’ll see a big 1 week drop in Feb that did not continue, so it CAN happen, but it is rare not to see follow through.
.
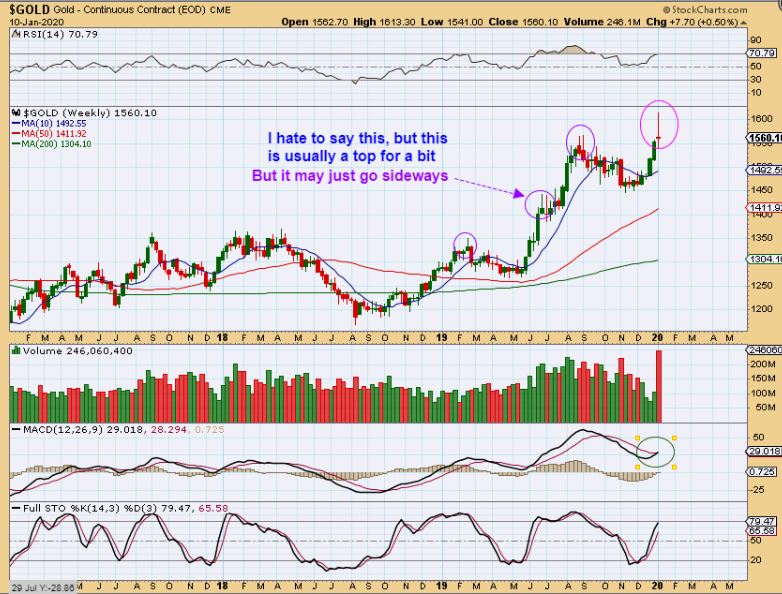
GOLD WEEKLY– Plain and Simple, this is a reversal off of the highs and most often a short term topping candle. Look at the June 2018 time period and you’ll see one where price just went sideways for a couple of weeks. So…
n
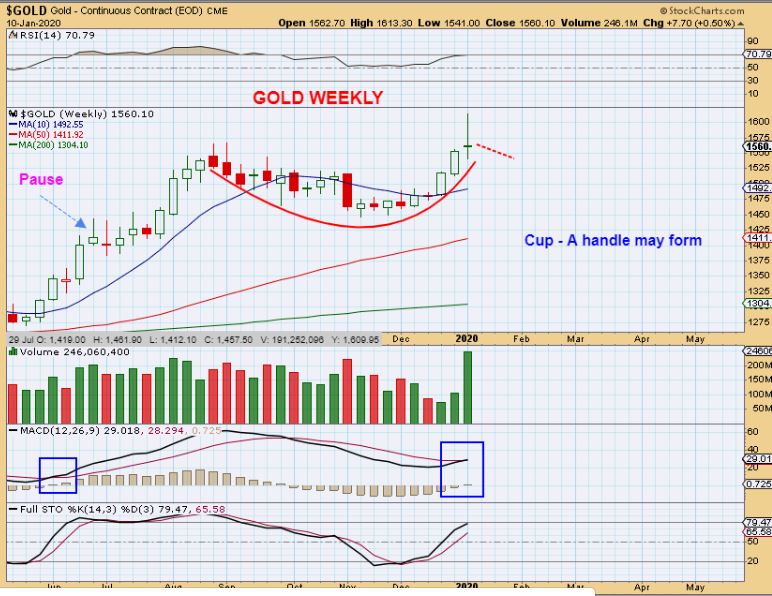
GOLD WEEKLY– We may see that sideways crawl here, and it would form a handle on this cup. This is a very Bullish set up, I do NOT think that this is the end of the run.
.
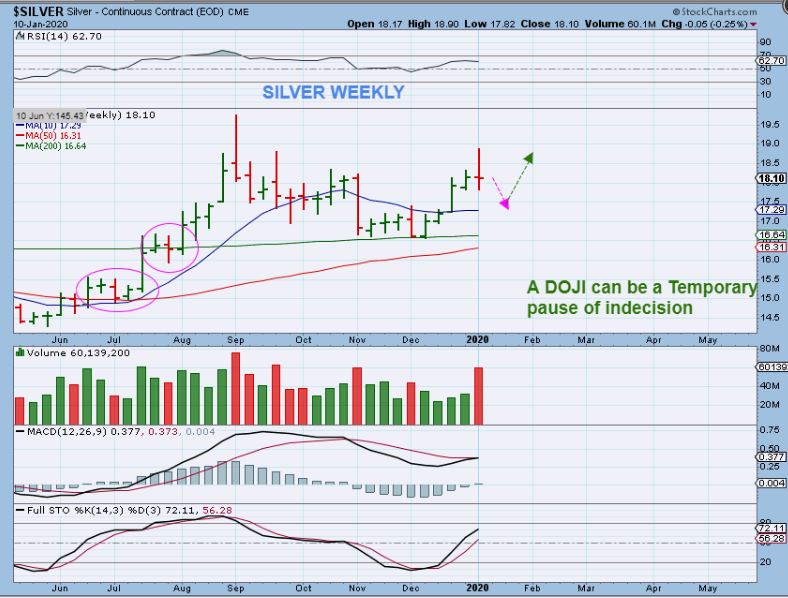
SILVER WEEKLY– A weekly doji is a sign of indecision. If Gold puts on a handle, Silver may stall too. See the magenta circles.
.
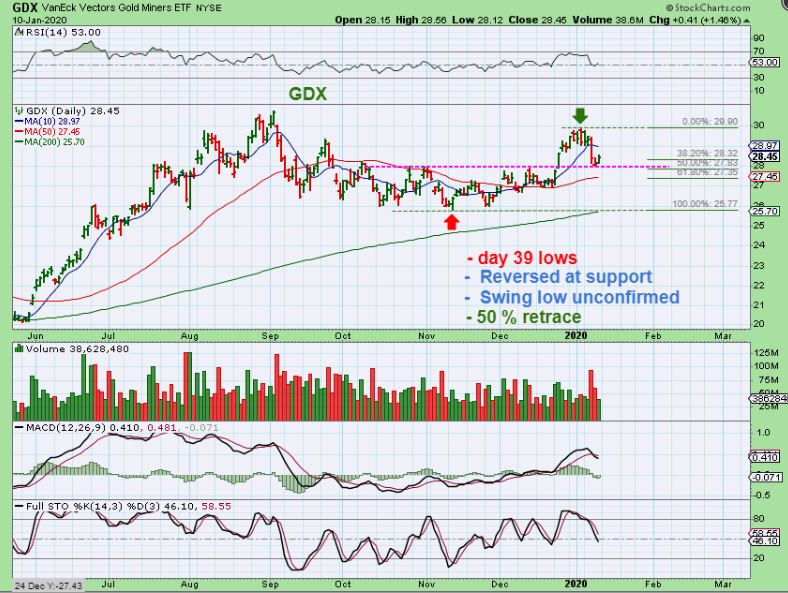
GDX DAILY– GDX reversed at a support level. That was a 50 % drop, which is normal. An unconfirmed swing low formed. So this MIGHT be the low, but look at the 50sma, and if we jump to the weekly chart…
.
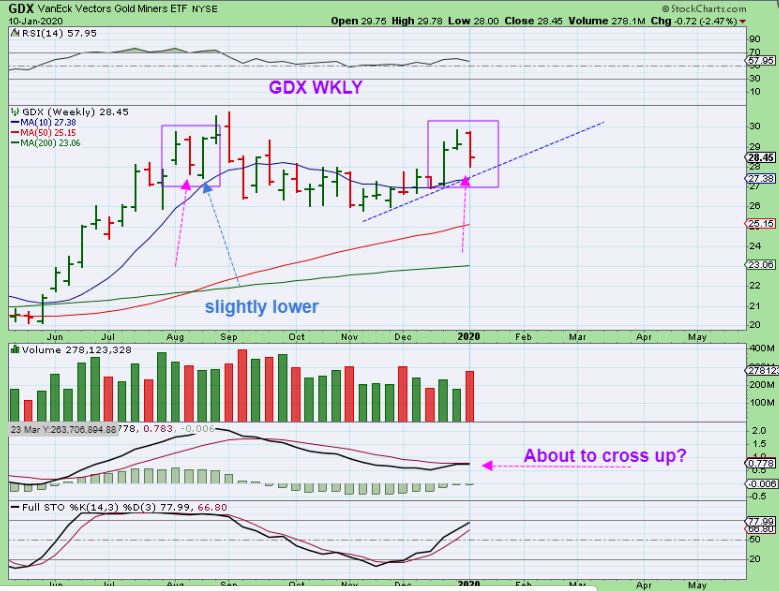
GDX WEEKLY – We had a similar candle with that bounce off of the lows, but it did drop a bit lower the next week before strongly rallying higher. So this might drop to the trend line if Gold stalls next week.
.
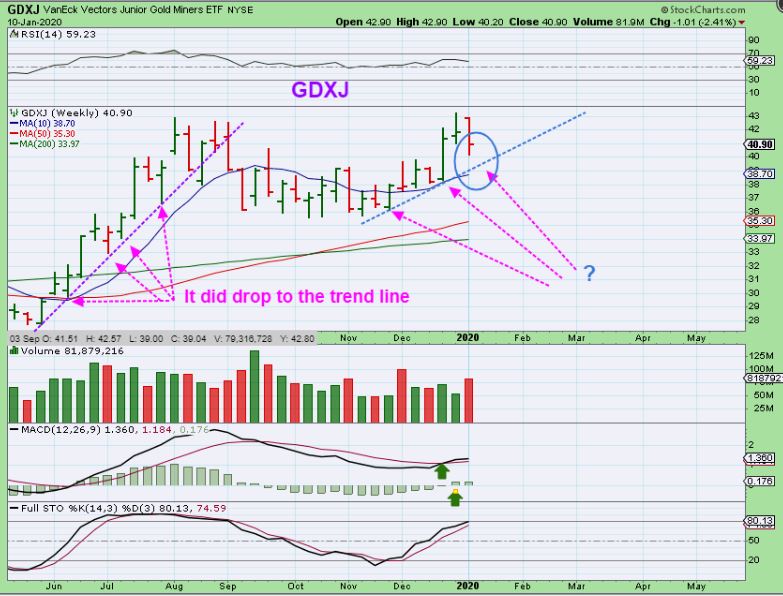
GDXJ WEEKLY – GDXJ could drop to the 10 week ma, a possible target with that trend line too. See the chart.
.
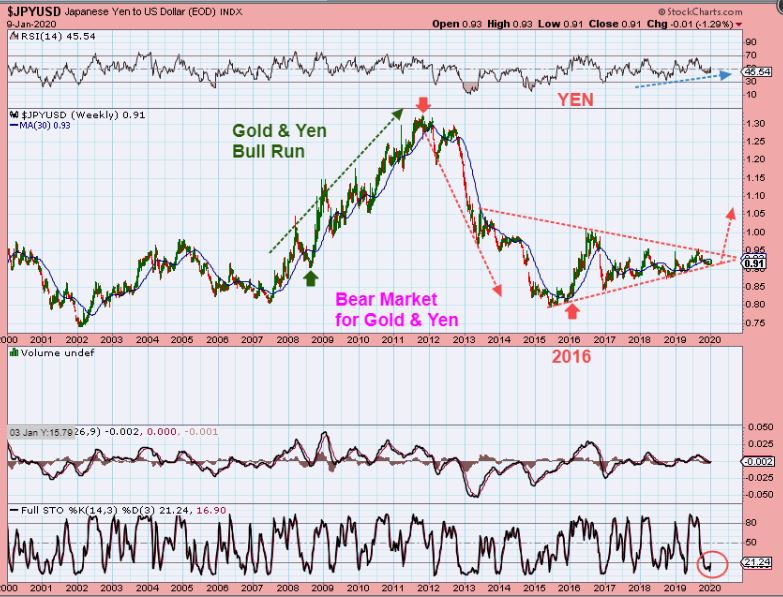
In Fridays report, I said that I was going to discuss two more ideas in the Precious Metals Sector that point to Bullishness ahead. Lately Gold has been able to rise even when the USD has shown strength. This is odd, because Usually Gold rises when the YEN rises and the USD Drops, so let me show you something interesting….
.
YEN VS USD – The YEN / USD ratio rallied with the 2016 Gold rally. It has since been chopping sideways forming a bullish triangle. Obviously if this broke down it would be bearish for Gold, but this set up wants to break out higher. Gold should really rally strongly then, and we are near the apex, so it should be early this year.
.
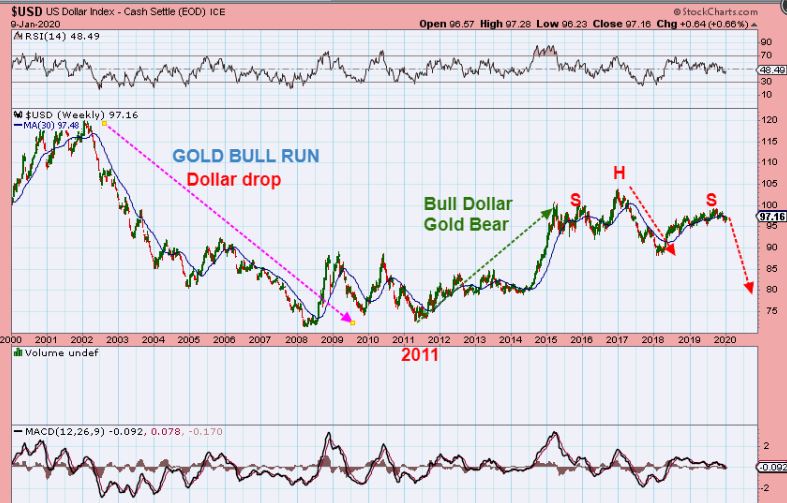
USD WEEKLY– With the USD, I am pointing out times when Gold rallied and when it dropped. Most know …
– Gold was in a Bull market from 2000 to 2011 peak, and the USD crashed down.
– Then Gold peaked in 2011 and bottomed near 2016 again. The USD rallied, and peaked in 2017
– We now see an H&S and the USD MACD & RSI are dropping as the right shoulder rise took place.
– THAT means that the USD looks ready to drop and the YEN looks ready to Rally. The GOLD BULL should then run higher.
.
So last week we saw that Iranian Crisis Spike GOLD & OIL Sunday night into Monday, but then they sold off for most of the week. Did that damage or harm our big picture? Not at all. My main goal with this report was to renew or strengthen your ability to see that sometimes ‘these big splashes are just ripples in the pool’. 2020 still looks like it will be a great year for the Precious Metals Sector and our Miners, we’ll just have to wait and see what next week brings our way. 🙂
.
Enjoy your Weekend!
.
~ALEX
.
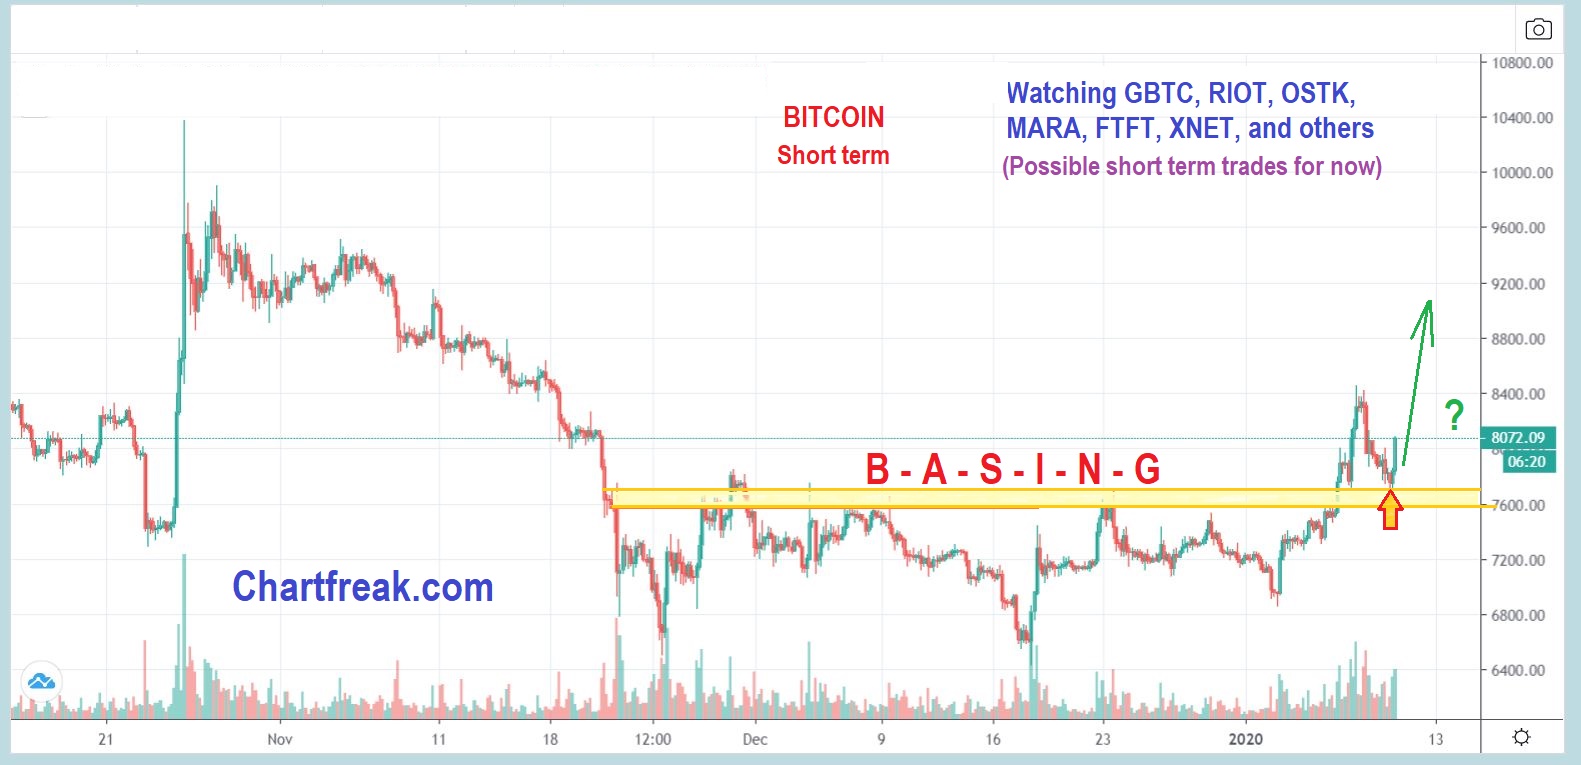
BITCOIN DAILY– I drew a short term chart of Bitcoin, and at least in the short term it has become Bullish again. I have mentioned some of the Blockchain companies that often benefit & trade well when Bitcoin runs. Let’s discuss this just a little more. Read the chart.
.
First I want to emphasize the risks. These move FAST and can be unpredictable. I have traded them with great success out of the lows in the past, but I have also mis-timed a few and been cut in the process, so please know that they move fast & have risk—- if you just want to watch Gold, Silver, & The Miners and buy the dip in that sector, or continue to wait in your current Gold stock positions for the next big run, that is great too!
.
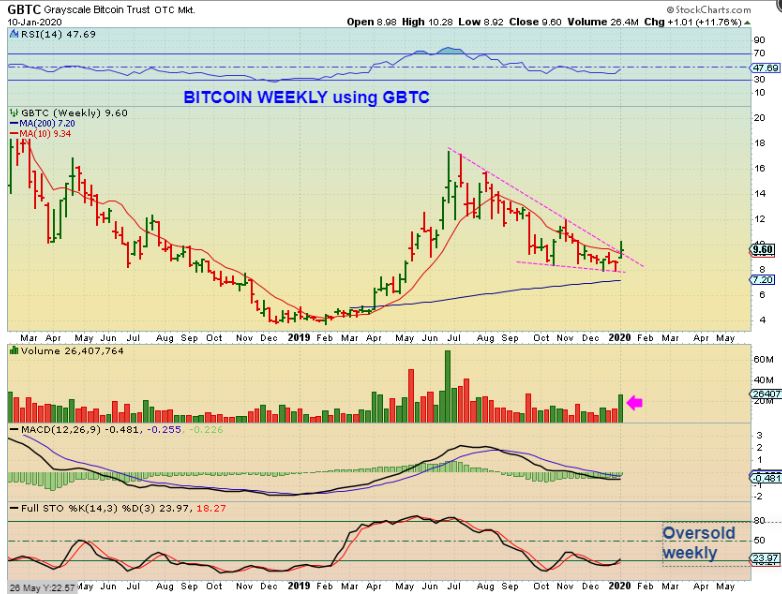
BITCOIN WEEKLY– I have been watching this and this week we look to have a break of the down trend with increased volume. This is oversold. That looks bullish, so GBTC could be bought with a stop as a substitute for BITCOIN. In early 2019 it ran from $4 ish to $18 ish. Not bad, huh?
.
OSTK DAILY– I have caught some of the OSTK runs in the past, so let me point this out. The daily price broke above the 10 ma after being pinned under it for a long time, the RSI is bullish…
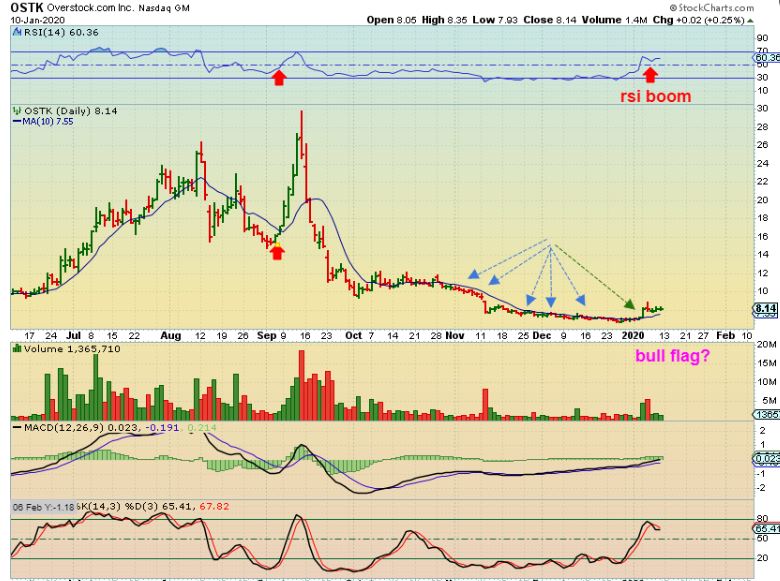
.
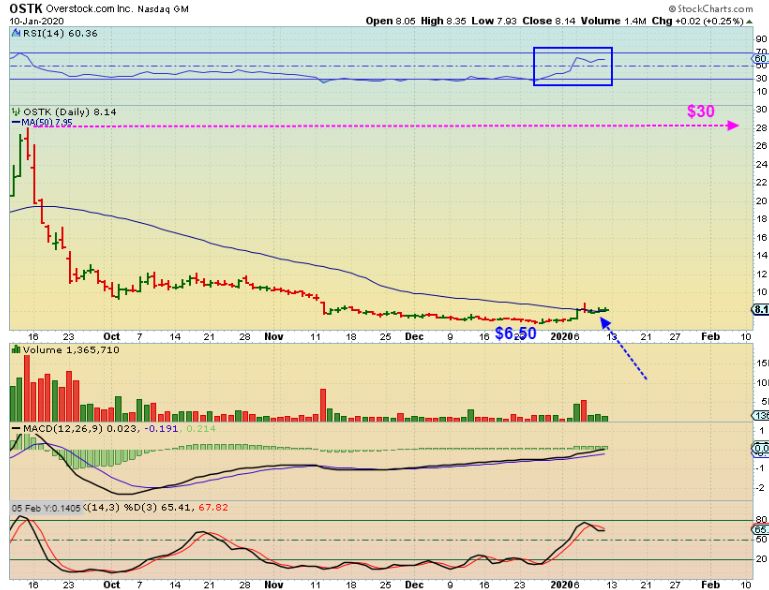
OSTK DAILY– It has now moved above the 50sma and that RSI is Strong. Do you see the upside potential if this gets going?
.
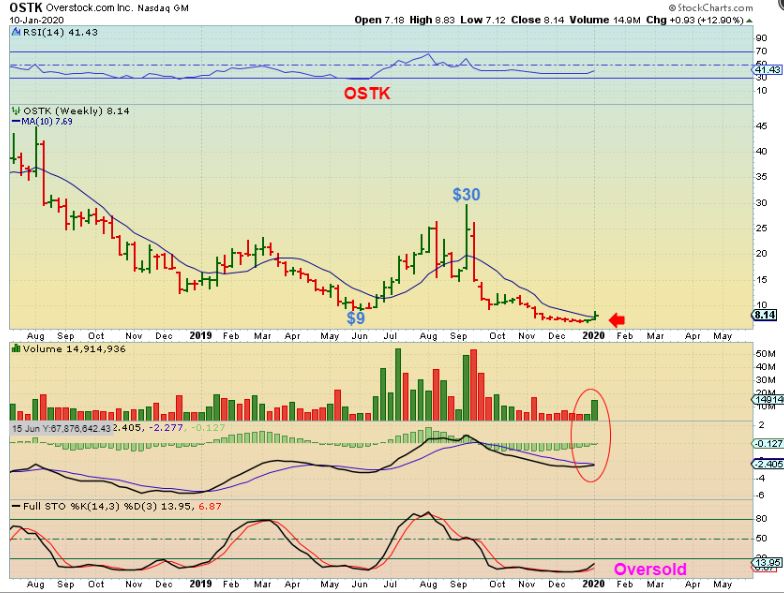
OSTK WEEKLY- This ran from $9 tp $30 in 2019. When Bitcoin crashed, it crashed harder. Look at the weekly Volume Pop & it closed above the 10 week ma. I own some.
.
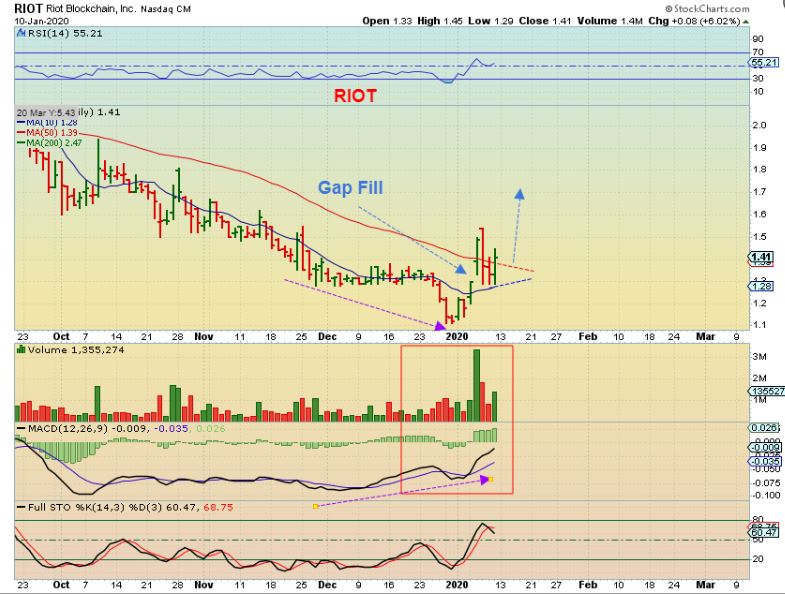
RIOT DAILY– I pointed out RIOT at the 50sma . A close above would be a bullish development. I bought some under the 50 sma …
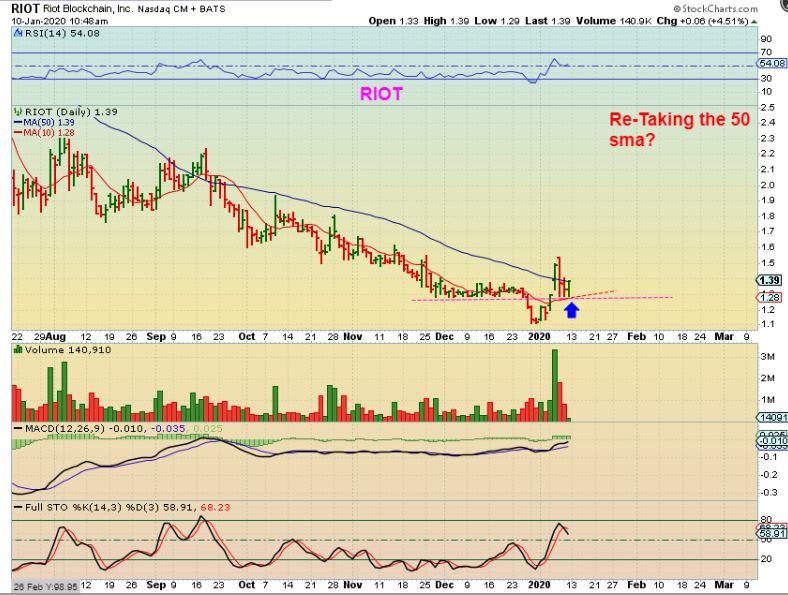
.
RIOT DAILY– It did close above the 50 sma & the volume spikes are encouraging, and the weekly chart?…
m
RIOT WEEKLY– Riot ran from $1 to $6 last Dec to April 2019. It was pinned under the 10 week ma before that run, similar to what we see now ( See the chart). We just broke above with strong increase in volume, and this is very oversold. Just another run to the 200 week ma would be nice.
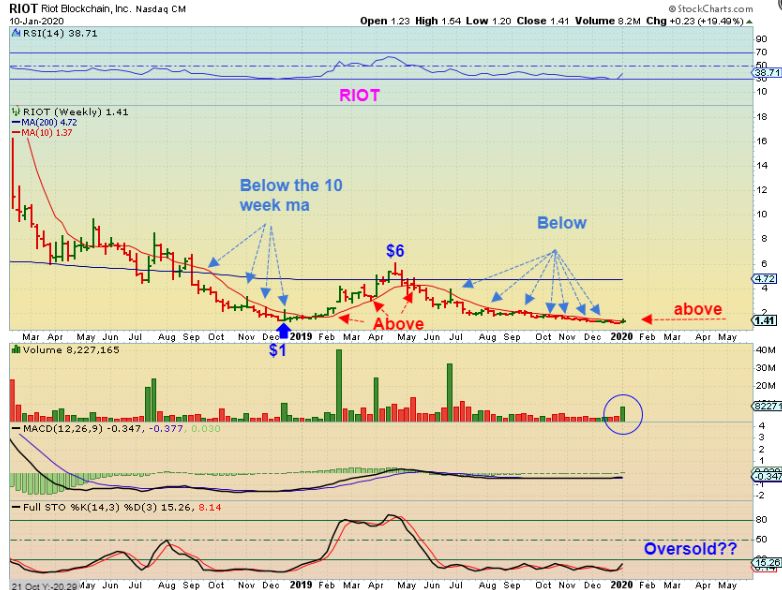
PLEASE DO NOT go in too heavy thinking that this is a lottery ticket to get rich, just to double & triple your money. The set up is good and the sector seems to be improving, but one word of bad news can send a stock like this down 20% or even more. A reasonable position may pay off for those that like to trade. Lets just say that even 500 to 1000 shares of Riot at $1, after running to $4, would be very nice gains.
.
RRC DAILY– Thursday we discussed RRC as an Oil & Nat Gas property company. It dropped & reversed at the trend line & 50sma as a buy. This is a great chart set up really. What happened Friday?…
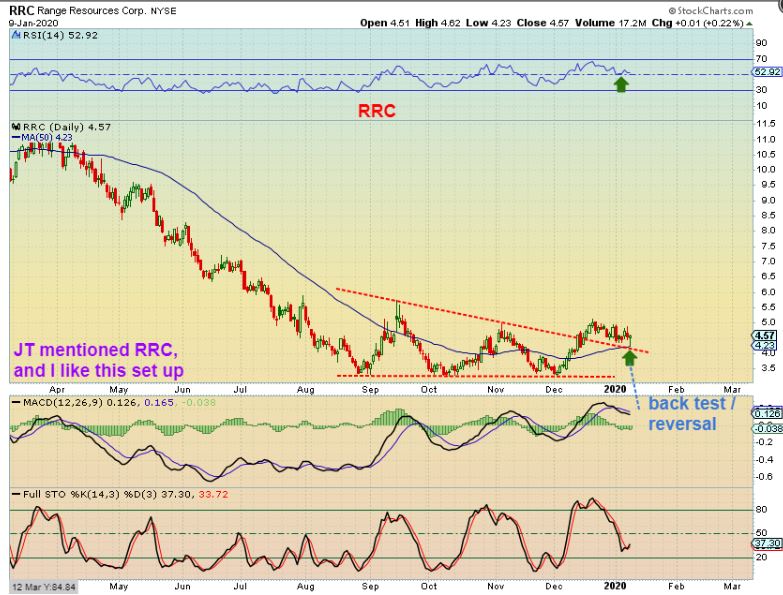
,
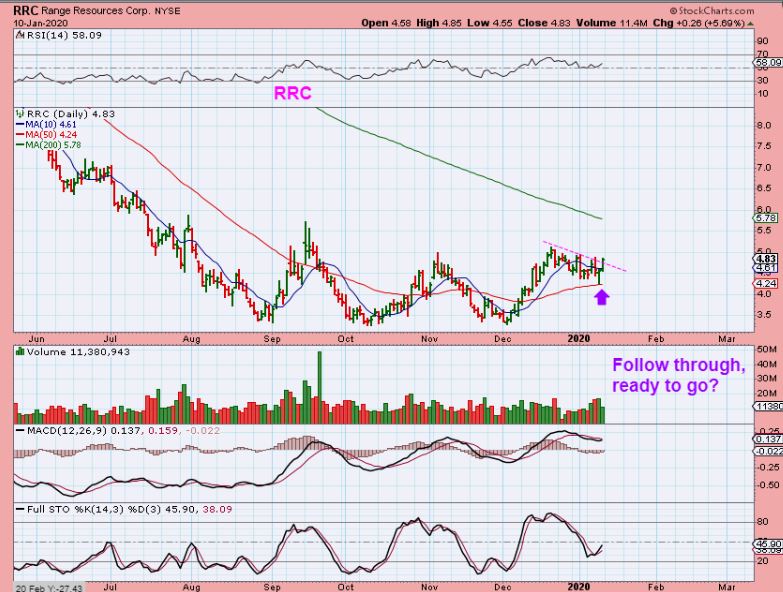
RRC DAILY- We saw follow through and it could be breaking a down trend. Also…
.
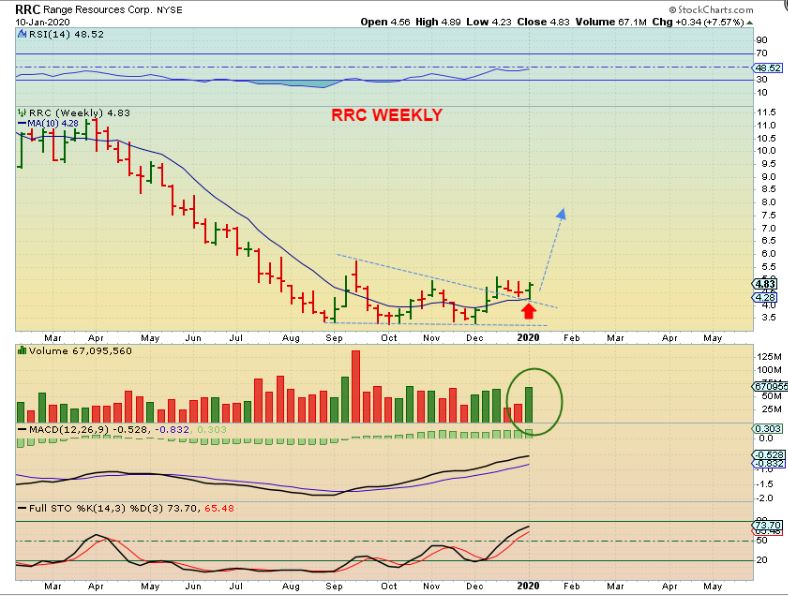
RRC WEEKLY– That gain Friday really makes this weekly chart VERY ATTRACTIVE. I could easily see this double or more over time, if the sector stays bullish. RRC is still a buy.