December 14 Weekend View
I had to leave the live trading area early yesterday and now as a result of my current family needs this weekend, I’ve been a bit limited on time this Saturday. In order to get this out today instead of Sunday, I need to be a bit more Brief and to the point. That said, You will still know exactly how I feel after last weeks F.O.M.C. week of trading. And as a bonus, on the way back from the hospital this morning, I did see these 2 bulls on the side of the road, so I snapped a fresh picture to give us our Theme. That theme is that ” We are looking at some Bullish developments!”
.
In the General Markets we have discussed 2 ideas:
1. Possibly breaking higher & rallying to a blow off top / parabolic run, or…
2. A false break out with a left translated daily cycle that begins our drop into an ICL , maybe by day 15
3. Different views show differences, so I will cover 4 views…
.
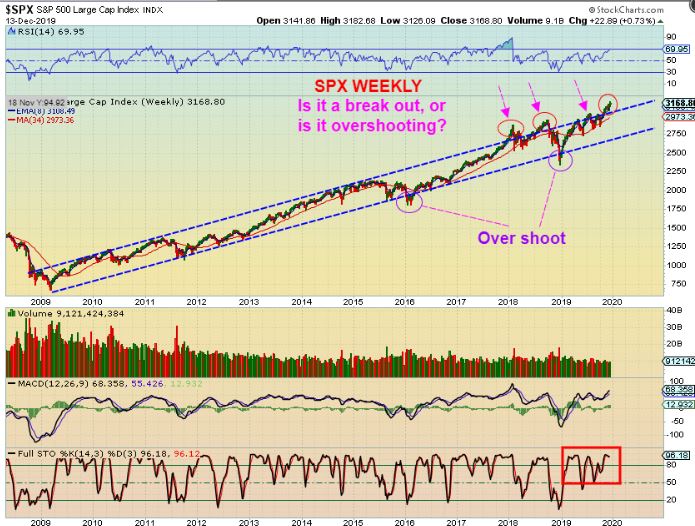
SPX – When a channel develops and price overshoots, often it will snap back inside. We could be seeing that since an ICL is due. On the other hand, there is still that chance that it is breaking out for a steeper run, so…
.
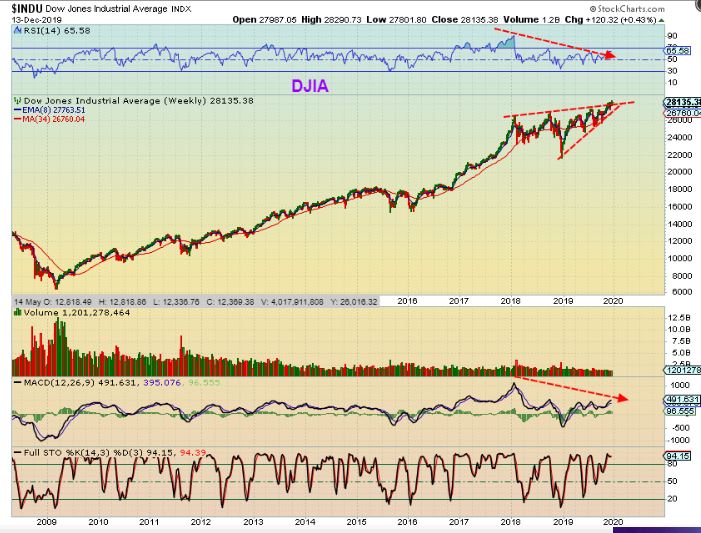
DJIA – The DOW could be viewed as a bear wedge, and a break down would be quite bearish. Going forward, we should watch for a Break down or not. If not…
.
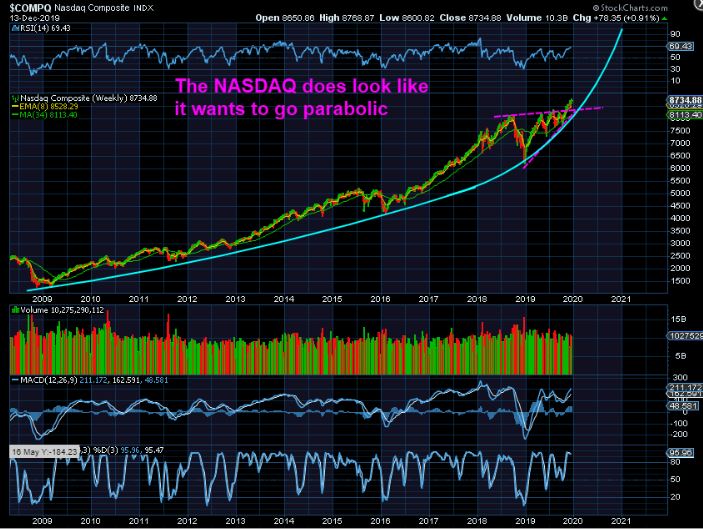
NASDAQ – We see that the NASDAQ also looked like a wedge, but it broke out higher & has held above the break out. Wht if that continues? THAT COULD SIGNAL a steeper climb is coming- one that could conclude as a parabolic blow off top. Also …
.
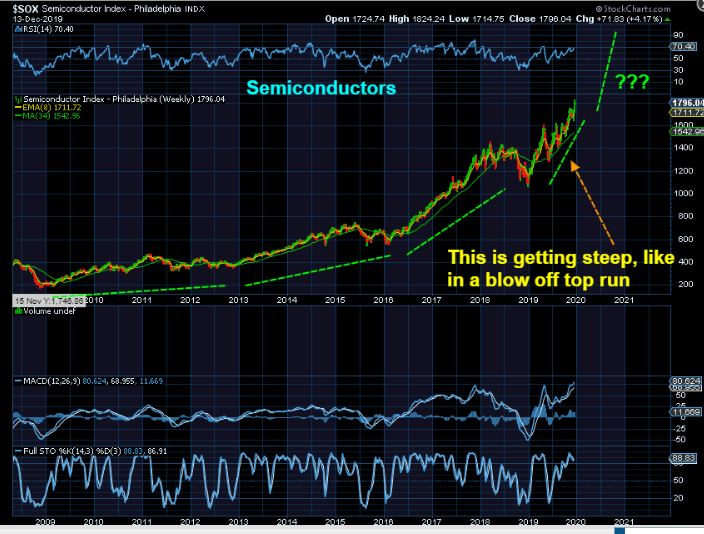
SOX / Semiconductors – The current choppiness in the SOX is actually turning into a steep climb too. This looks a bit more advanced than all the others, so with the SOX chart and the above 3 charts, I think that we can conclude that a parabolic blow off top is very possible. The SOX may be leading the way.
CONCLUSION: SO FAR THIS IS A BULL RUN FOR THE LONG POSITIONS. USE STOPS ALONG THE WAY AS ADVISED IN THE WEEKDAY REPORTS, and IF WE SEE A BREAK DOWN into the ICL, that will need to be monitored closely.
.
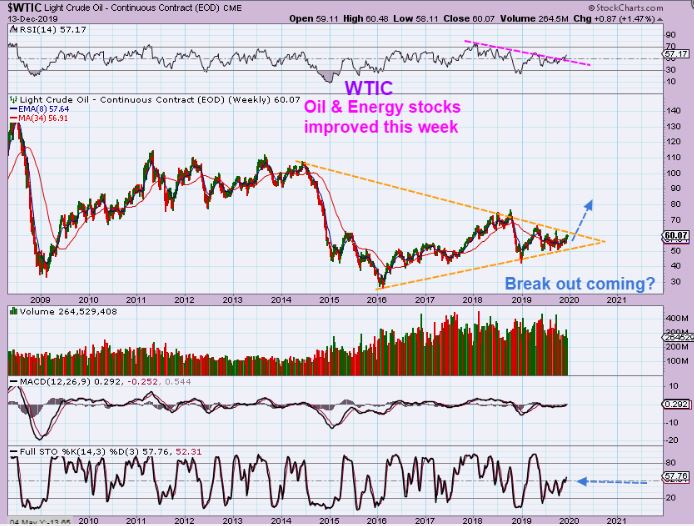
WTIC – Oil has been choppy and sideways all year, but now as 2019 is ending, so might this chop. We are in the APEX of a triangle, and a break out can start a trend. Many Oil / Energy stocks also began running out of the lows – we discussed OAS, DNR, LPI, WLL, XOP, etc etc , even in my last report Friday. They popped 10-20% for the week, but have we ‘missed the moves’ if you weren’t in yet??…
.
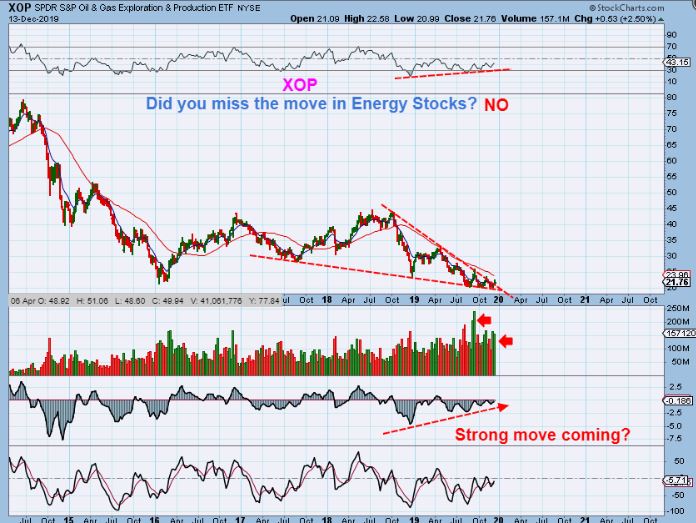
XOP WEEKLY- No, you didn’t miss the move- The Move may be just starting. This chart looks very Bullish now and a big move higher could be coming. High volume spikes & strong divergence on these indicators signals a break out should be higher.
.
.
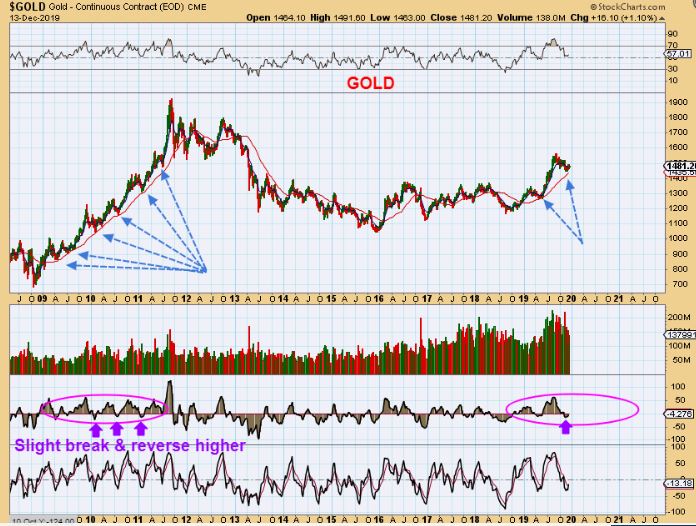
GOLD BIG PICTURE – This is Very Bullish as a Big Picture. An ICL was due at the latter part of 2019, and it looked like Gold should back test that base break out of the base, but this might be all we get for a pull back. I got a STRONG BUY in GDX in November and this current reversal is similar to where the 2008-2011 Bull Run would have reversed. See the chart.
.
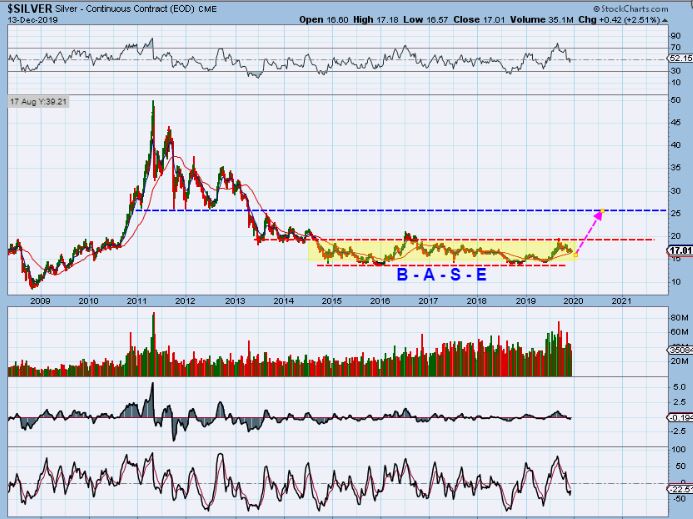
SILVER -And when Silver gets going, it will break from a long base, which should send it quickly toward the $25 ish area or more. That will be very bullish and the Silver stocks have taken the lead already.
.
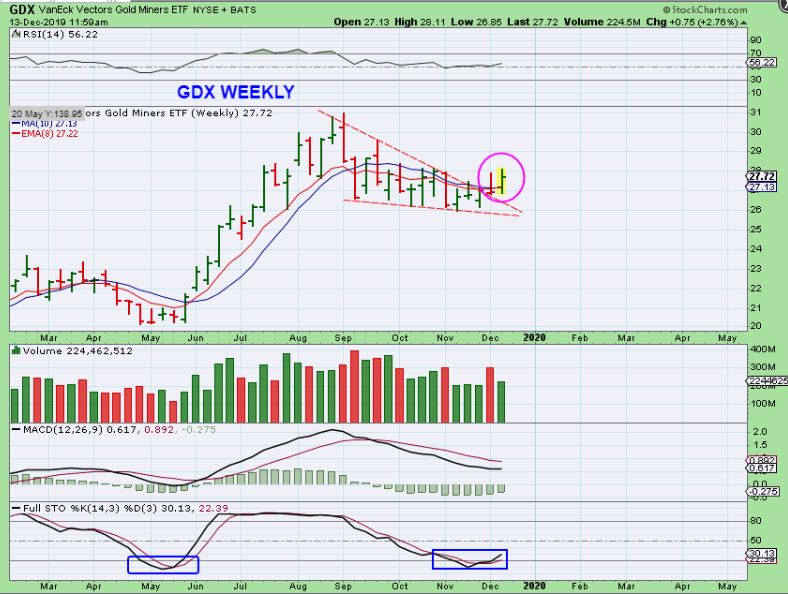
GDX WEEKLY BREAK OUT – Last week we saw a break out that reversed lower. With the fomc mtg ahead, it was a bit risky, but now that we have that fomc decision behind us, how did the week end? THIS IS A VERY NICE CHART!
.
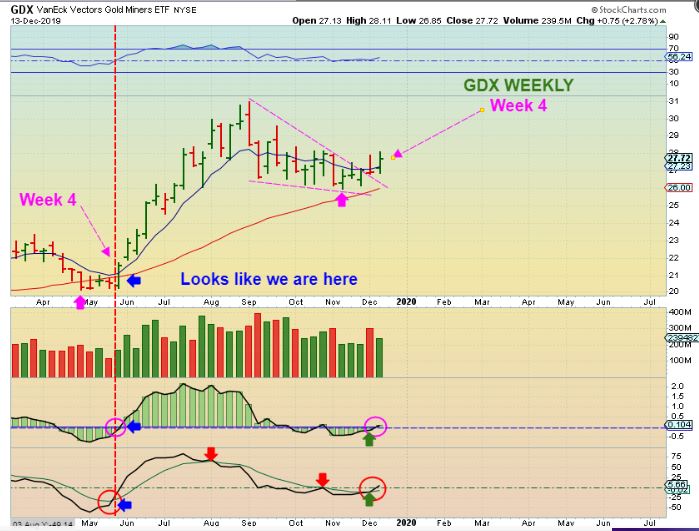
GDX WEEKLY BREAK OUT – Look at MAY 2019. After a sideways chop, on week 4 it pushed higher above the 10 sma & my indicators below triggered . The exact same thing has happened now. Now look at how big of a run followed from May to September. A duplicate would run from now to March or April. This chart is calling the Bulls.
.
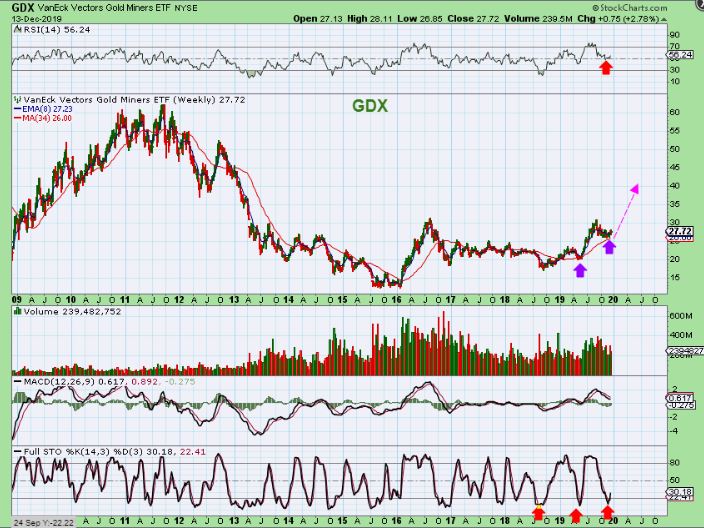
GDX BIG PIC – And this chart is even better! What a beautiful shot of the potential for our Miners. This is weekly Oversold, the same as the last 2 ICLs ( See Purple & Red arrows).
.
.
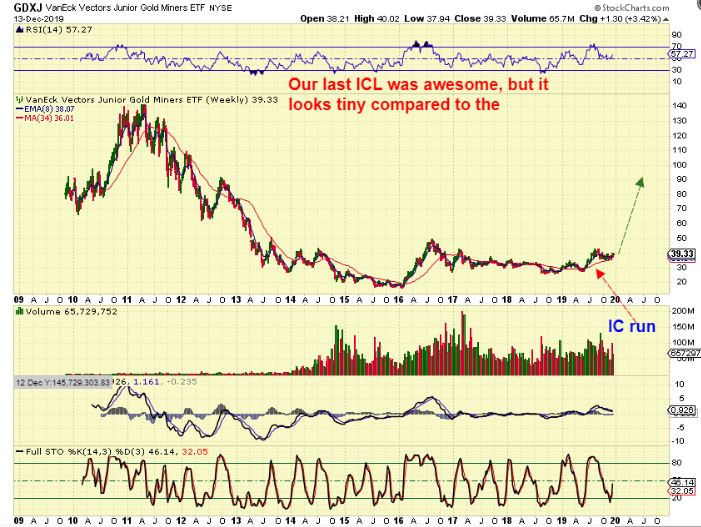
GDXJ BIG PICTURE – That last run looks like a small line on the Big Picture Chart. You can see the longer term potential to the upside, but you have to be in it to win it. I can’t say that it will now be straight up or that it wont be choppy at times, but I do believe that the ‘correction phase’ is over.
.
Each week I get an email or two saying, ” I read another guys report, and he isn’t buying until the COT drops to a certain amount, so I have been waiting. What do you think about that?” Well, so far he must have missed quite a nice chunk of gains in just the last week or two with some of these Silver stocks. Also, look again at that weekly chart of GDX & GDXJ. You should have AT LEAST a small basket of Miners that I have pointed out in the reports.
Take a small starter if you are nervous ‘risk-wise’, position size also controls risk. THIS CHART BELOW THAT I DREW UP says that we could be at the start of a major rally. I was buying at the dcl in November, I can’t let the COT keep me out with all of these other Bullish signs. I’ll use stops for safety if needed.
.
I have pointed out some additional nice low risk entries in recent reports of November & December with FSM, AXU, HL, GSS, etc. Several of these were still in the lower end of the cup.
.
This was AXU recently, and I showed its upside potential based on the last run, and I also said that I bought it as a Silver Laggar…
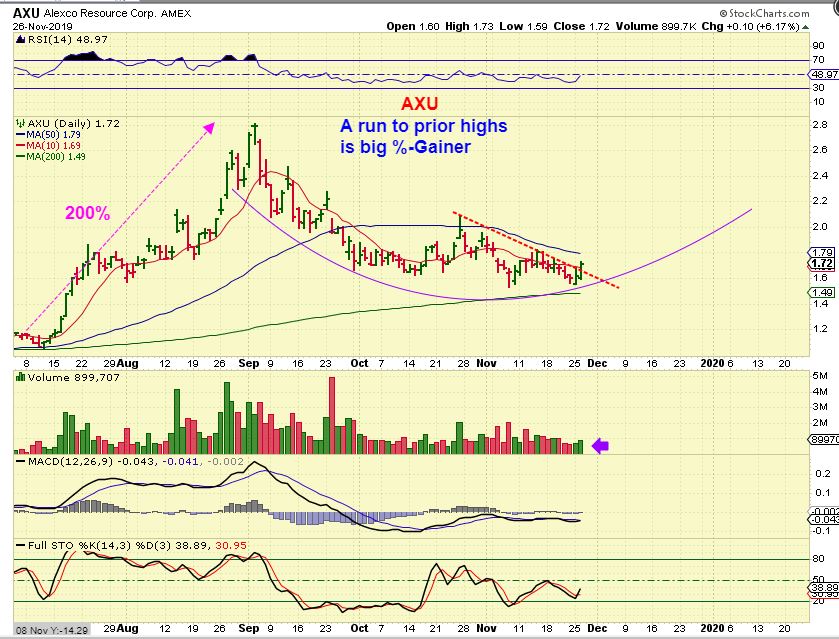
.
AXU – It looks to be forming that cup like so many others. It got choppy, but it is holding up well.
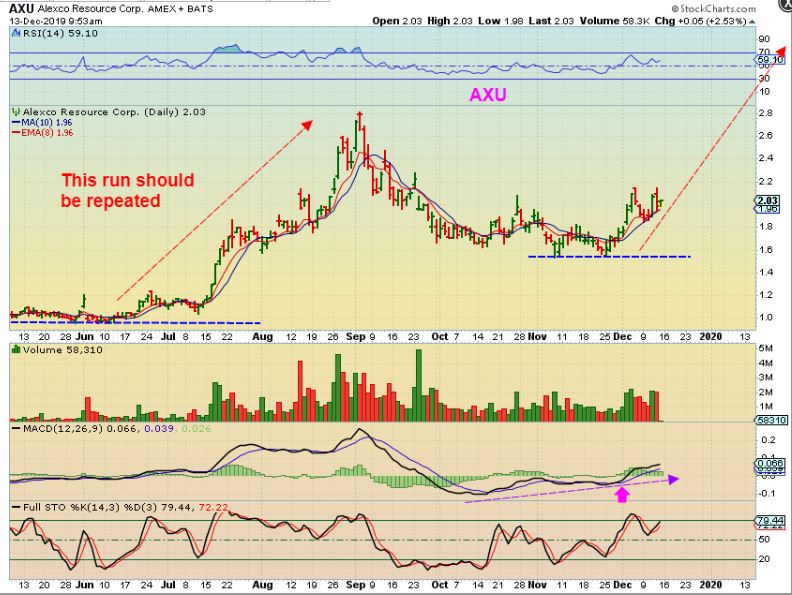
.
This was FSM with an earnings shake out & recovery in November …
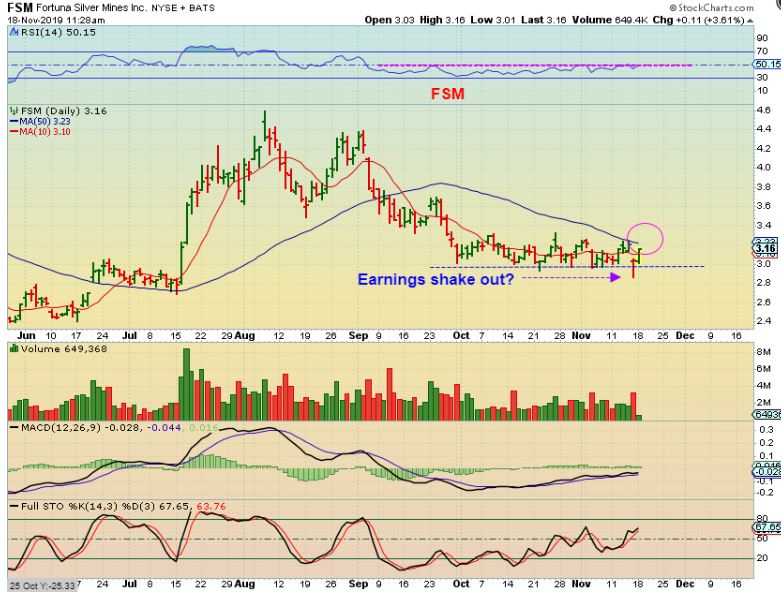
.
FSM NOW – It is also forming that Cup, similar to AXU , so…
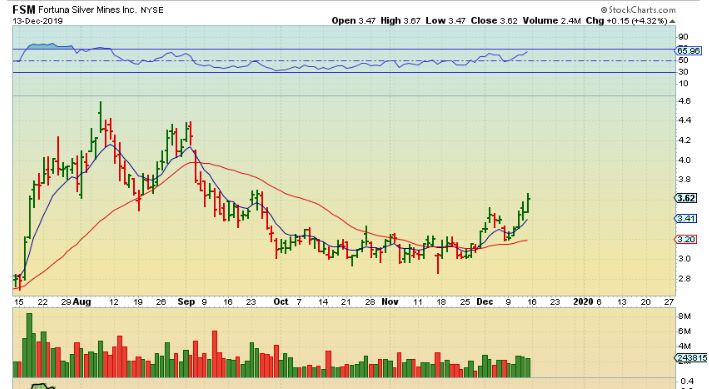
Just start small & add as your confidence grows.
.
Enjoy your weekend!
.
~ALEX
.
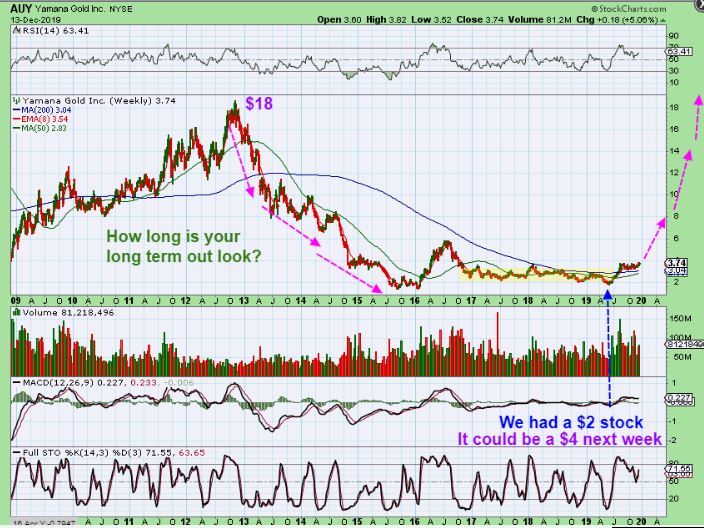
AUY – I was running through a few chart and just had to show you AUY again. I’ve been pointing out this consolidation, but did you notice that now AUY does not drop to the lower channel anymore? This looks like Buyers are going to push this to a break out.
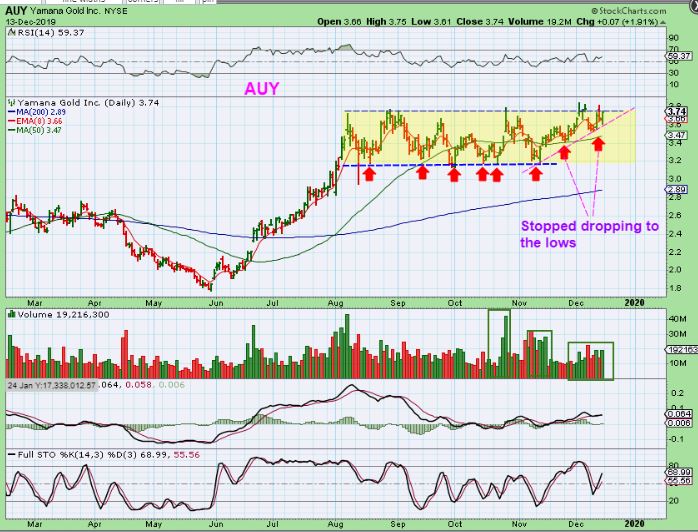
,
AUY – Now take a step back at AUY. In a basket of Miners, This can be bought as a long term BUY & HOLD (Chris) 🙂 It has proven itself with a long sideways consolidation and not a deep correction. This was a $2, now heading to $4, possibly heading to… $20 + over time.