Tuesday Dec 10th – Fed Week Trading
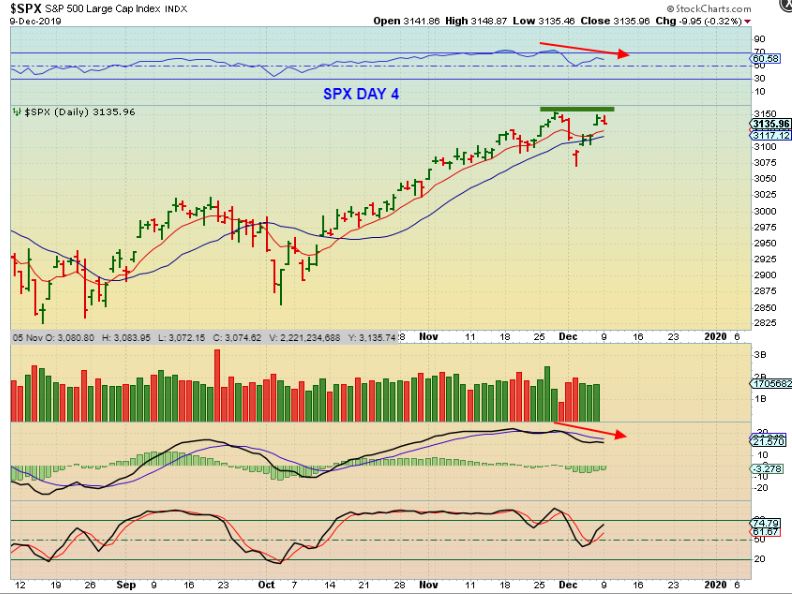
SPX – Day 4 saw the Markets stall at recent high & I do see slight divergence. They may do a gap fill Tuesday and we’ll see if Fed Wednesday can push it to new highs. I mentioned a possible L.T. Daily forming, so I would use a rising stop under maybe the 13 sma. I do expect new highs before it rolls over.
,
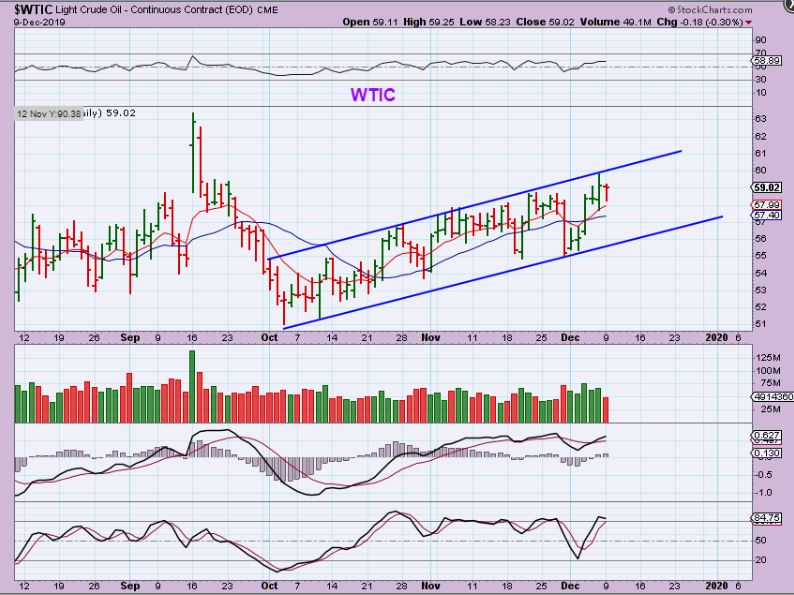
WTIC – Choppy Oil is still climbing within the channel, but is above the 50 & 200sma.
.
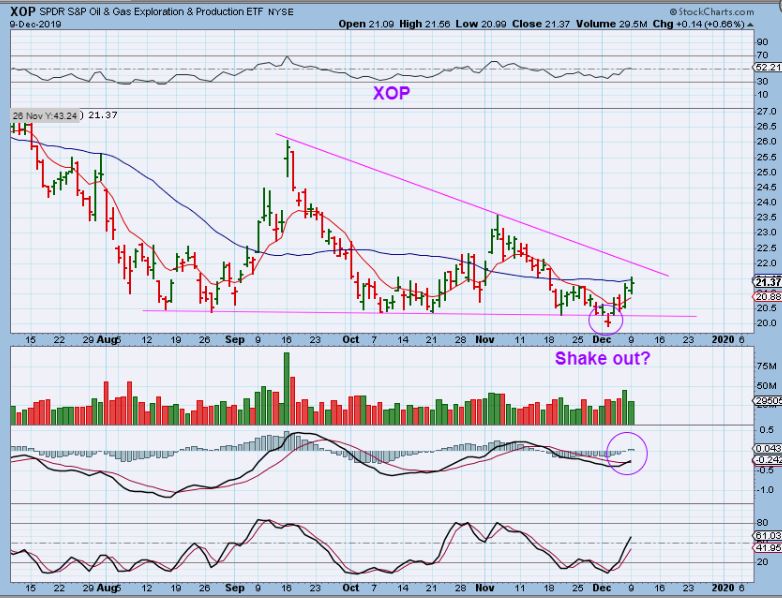
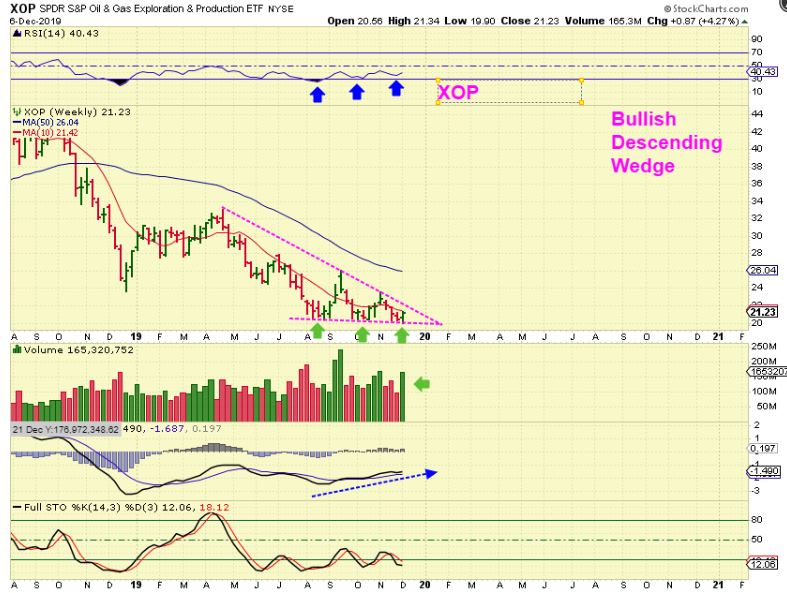
XOP – The XOP is pushing on the 50 sma after leaving behind what I pointed out to possibly be a shake out low. Remember the weekly chart from the weekend report? Let me show you what that looked like…
.
FROM THE WEEKEND REPORT: XOP WEEKLY – This has repeatedly dropped back to the lows, but now it has formed a bullish descending wedge. That was a high volume reversal last week, the weekly MACD is curling higher , and notice also that the RSI is trending higher as price made new lows. I’m viewing this as bullish and a low risk buy, especially if it dips a little next week.
.
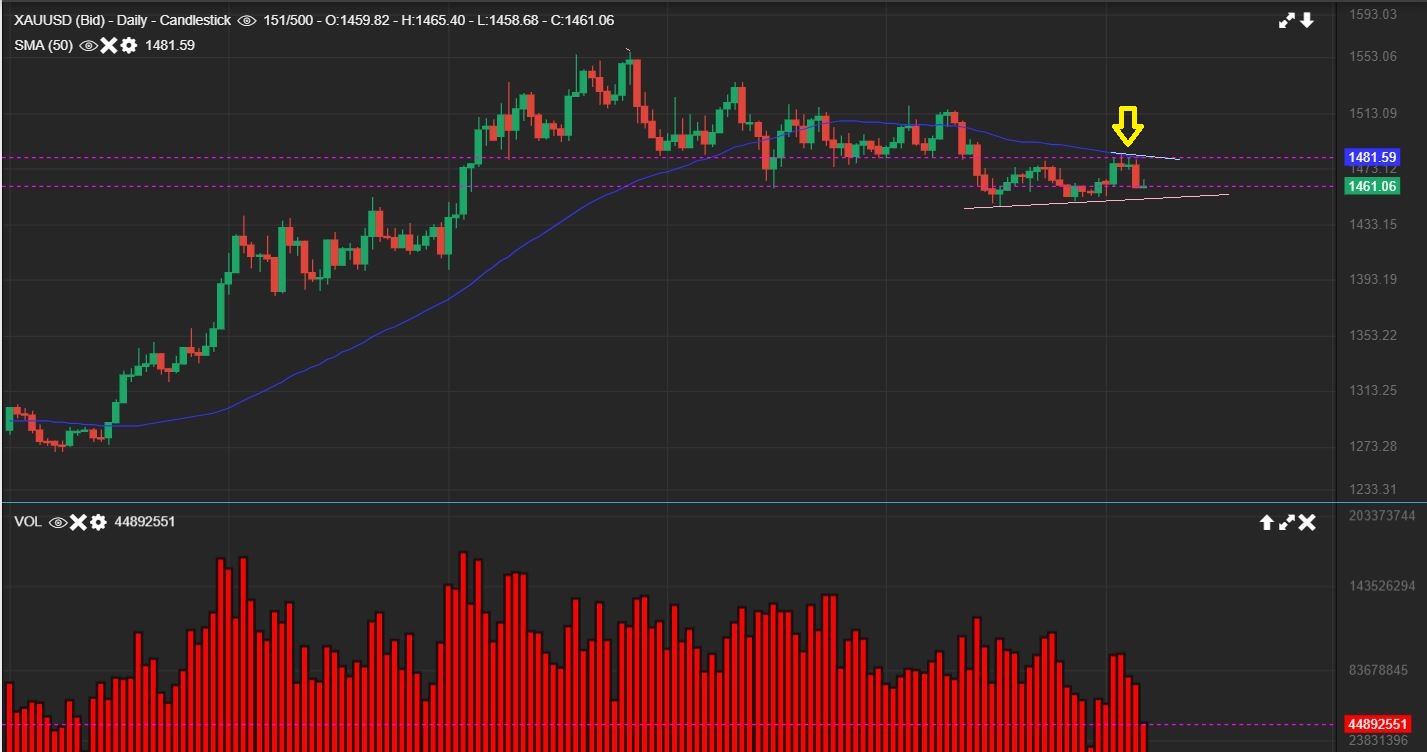
GOLD – Gold paused on Monday. It is an FOMC Mtg week, Gold is on day 18 and had a day 15 high where price was rejected at the 50sma. A day 15 peak could become a L.T. or a R.T. Daily cycle, depending on the length of this daily cycle.
– It is possible that Gold COULD pop higher after the F.O.M.C. Mtg and clinch a R.T. Daily cycle near day 20+, since the last lows were not taken out.
– Gold breaking the November lows would lead to a future ICL.
– Basically Gold has been sideways and a bit choppy after Novembers lows.
.
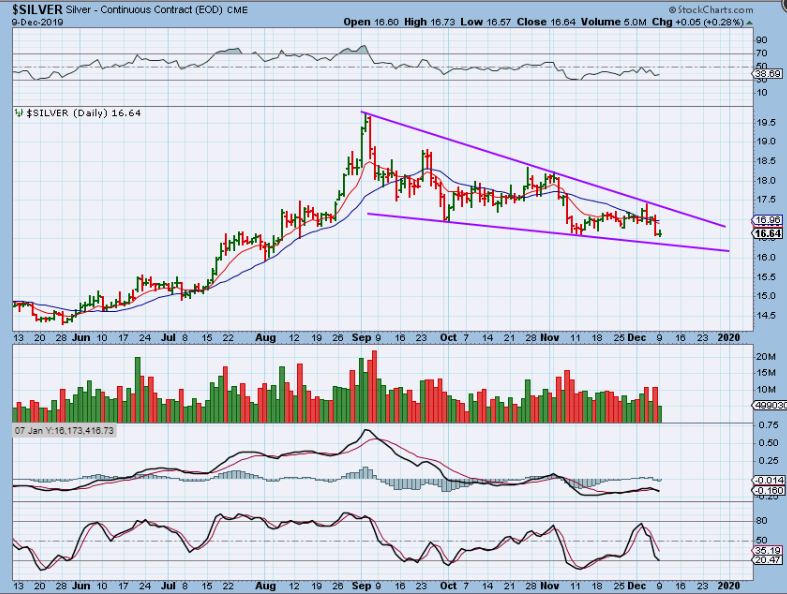
SILVER – Silver paused too, in an area that it could make new lows.
.
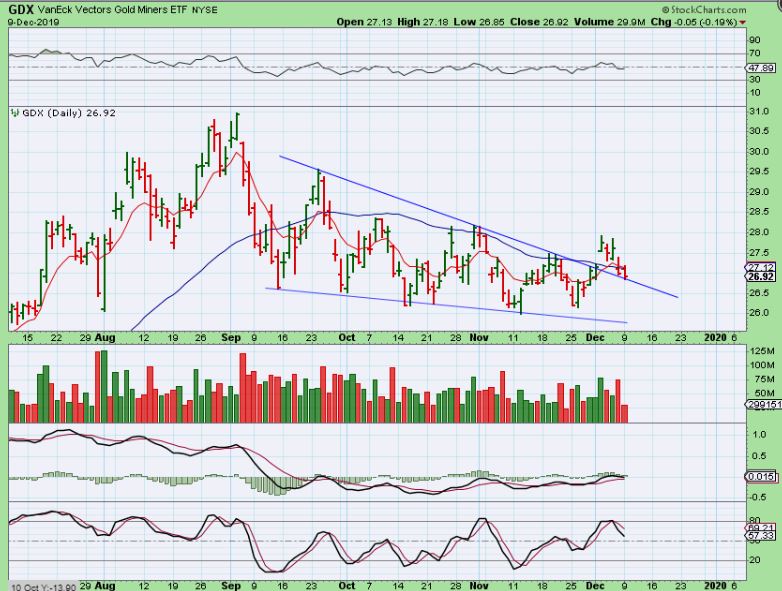
GDX – GDX closed slightly down, and that keeps it back under the 50 sma too. This still could be a back test of the trend line with a light volume drop, but we have a Fed Wednesday so anything can happen here. It remains slightly overbought, but the MACD remains bullishly lined up.
.
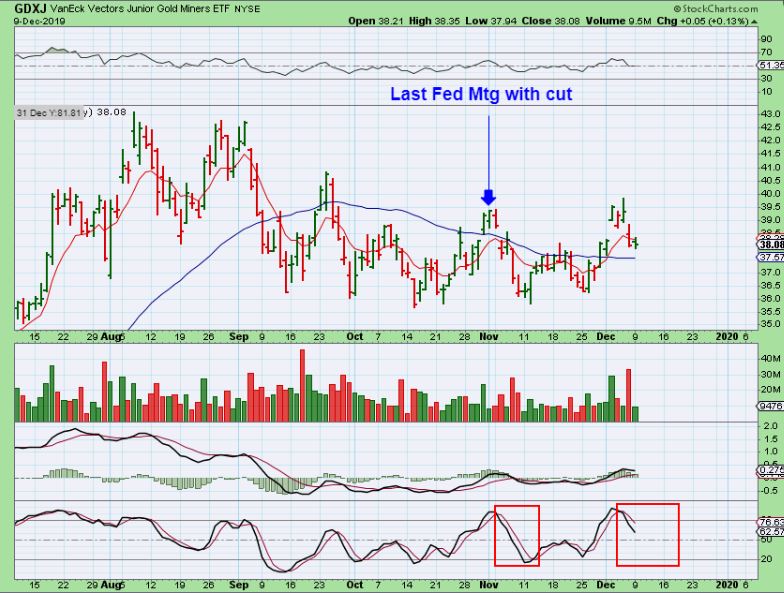
GDXJ – GDXJ closed slightly higher and is above that 50 sma, but that was a pretty heavy volume sell down on Friday.
.
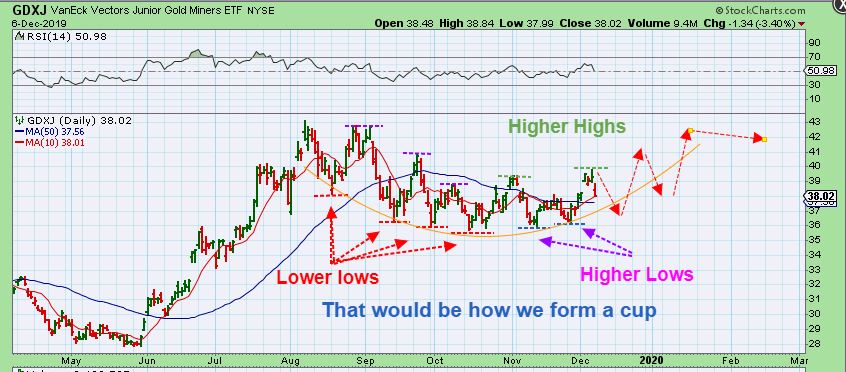
THOUGHT FROM THE WEEKEND REPORT: GDXJ – When you start to see higher lows and higher highs, that is when that Cup Formation starts to build. This becomes a VERY Bullish set up at that point. I am expecting that formation soon. GDXJ actually made a slightly higher high. I’d like to see a higher low if we drop next week.
.
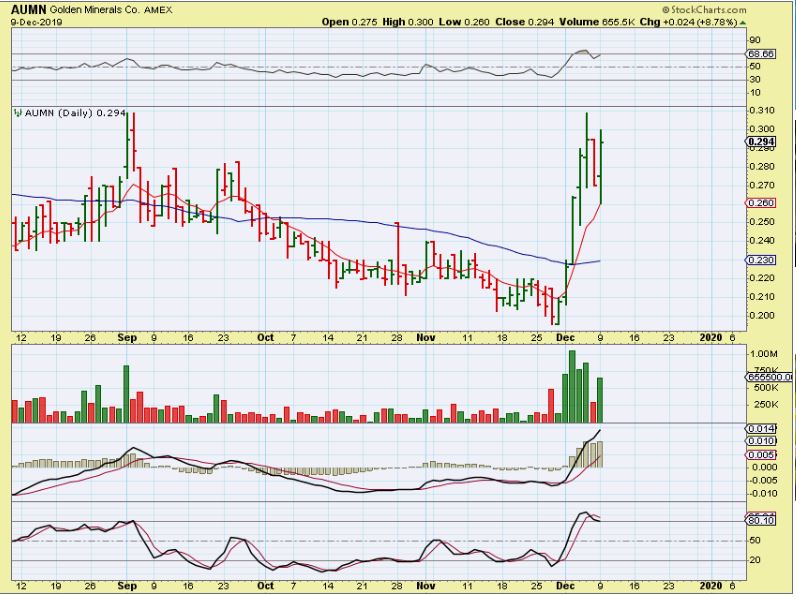
AUMN – Some Miners had a good day, and they were the recent lagging Miners like AUMN, LODE, now VGZ, etc, and we have seen individual Miners act bullishly, even when Gold & Silver dropped.
.
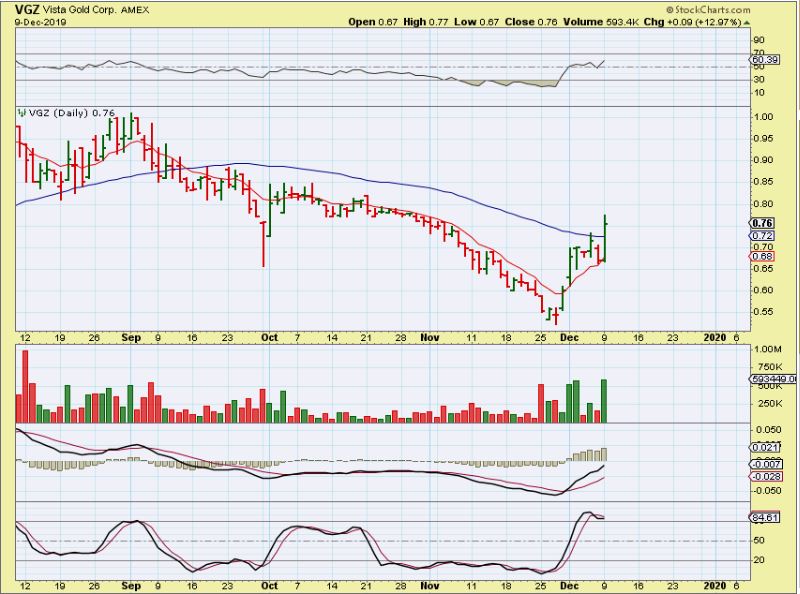
VGZ – This wasn’t just a laggard, it was a sell off that cut the stock in half from August to November! Suddenly it put in a High Volume V-Bottom, formed a small bull flag, and broke through the 50 sma with volume on Monday. This is starting a nice recovery, and I didn’t see any outstanding news from the November lows.
.
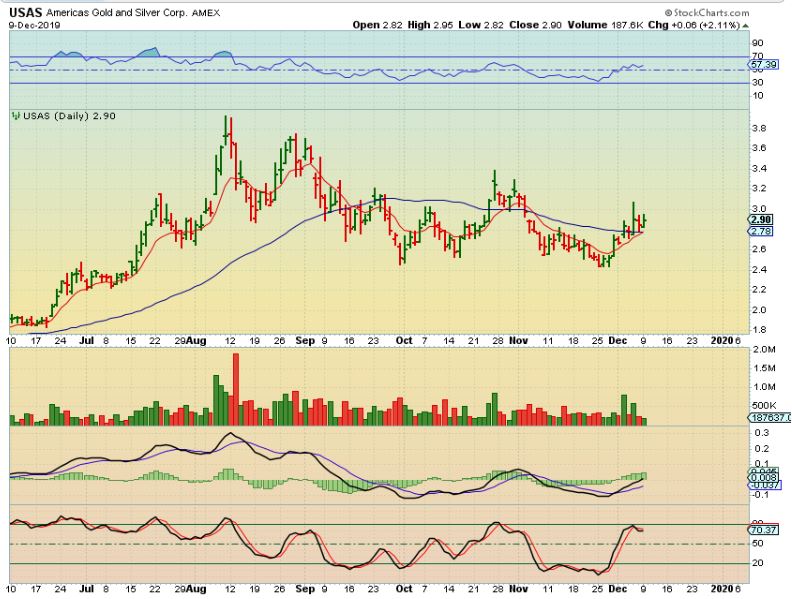
By request: USAS – Yes, I still own it from a recent purchase. It is holding above the 50 sma, but it has been here before and rolled back to the lows, so I’d like to see a push higher sooner than later.
.
It is a Fed Week, the real action may begin on Wednesday afternoon. Mondays trading hasn’t changed very much, but it did stir up the MJ Sector, so I will discuss that below. Enjoy your Tuesday trading!
.
~ALEX
.
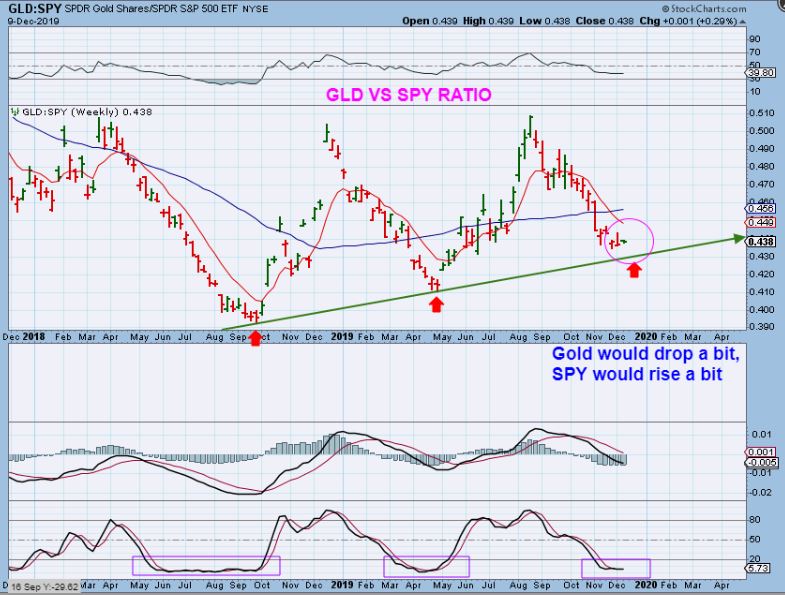
GLD / SPY RATIO WEEKLY – This is interesting. I decided to check the ratio of GOLD & THE SPX using GLD & SPY ETFs. It matches expectations that Gold could drop a little bit more, or the SPX could rise a little & top, both of which would push this down to the trend line. This seems to indicate that it could happen post Fed. I didn’t put this in the MAIN BODY OF THE REPORT, because I can’t be sure that it will be trustworthy, since I do not look at it often. It did catch my attention though.
.
I always like to start the MJ Sector with a WARNING FIRST: This sector is fast moving & it has attempted to bottom or bounced several times over the recent multi-month sell off. I had entered & been stopped out at one point. I then re-entered at the last set of lows & reversal and made pretty good gains quickly. I closed those positions out with gains to focus on Miners. Now it looks to be set up Bullishly, and I will explain what I like about what I see. My point? The sector looks Bullish , it moves fast, and can be a bit risky if it goes against you. Use stops if you trade it.
.
I’ll start this MJ Sector by pointing out that it may also be safer to enter later on pull backs when we get a HIGHER LOW & THEN A HIGHER HIGH, because it would look like the start of an uptrend. Right now what I am looking at is a higher low that is holding up bullishly & offering an entry as support. I personally like to try to catch these near the lows ( We did enter lows in November). I locked in good gains on a few recently, but now we are starting to get what I was hoping for back then- a higher low. I will review this sector now, it is still considered a bit risky. I re-entered a few positions and will use stops.
.
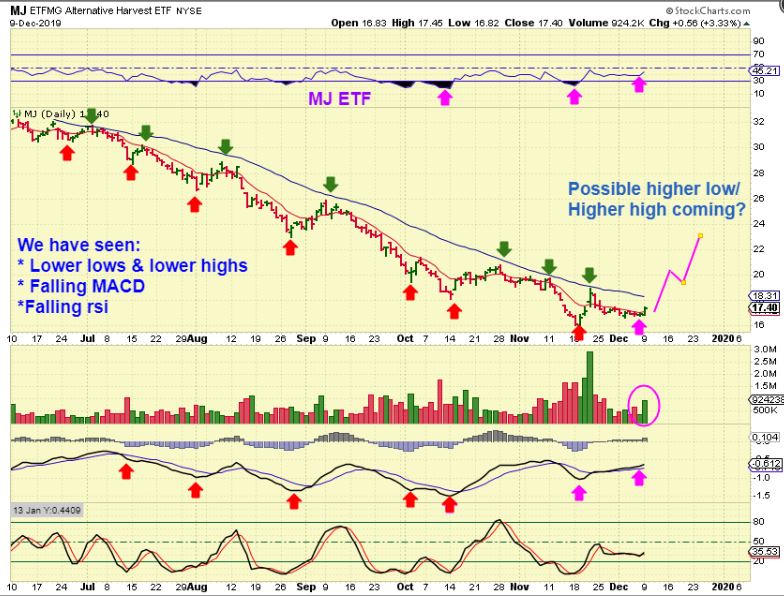
MJ ETF – With the MJ ETF, it Popped with BIG volume on that reversal. It then spent some time consolidating those gains, and now has another push with volume again. I like that, but will it get over the 50sma to make a higher high? We’ll see, but when I see this set up, I usually buy it. Let’s now look at individual stocks.
.
REVIEW: FROM NOVEMBER
.
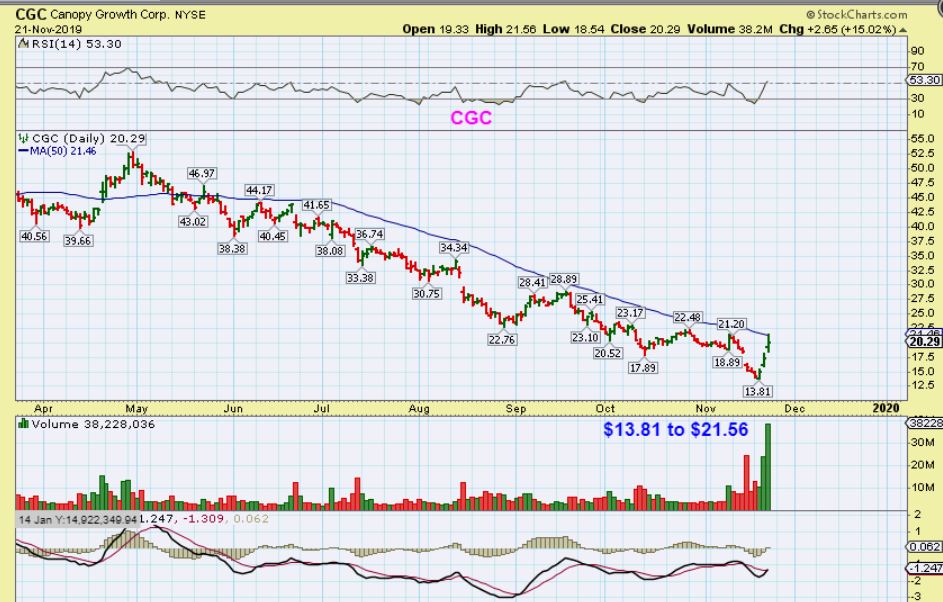
CGC – This was from Nov 21- the initial run to the 50sma from $13.81 to $21.56 in just 3 days( a Big $$ Gainer). Now we wait for the pull back.
.
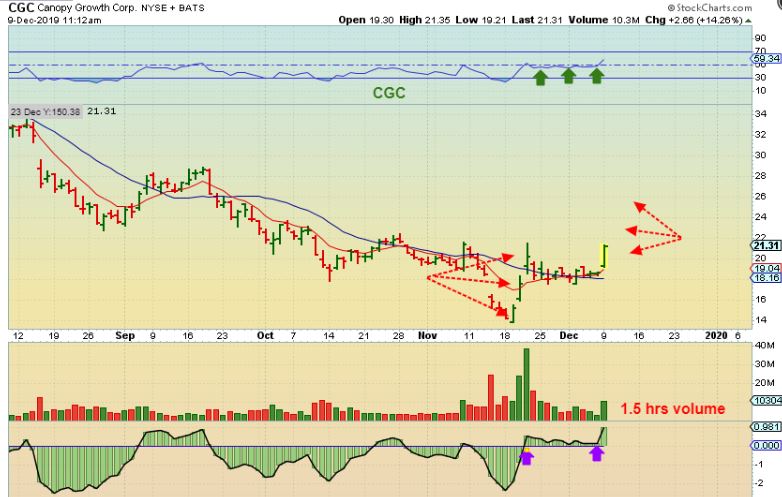
CGC – It ran sideways and this was CGC up 14% at 11:12 am Monday. That is a high volume break higher and imagine if this was day 1 of another 3 day run. It could be.
.
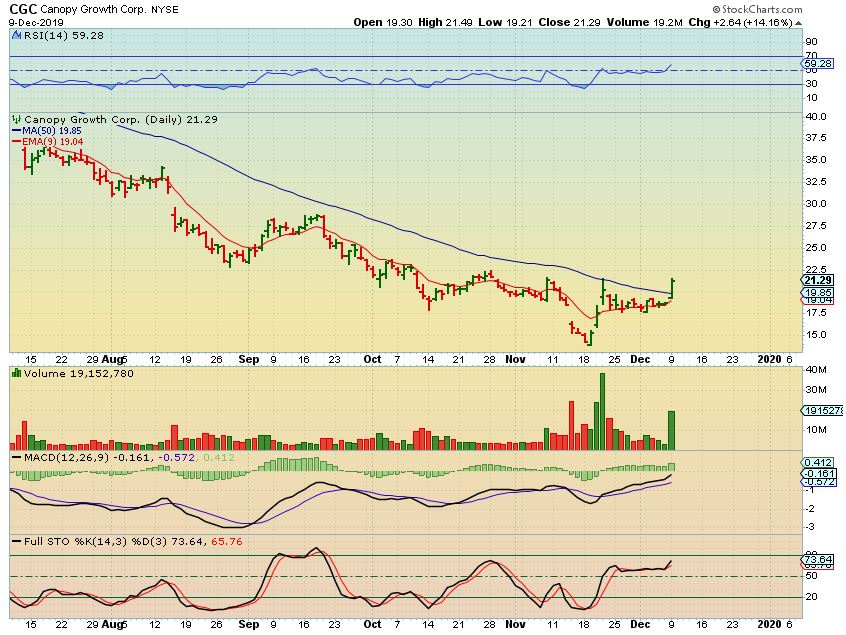
By the end of the day, volume was almost 20 million and CGC busted right through that 50 sma . THAT IS BULLISH TOO. It has a higher low on Dec 2 and is making a higher high now too …
.
.
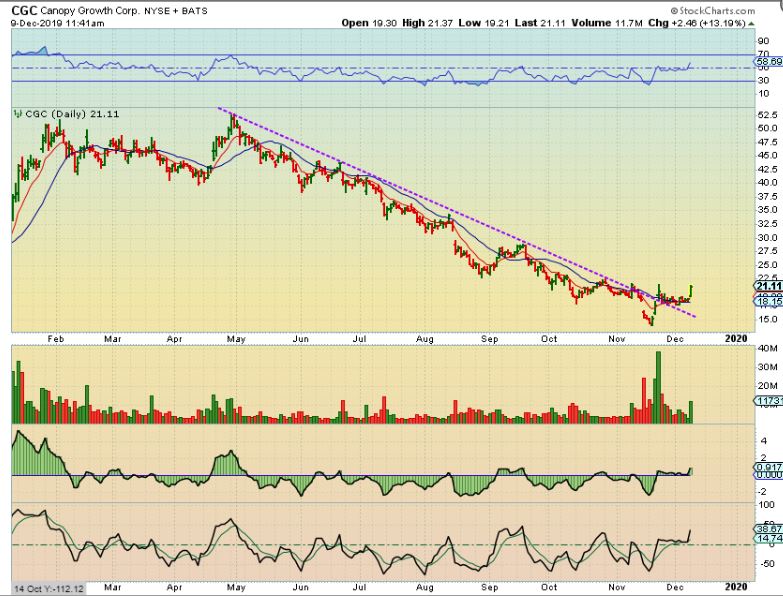
And CGC has also broken the downtrend. So it is very possible that CGC has bottomed and will begin trending higher. It could begin a stair-step higher similar to the multi-month stair-step lower May through November.
.
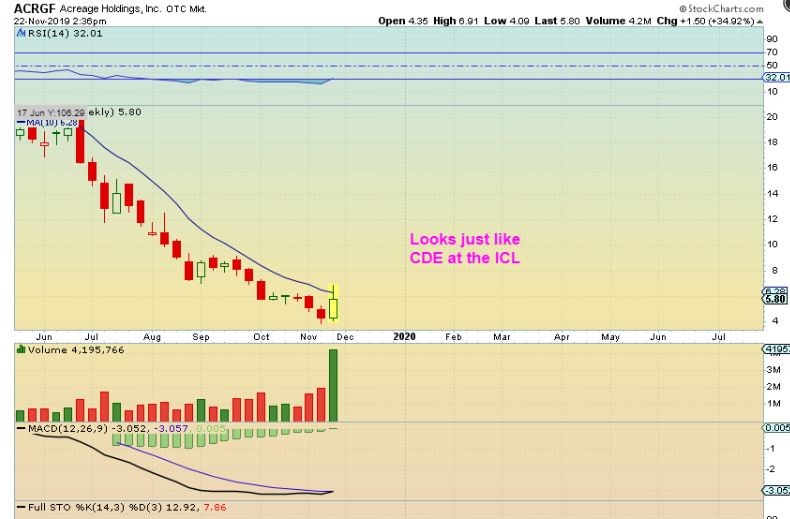
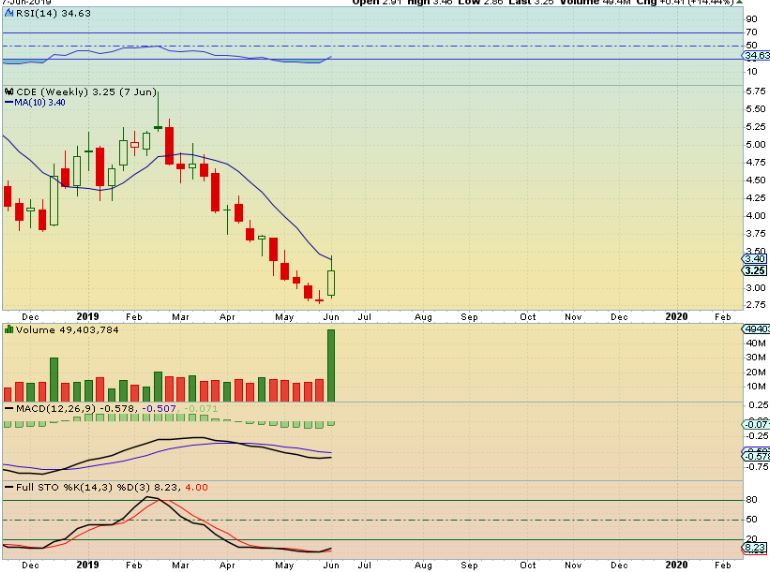
DO YOU REMEMBER WHEN I POSTED THIS ACRGF WEEKLY CANDLE AS A LOW IN NOVEMBER? AND THEN I COMPARED THIS WITH CDE AS SHOWN ON THE NEXT CHART …
.
.
ACRGF LOOKED JUST LIKE CDE HERE WITHA HIGH VOLUME REVERSAL AT THE LOWS, AND…
.
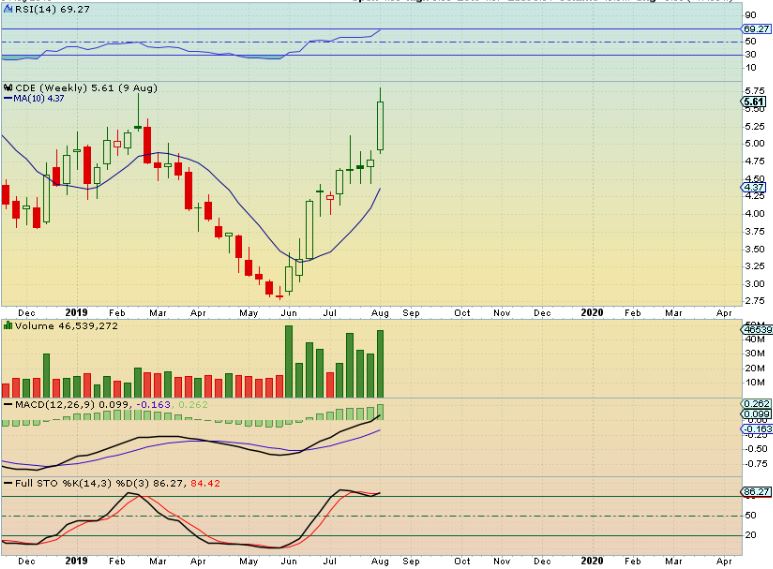
I POINTED OUT THAT CDE TOOK OFF AND MADE HUGE RECOVERY GAINS OVER THE NEXT SEVERAL WEEKS.
,
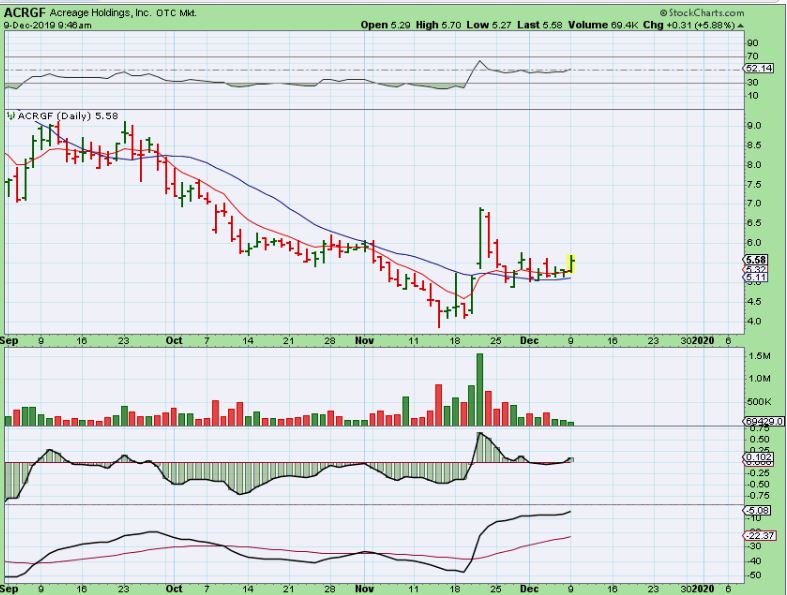
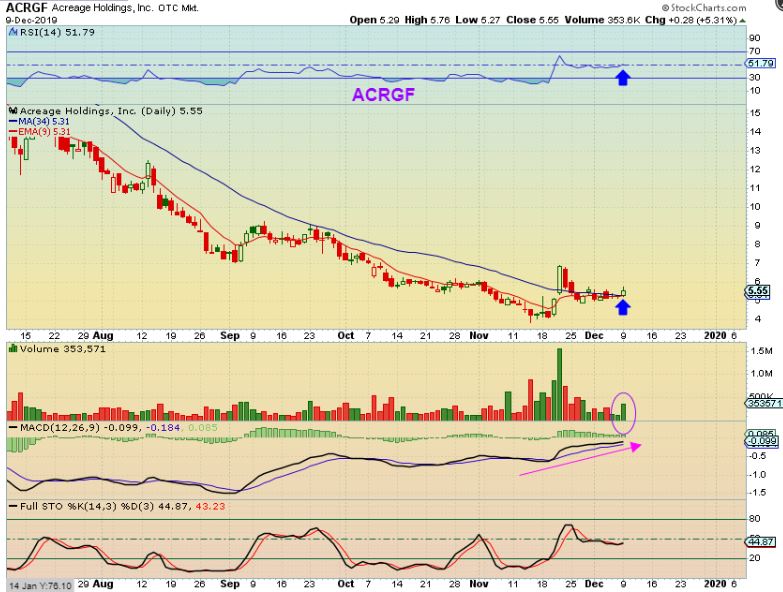
I captured ACRGF Popping near the open on Monday, I bought it and posted this in the live trading area. It has held support and that would be higher lows going forward, so a stop can be placed there above the 10, 13, 20 , or 34 sma. Price is above all of those.
.
ACRGF – I like to use the 34 sma on many MJ stocks and ACRGF pushed above that 34 sma with good volume coming in, and has a higher low. It looks like it wants to go higher.
.
REMEMBER HEXO WEEKLY NOVEMBER 22? – I also posted that weekly reversal for HEXO, similar to when CDE bottomed. It had very high volume indicating a possible capitulation low.
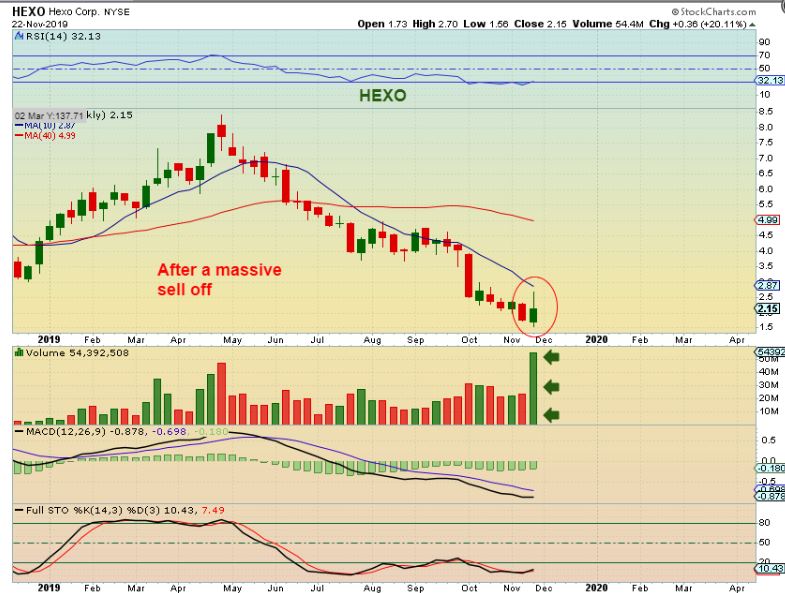
.
ALSO HEXO NOV 22 -I then mentioned that it could just take off higher, or we might see it crawl sideways before a move higher. I showed a choppy crawl sideways, but…
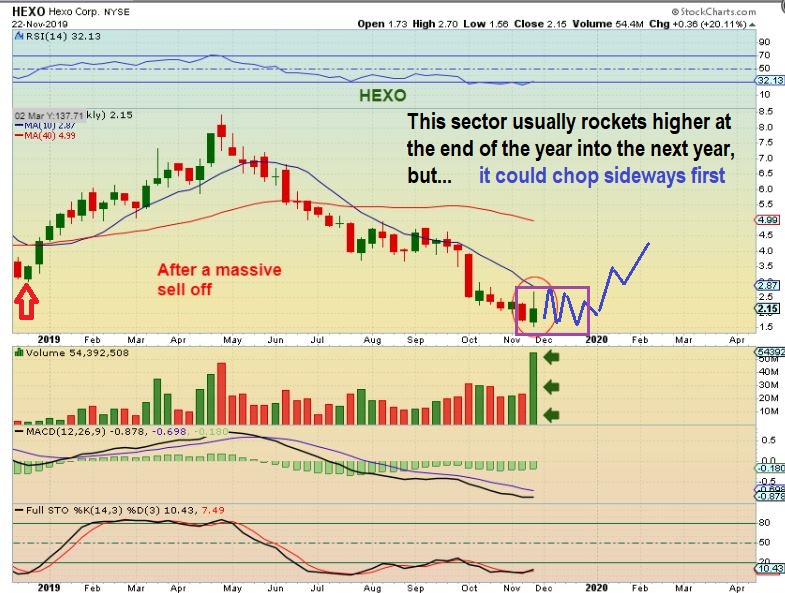
.
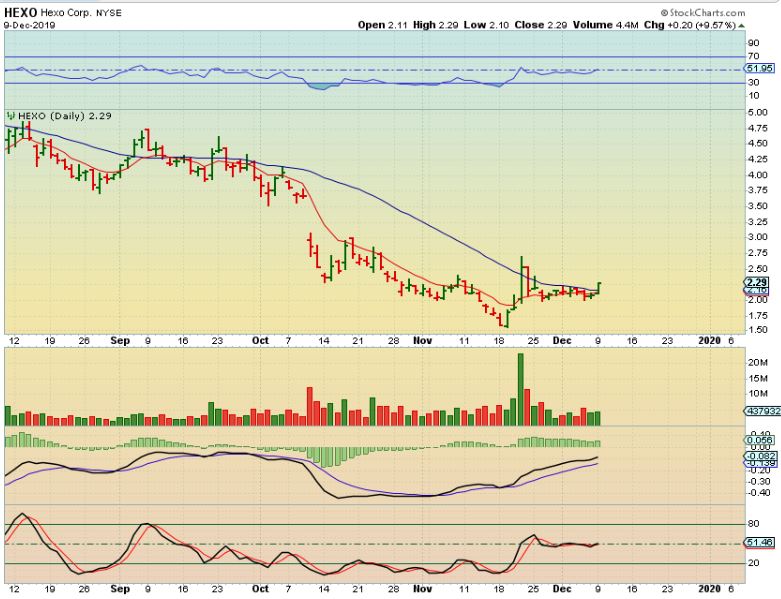
HEXO – HEXO crawled sideways in a very orderly tight manner. Monday it also started to break higher and pushed above the 34 sma. This is also a buy with a stop under recent lows, as long as it doesn’t gap down below those lows. This small move was up 9.5%, and it could move a lot higher.
.
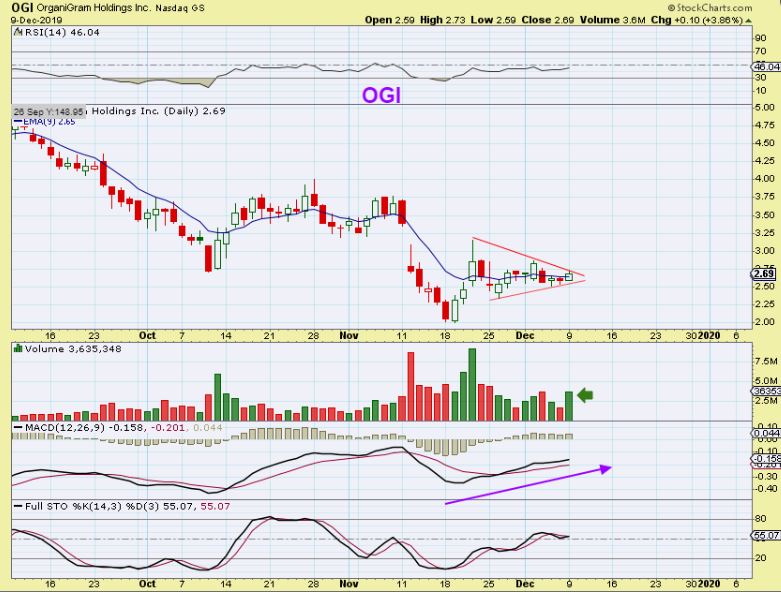
OGI – OGI has put in a triangle type consolidation and also looks ready to break higher. I posted this after the 1st 1/2 hr of trading & showed that volume was good in the first 1/2 hr.
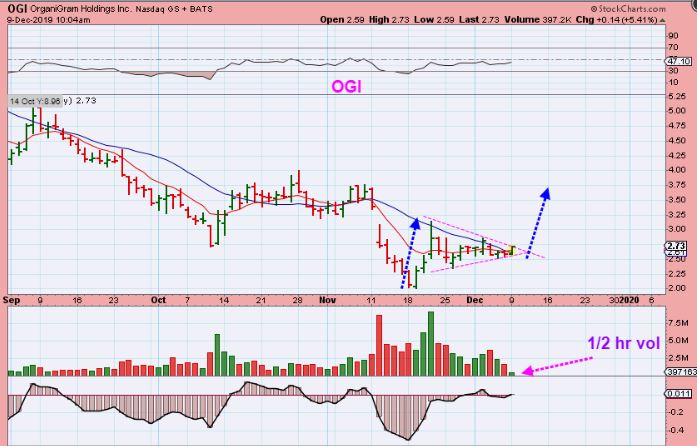
.
OGI – OGI is just starting to move, but you can see the volume increased by the close.
.
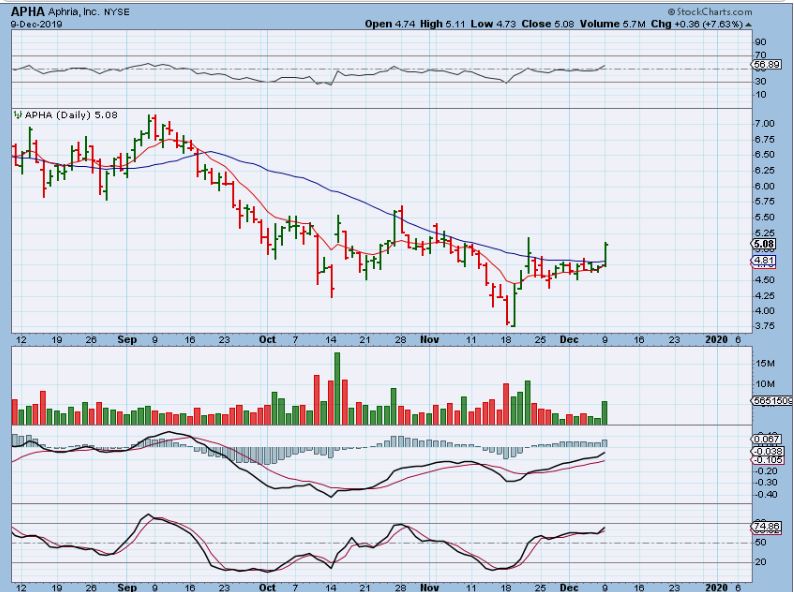
APHA popped 7% and closed well above the 34 & 50 sma. Volume increased after a long consolidation, this is another bullish set up. So the sector seems to be coming alive after consolidating those gains off of the lows.
.
So these MJ Stocks POPPED in November with strong volume and it was considered a possible capitulation low (bottom) on the daily & weekly charts. Then they consolidated sideways for weeks, and now show signs of increased volume as they push higher. We may now have a higher low in place, and if we get a higher high soon, these could start to recover & trend higher. ‘Wait & see’, or ‘buy & wait and see’, the choice is yours. This is an area that you could start a position. Risky faster moving stocks are risky, but remember, you can control risk by controlling your position size too 🙂
.
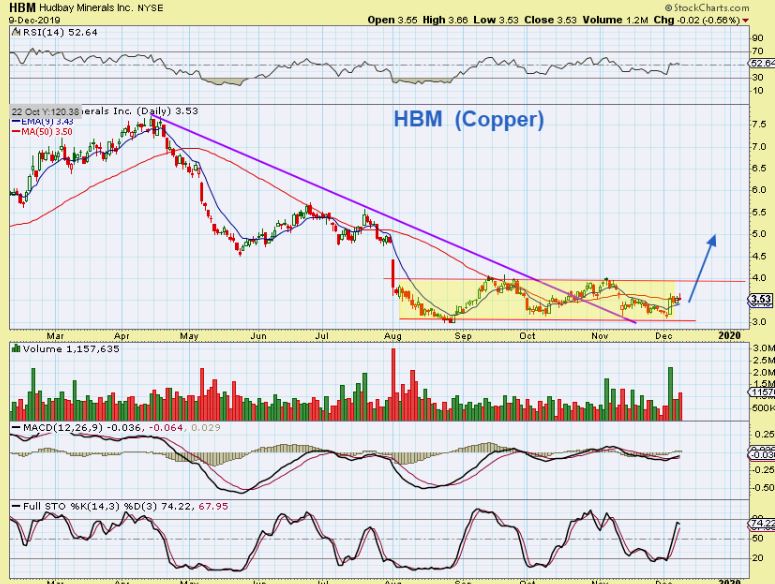
Several Metals stocks have been mentioned as bullish too. GGB, SID, X, AKS, FCX, CENX, TMST, ZEUS, HBM, CLF, etc are all bases and many are looking more & more bullish over time.
.
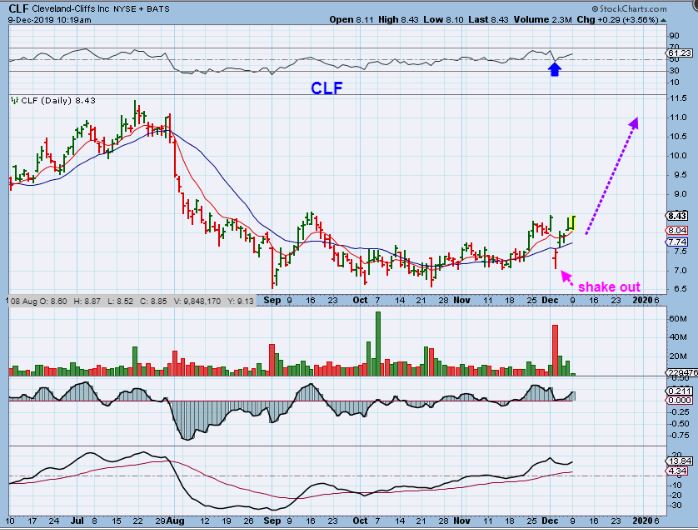
CLF – CLF bought AKS and AKS took off higher while CLF gapped down. CLF actually put in a reversal candle that day and it then gapped open leaving an abandoned baby. It was a buy back above the 10sma, but this is also a buy as it breaks from a 3-4 month base, and looks like it will run back to July Highs.
.
HBM – There are a few bases that are looking very good in the Metals sector. HBM looks to be possibly just getting ready for a run higher as it crawls along that 50sma. It would be playing catch up to others like FCX, which bottomed in October and has started running higher already.