
November 30th Weekend Report – What Shall We Talk about?
.
We’ll discuss the various market sectors, but we’ll focus a bit more on Gold, Silver, and the Miners 🙂
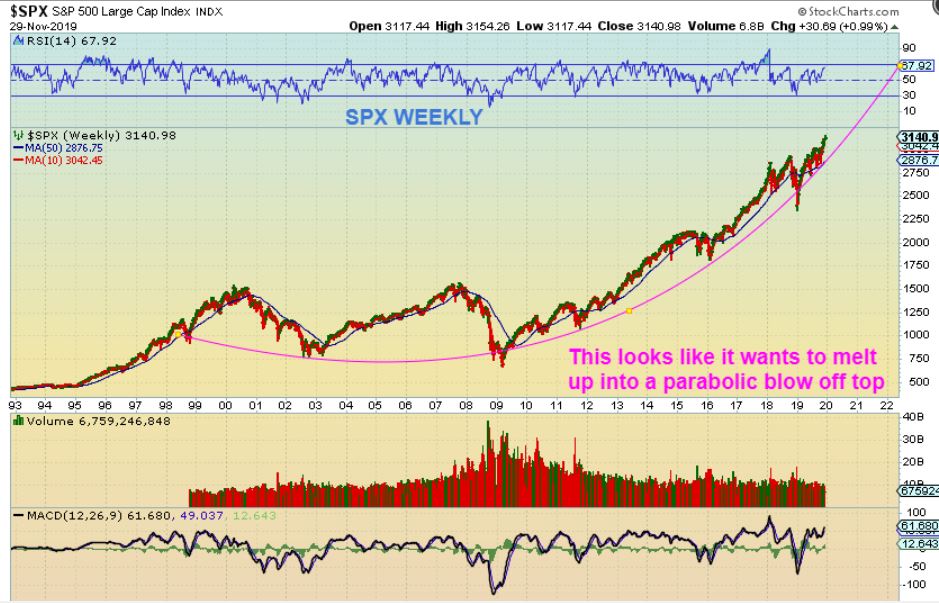
SPX WEEKLY BIG PICTURE – On a daily basis, I have been discussing that a pull back has been expected, a daily cycle low was coming due. In the BIG picture, the break out to new highs was from a 1 year consolidation. So the markets have broken to new highs and continue to find bullish buying of the dips. After we get a dcl, it is possible that the markets are in a melt up phase as shown here climbing a possible parabolic curve. We’ll continue to monitor this bullish looking push higher as time goes on.
.
WTIC DAILY – Oil has been choppy and I have avoided it lately due to that volatility. On Friday it crashed down over 5%! That volume is only for 1/2 day holiday trading, so this looks ready to break down to a dcl and possibly an ICL. It is overbought and it is day 41, so please see the chart. A choppy downward path should come next.

.
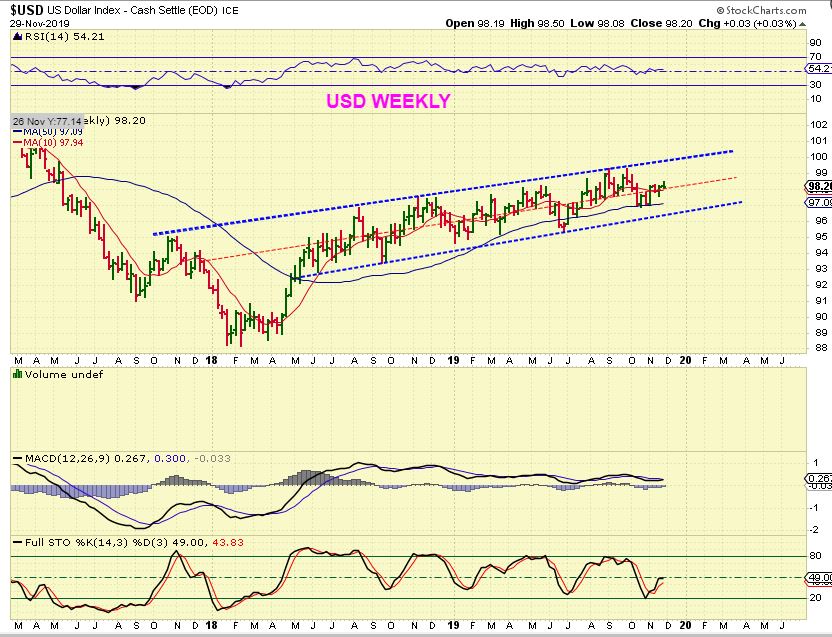
USD WEEKLY – The USD remains in the middle of this channel. We got a reversal lower Friday, so lets take a look at that on the daily chart.
.
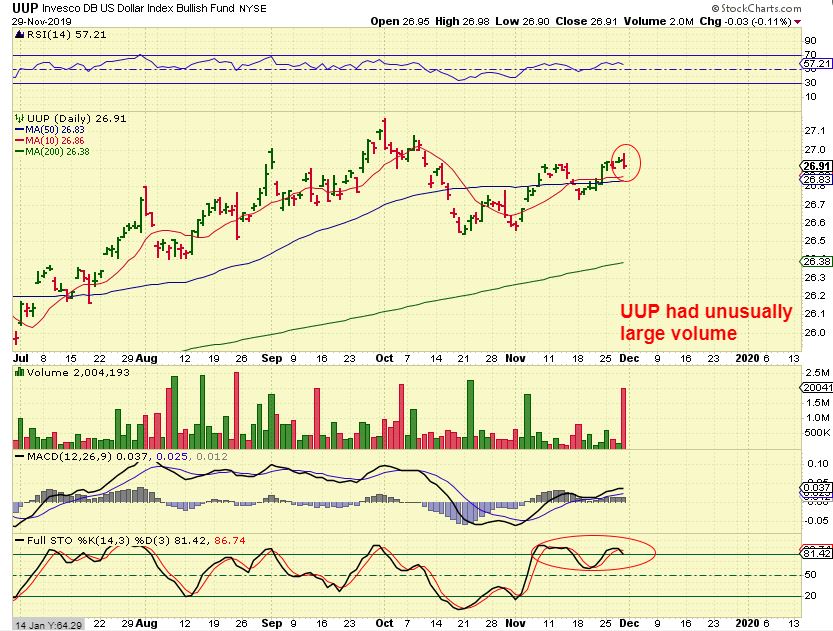
UUP – This is the reversal and that volume is from a 1/2 day holiday trading too? The USD set up (MACD, RSI, ETC) looks bullish, but it is overbought and if it starts to drop, Gold may decide to break higher. As the USD reversed lower Friday, Gold did push higher and closed slightly above the 10sma.
.
.
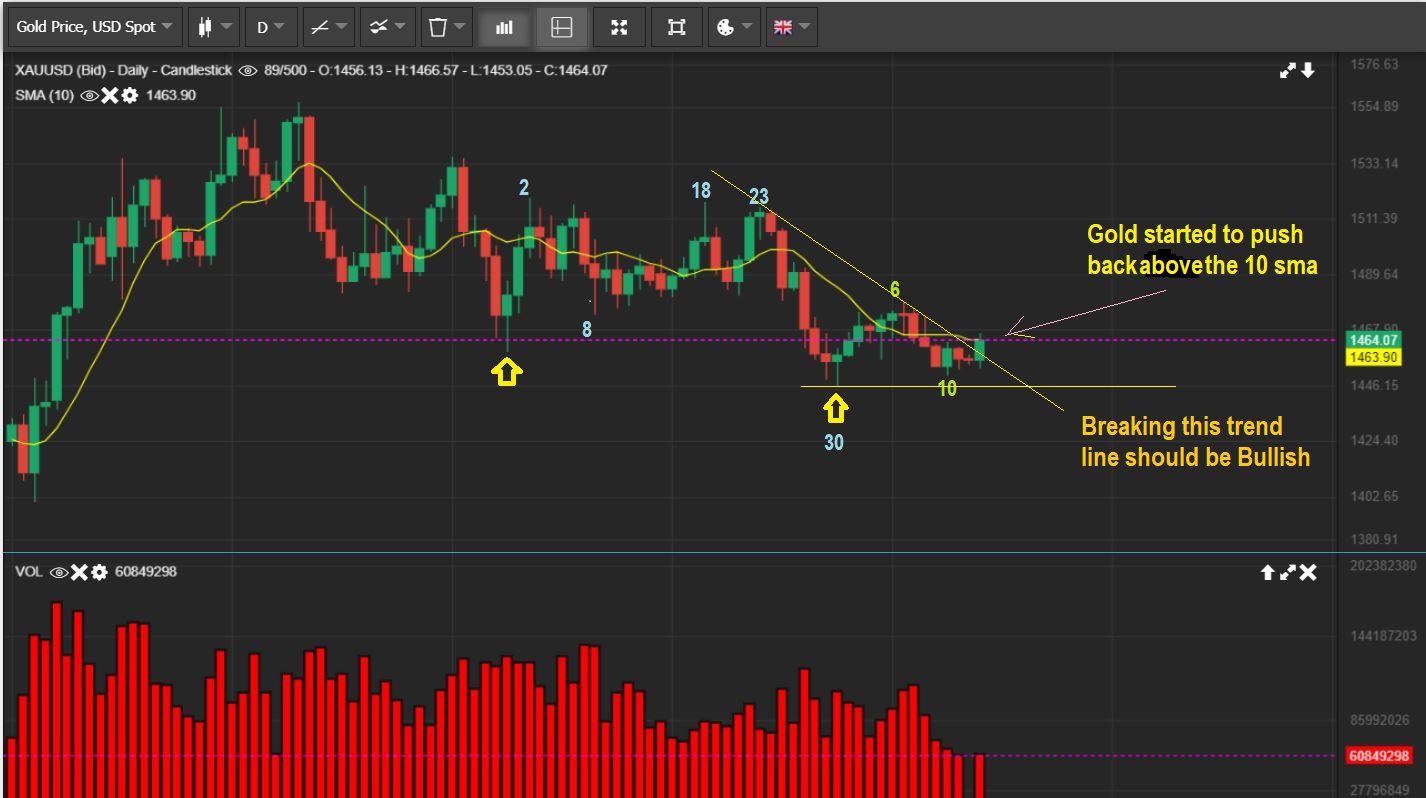
GOLD DAILY – So Gold pushed higher on Friday, it closed slightly above the 10sma, and seems to have broken a shorter term downtrend line on day 13. A break above that day 6 high is Bullish and could signal that a right translated daily cycle is forming. IF THAT HAPPENS this late in time, we would have to lean toward the idea that an ICL could be in place.
.
GOLD WEEKLY – When I look at the weekly, it resembles a bear flag, However the last ICL was in early May, so we are now 7 month out from that ICL. We are due for an ICL and may even already have one in place. I have mentioned this in the daily reports, and we will have confirmation of where we are when we either break higher or break the recent lows.

.
SILVER WEEKLY – When I look at Silver it could be an odd shaped Bull flag. Take a look at that BIG drop 4 weeks ago. I hate to say it, but we could get another drop like that again and that would back test that black like. This also could just break higher from the flag. Since I can picture this going either way too, I’ll draw it on the next charts.

.
SILVER WEEKLY – Here I’ve drawn a small drop & pop in Purple, or an immediate follow through higher next week. Keep in mind that a ‘slam down drop’ to the black line is also possible, since it would simply be a repeat of that Big Drop a few weeks ago.

.
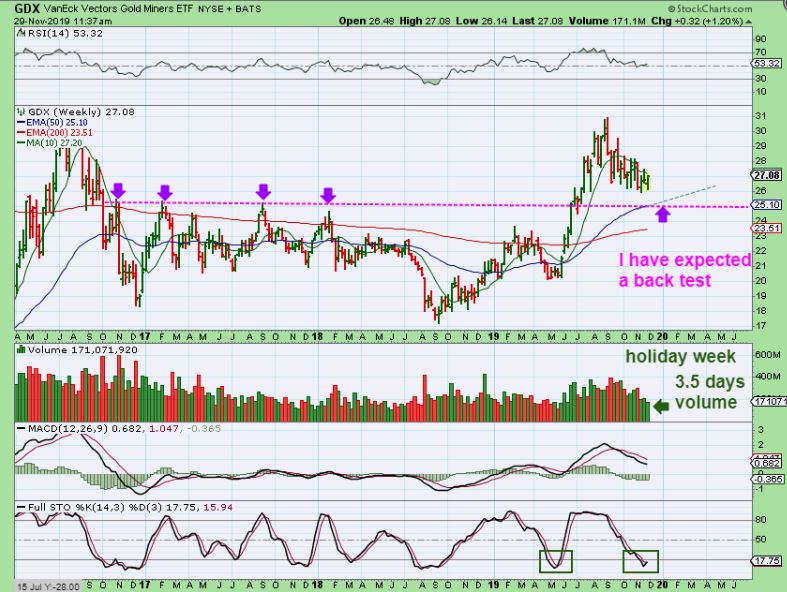
GDX WEEKLY – To be honest, I would have expected & even mentioned months ago that the break out could be back tested & now it lines up with the 50 week MA. That said, we also got a move higher Friday that now has the GDX & GDXJ Charts showing reversals. Maybe that back test will not happen, because…
.
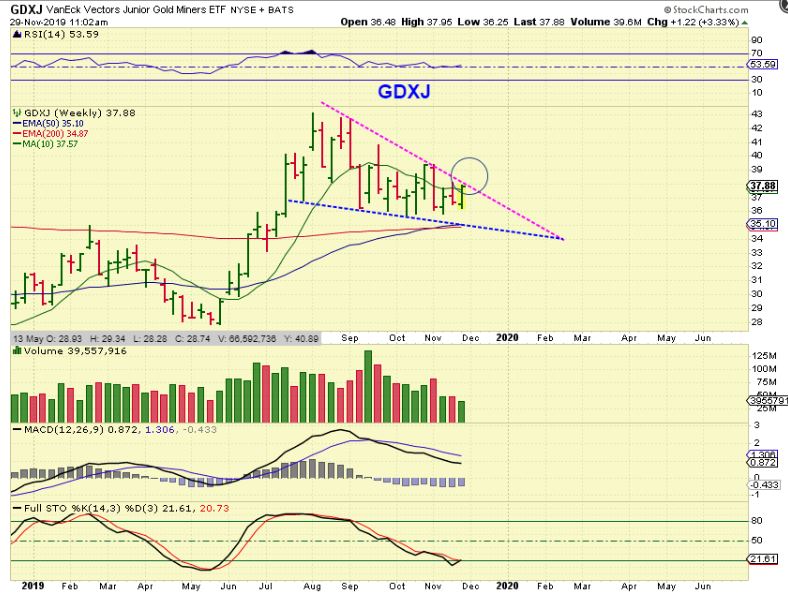
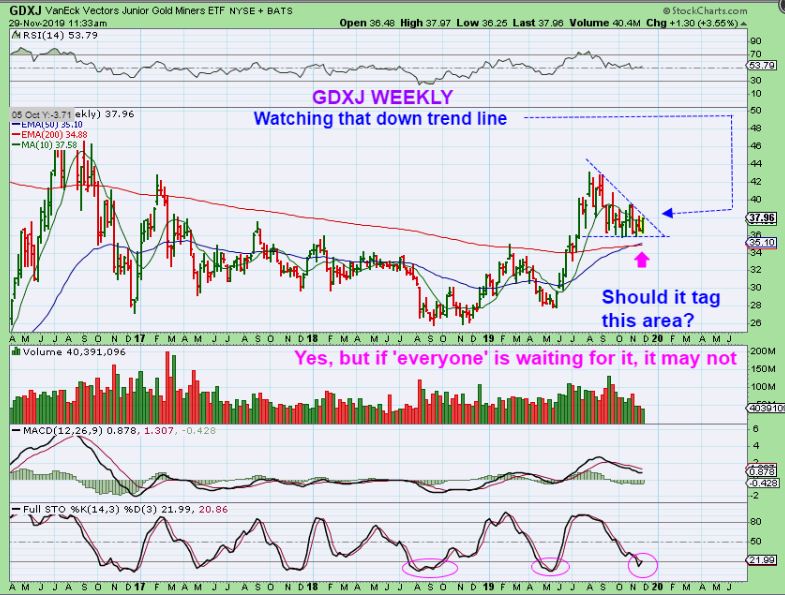
GDXJ – GDXJ was pushing on a weekly down trend line. I captured this at 11 a.m. Friday and GDXJ closed even higher at $38.15. I’ll show you why that can be bullish on the next chart.
.
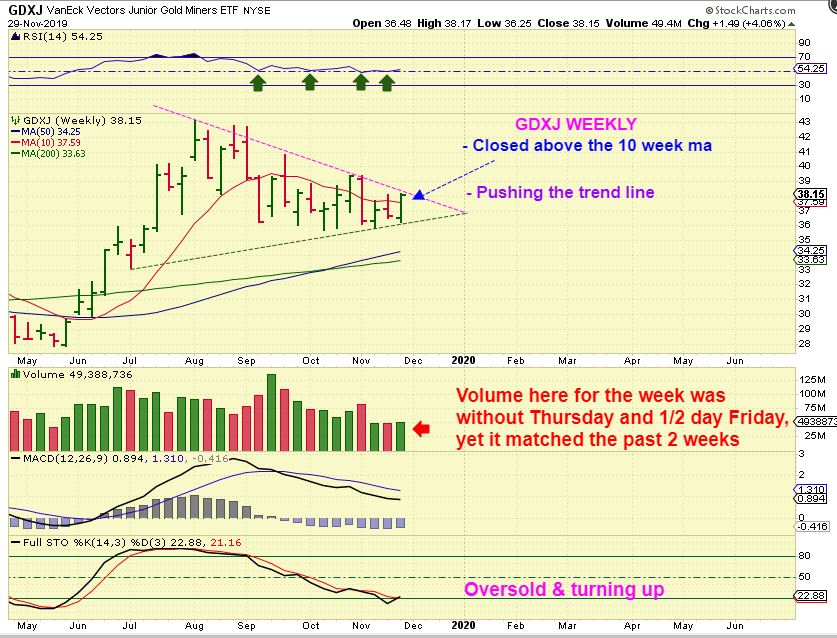
.
GDXJ WEEKLY – Everything that I have put on this chart is actually Bullish. So next week we can see if this pushes higher. A break of the trend line is very close, so I would say that Next week is important.
.
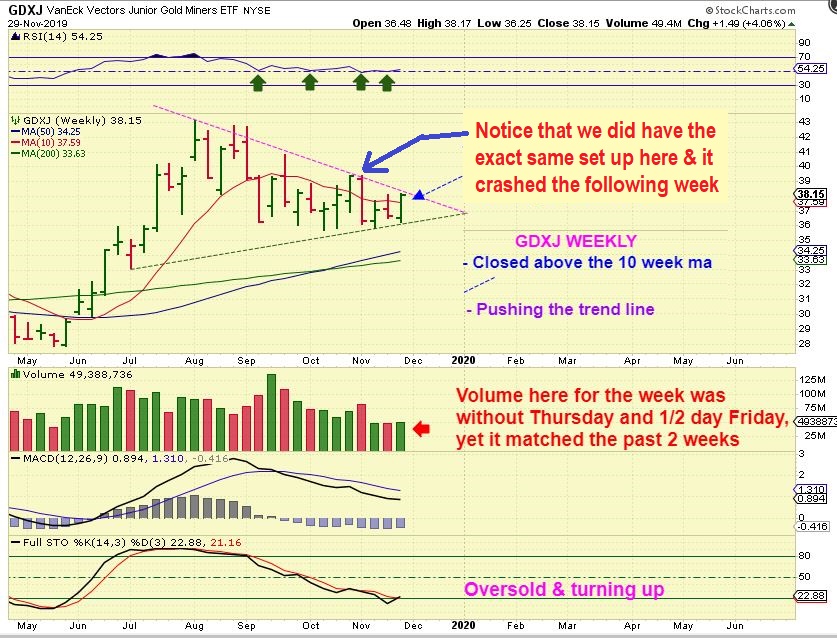
GDXJ WEEKLY – Now for the bad news. We did have the EXACT SAME SET UP 4 weeks ago when Silver suddenly crashed, with the exception of the oversold stochastics. So back then, GDXJ failed to break out. Next Weeks price action is Important.
GDXJ WEEKLY – And the Big Picture. A break out is Bullish.
.
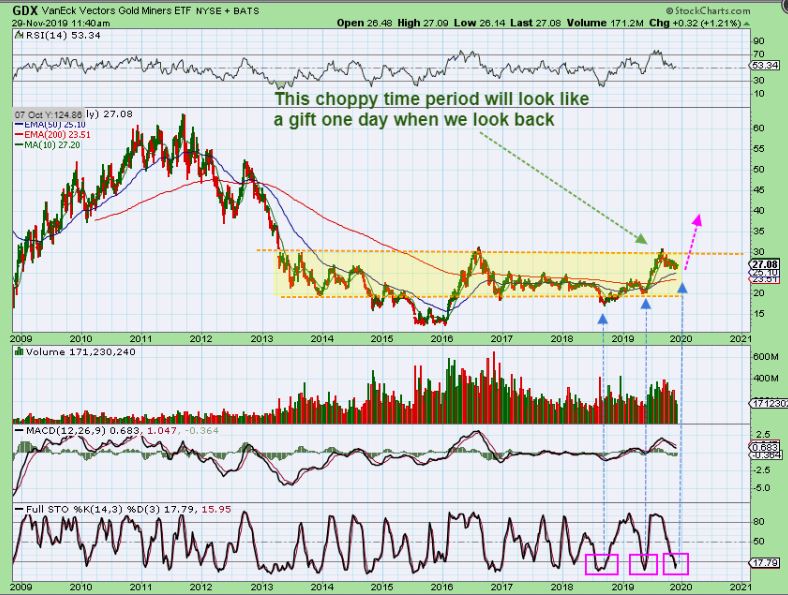
GDX WEEKLY BIGGER PICTURE: Yes, the choppy day after day week after week action is frustrating and tries ones patience as we await an ICL, but the Big Picture is Bullish. One day we’ll look back and be thankful for this opportunity to buy low & ride it higher. Don’t lose hope, this is very promising.
.
The chart of the SPX shows a bullish break out to new highs from a consolidation. It can put in a dcl soon and possibly back test that break out or it can also continue to melt up, we’ll have to wait and see. I would expect a dip to that DCL soon and then we’ll monitor it daily again. another attempt to continue higher.
.
Oil has been choppy so I have avoided it. After the Friday drop, it now looks ready to sell off.
.
Gold, Silver, & Miners : I would have expected a bit of a deeper drop to back test the break out in Miners and major moving averages in Gold & The Miners, but the set up in place as of Friday became a Weekly Bullish Reversal. We will see if next week continues with a break out above the down trend line ( triangle) in Miners. Many individual Miners have been acting bullishly again, after weeks of consolidation. I have put many in the reports and will continue to do so, ESPECIALLY if we break higher next week.
.
Enjoy your weekend and thanks for being a Chartfreak with me!
.
~ALEX
.
New England is due for a 3 day winter storm Sunday through Tuesday. We are due for about a foot of snow with high winds that may knock out Power. I’m planning on being in the live trading area Monday and writing a report Monday night for Tuesday, but if we lose power ( Generators provide electricity, but not Cable, Internet or WIFI) , it may be impossible for me to get a report out for Tuesday morning. Obviously there will be a report if I don’t have to travel too far to put one together.
What you are looking for is a break higher Monday in Miners through that trend line or not. It would help if it closes above that trend line too. I have also posted individual Miners in past reports to show Bullish set ups ( AUY, IAG, GORO, SBGL, SVM, HL, PAAS, AXU, CDE, and there are others that are pushing higher or maybe have pulled back to support , etc.). If I lose power, that should help until I am back online. 🙂

