Wednesday November 20th – Always Ready
SPX – The SPX made a new high again. Still trading above the 10sma, ratchet up the stops.

m
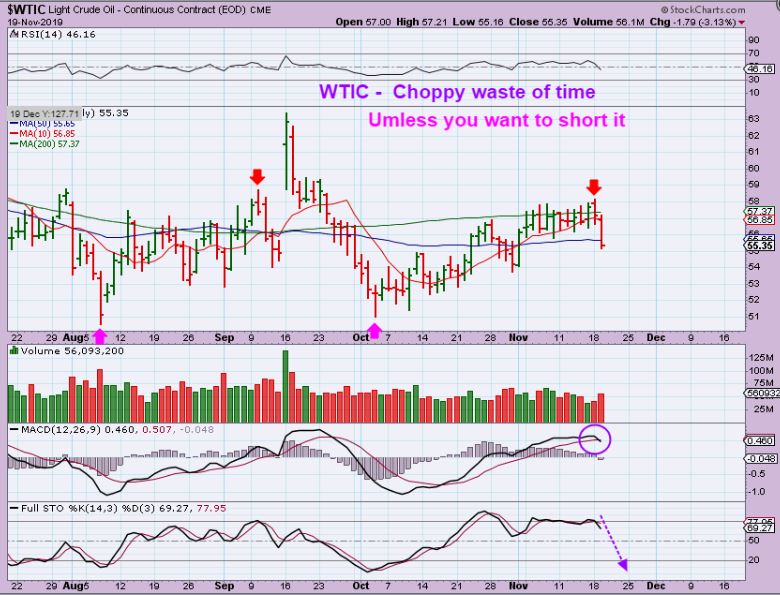
WTIC – Oil was choppy & sloppy, and gave up the 200sma Monday, so I did feel that this is a sector that could be ready to drop, since the daily cycle was getting late—–and it did. Tuesday OIL broke down & lost the 50sma too. I would short it before I would go long at this point, but even a short may just get chopped up.
.
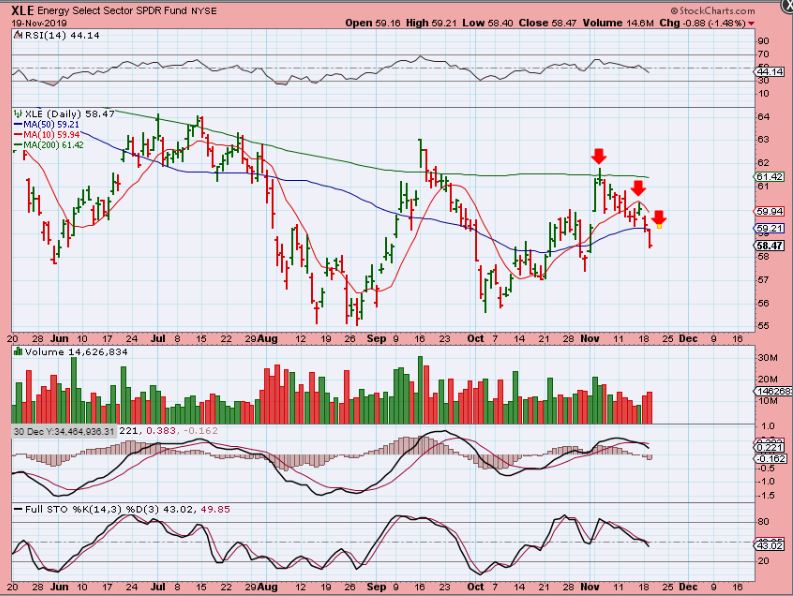
XLE – The XLE & XOP broke down Tuesday too. They both looked bad last week, and I mentioned that I thought that they may be leading the way lower. Oil is now following their lead.
.
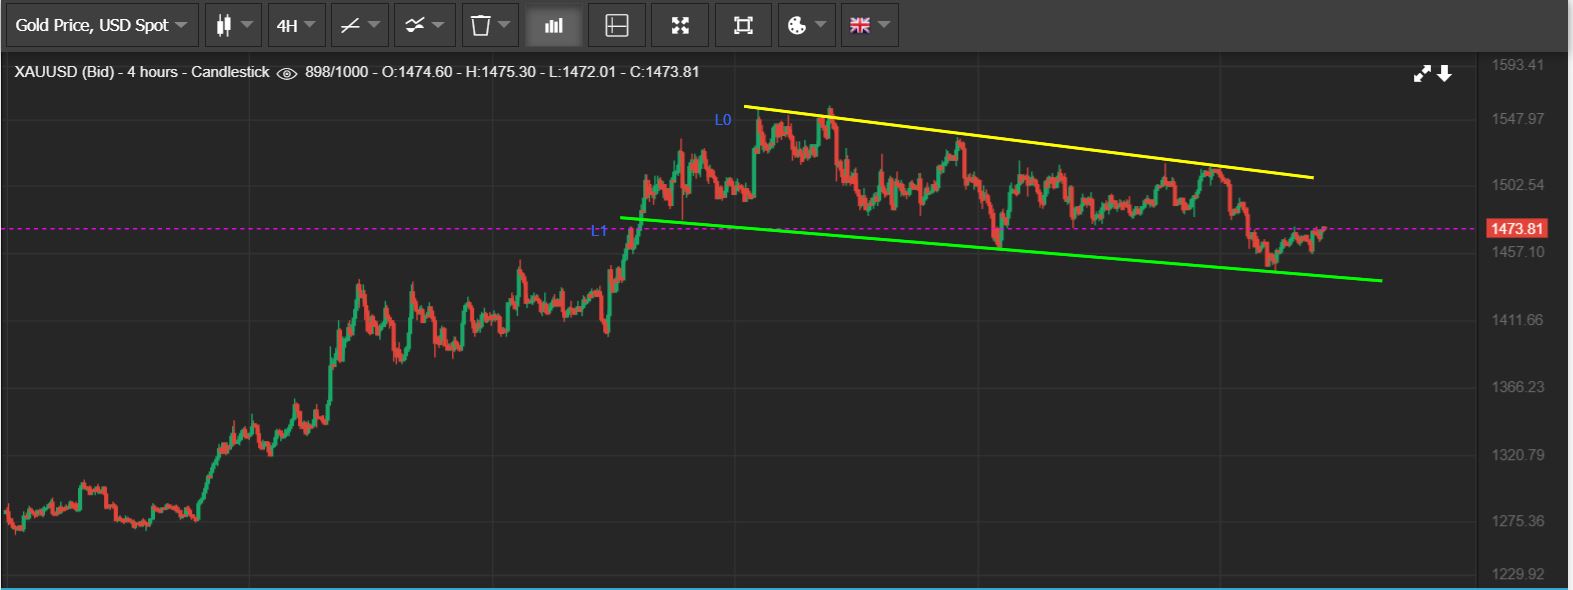
GOLD 4 hr chart – Gold is pushing higher after putting in a reversal, and it now appears to be a dcl. Unless it just bursts quickly higher & starts running away, it’ll take a little time to know if it will roll over as Left Translated & sell down? Or will it break higher & run as an ICL? I am going to show you a few charts with the GDX that will discuss this further shortly.
.
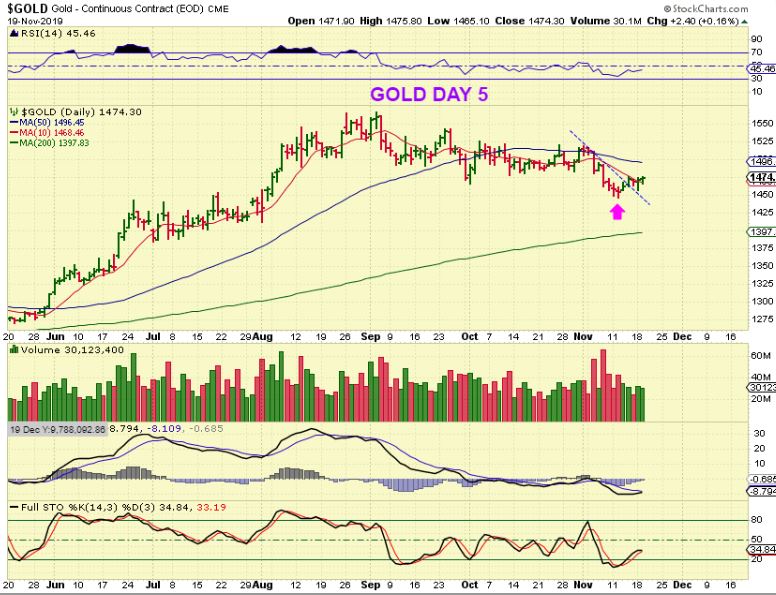
GOLD – Golds daily chart closed above the 10 sma and a down trend is broken, so I think we have a dcl in my opinion. This would be GOLD Day 5. Now my next chart will show you how complex things can get.
.
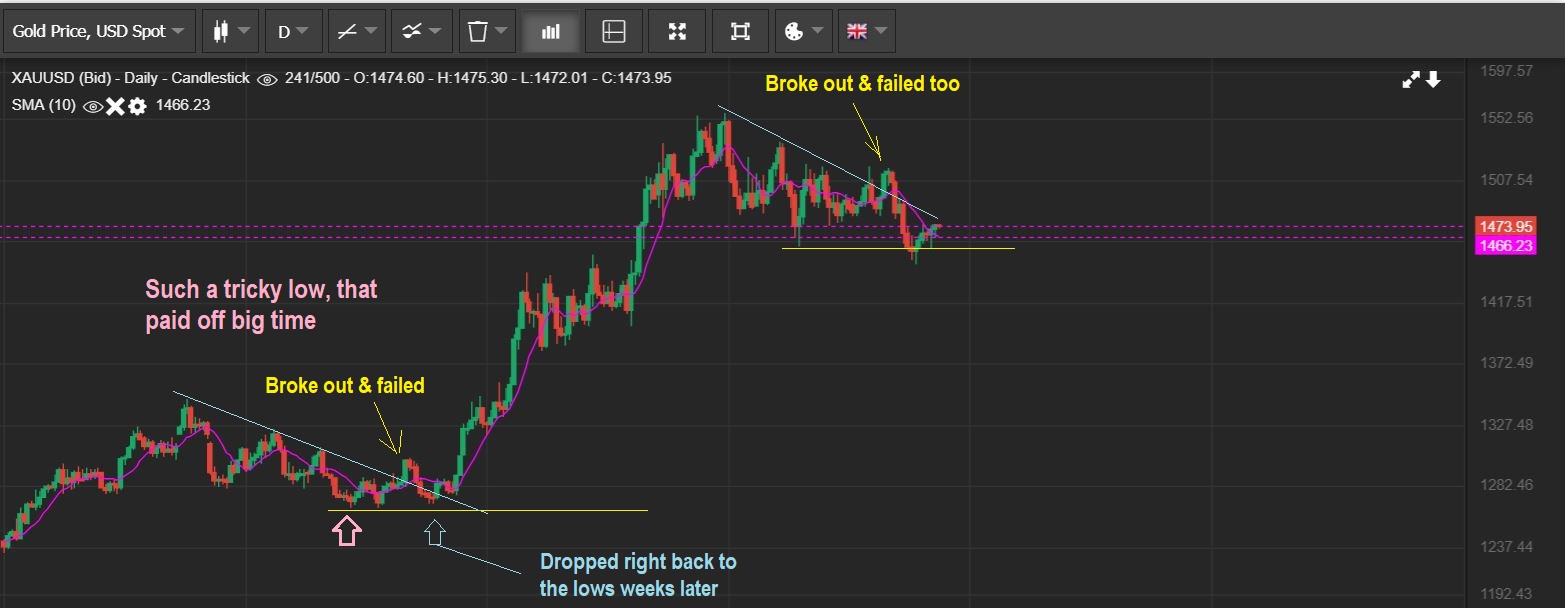
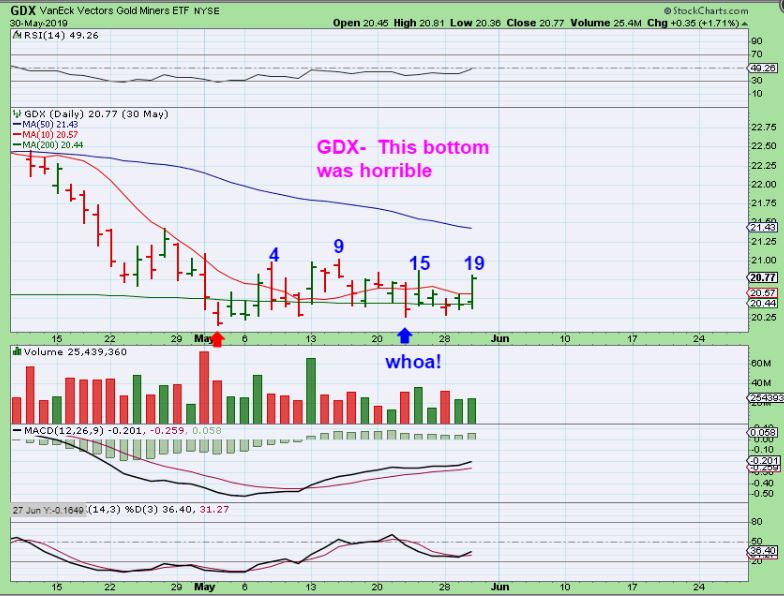
Look at our last ICL in May 2019. Many people tend to think back to that last ICL & think that it was easy, but IT WAS NOT. Here is a reminder of what we dealt with then.
1. Remember that GOLD & GDX bottomed in early May, while Silver & GDXJ broke down to new lows and bottomed lower at the end of May. THAT WAS CONFUSING.
2. I also remember a false break out higher & then it dropped right back to the lows. We had that this time too. See the chart in May.
3. With all of that choppiness, the drop back to the lows did NOT break those lows, so the ICL was in place. Look at the Blue Arrow– It was close to breaking the lows and therefore this bottom was choppy and difficult. That drop was scary & many people bailed out & sold positions right before it took off like a rocket near day 20! Will our current dcl act the same? We can’t really tell, but this reminder might help you to see how difficult these bottoms can become.
.
Now I want to show you another example of tricky bottoms being put in, this time with GDX
.
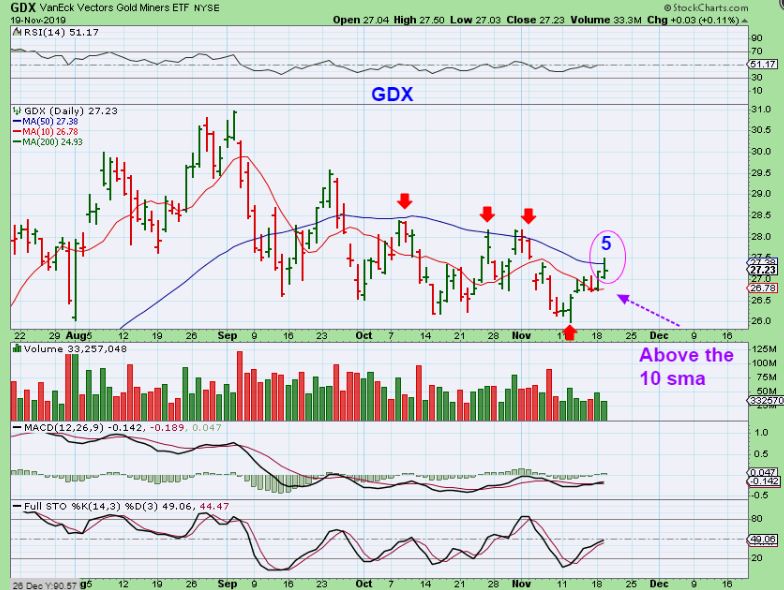
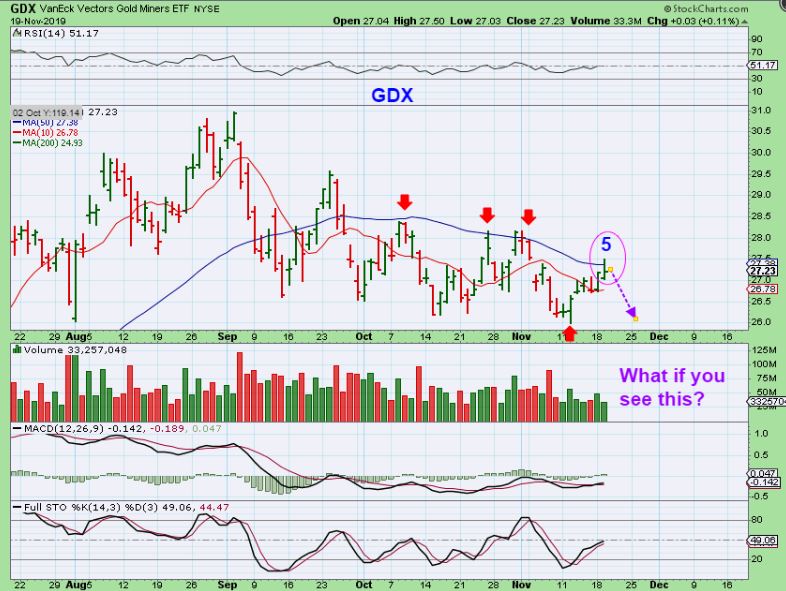
GDX Currently: GDX was looking good on Tuesday when both the GDX & GDXJ broke above the 50 sma for a while, but unfortunately they sold off into the close on day 5. We wanted a close above the 50 sma to help confirm bullishness. Let me just say that a peak on a L.T. daily cycle can come at any time, so a push right through the 50 sma & higher is what we would have liked to have seen. Is this just going to get choppy like in May? Or is this toppy & will sell down to a real ICL? We cannot tell yet.
.
I zoomed in and drew up a possibility—–
.
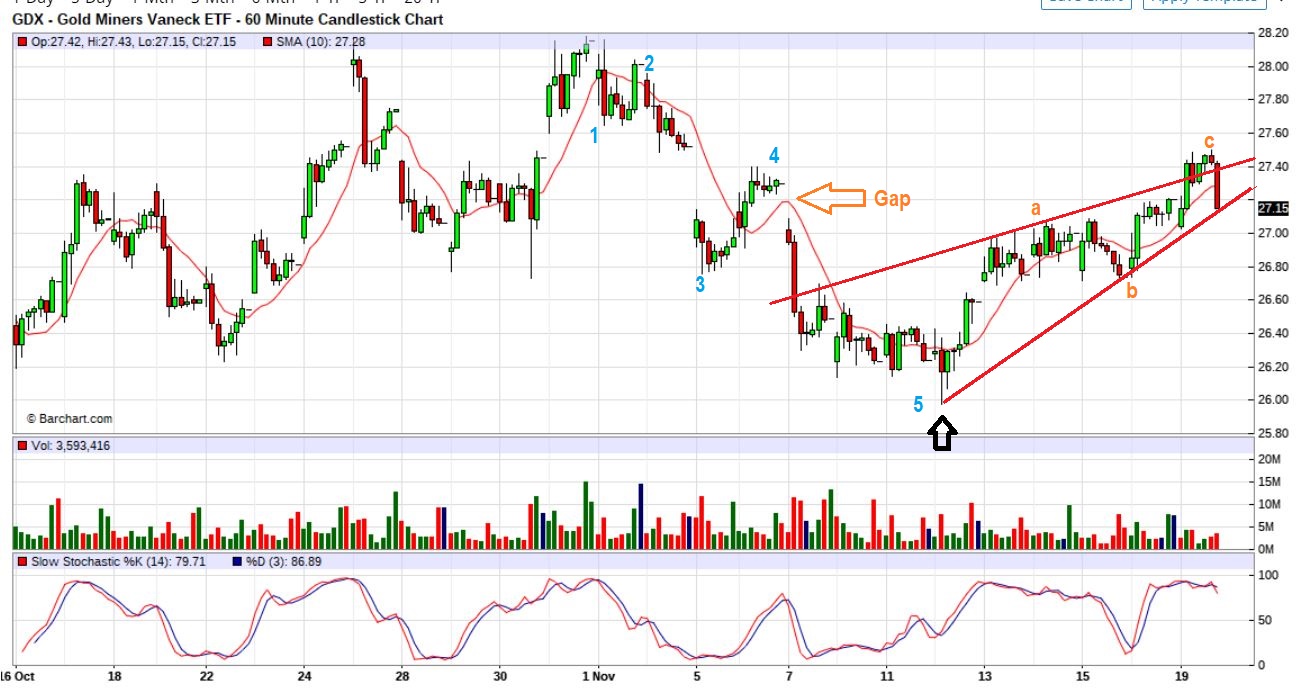
GDX 1 hr chart – I drew this as a ‘5 waves down’ from Nov 1st in blue numbers, and then the recent move could be a bearish rising wedge as an a-b-c. I want to say that a break down of the wedge does NOT have to break the lows, but it would drop down near the lows and make GDX choppy.
.
GDX – So what if we do get a sell down like this after day 5? Unfortunately, we still won’t know if this will drop to new lows into a sell off and a final daily cycle ( it could), or is it just another choppy bottom like I showed you in May 2018? Let me show you something…
.
Look at this bottom in the GDX. I’m sure that you will agree – THIS WAS NOT EASY! 19 days is 4 trading weeks. Notice how it reversed & dipped on day 4, then day 9, and even day 15! In fact, Day 14 was scary and actually looked like it would definitely take out the lows, right? And then…
.
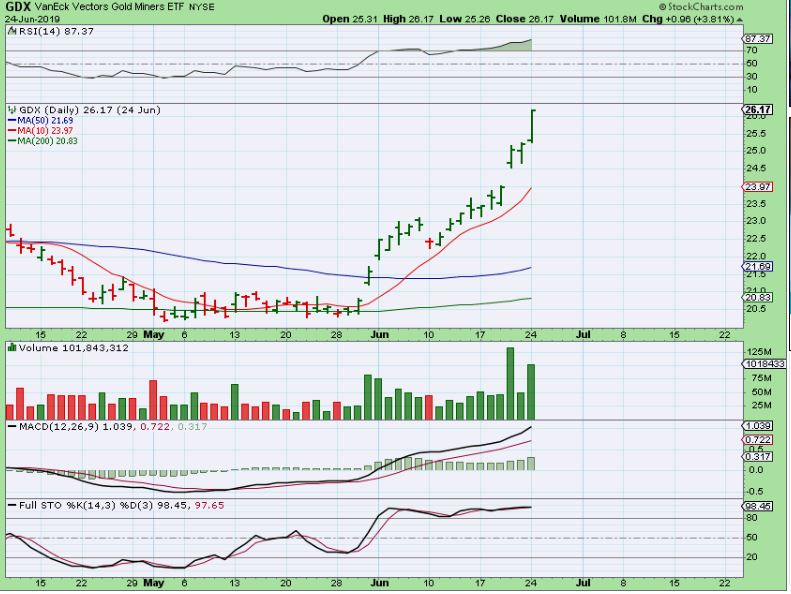
GDX – It just broke out & took off higher FAST- and that was AFTER DAY 19! I thought that it was important to review this, because riding GDX real time under choppy conditions always feels bearish, but until the lows break, you just never know.
.
So yes, this was our last ICL in May, and the choppiness left many behind that were not chartfreaks. A choppy bottom can do that. We bought this and to those that may have stepped aside I said to start a position in case this is a ‘break away gap’. I loved that POP and told readers not to wait for gap fills, because they don’t always fill. This choppy bottom that frustrated so many traders & shook them out turned extremely bullish in the first days out of that base and it just kept running higher.
What is the lesson? …
.
For my readers that have been with me for a while, I usually use this picture once a year. 🙂 It is just a friendly reminder that “Not All Bottoms Look The Same“. The ICL earlier this year in May 2019 was choppy and scary, but as long as the lows were not taken out, it could be the ICL ( and it was in May). Things can get choppy, and hard to ride, and the lows may get threatened, but it is hard to know what is going on until either the lows are broken and it drops or until the price runs higher. It is not possible to tell if this will roll over as a L.T. Daily cycle selling off, or if is is just another choppy base like May 2018, because
ALL BOTTOMS DO NOT LOOK THE SAME.

.
So now you have a choice. Get off the ride and lock in gains at day 6, and see if it breaks one way or the other? Or ride it out with a stop and see if it is just bottoming and takes off higher. This is also why I say that buying AT THE LOWS is not always easy and not always for everyone. Some may want to wait until it breaks higher, closes above the 50 sma, and then try to take position. You can always get back in after the lows are in place.
.
Again- This was our choppy bottom, giving anyone with leverage a hard time and anxiety. Day 14 was scary. You could have just sold your position and waited for a break down or break out higher…
.
You would have to just jump back in on the first real sign of a Bull Run starting, but you didn’t really miss that run, right? You missed 4 weeks of anxiety during May though. 🙂
.
I personally ride it out and just allow the market to take me higher or take me out. I DO hate getting stopped out, but that run that followed would easily make back any small loss taken at the lows. At this point, all of the Miners that I have been pointing out still look great, so this may just be a choppy bottom for GDX & GDXJ as they struggle at the 50sma. When I’m looking at charts of SVM, HL, CDE, IAG, AUY, BTG, SBGL, etc. etc. etc. They seem to indicate that an ICL is in place & that Miners want to go higher. Time will tell.
.
For now we wait and watch, ready to exit if the lows are taken out, and maybe even get ready to pounce on it if it takes off higher and you have cash to load up on positions. At this point, the lows are in and only time will tell how it plays out going forward. Stay Frosty like the big Cats do – always ready to pounce when the chance comes along.

Enjoy your Wednesday trading!
.
~ALEX
.
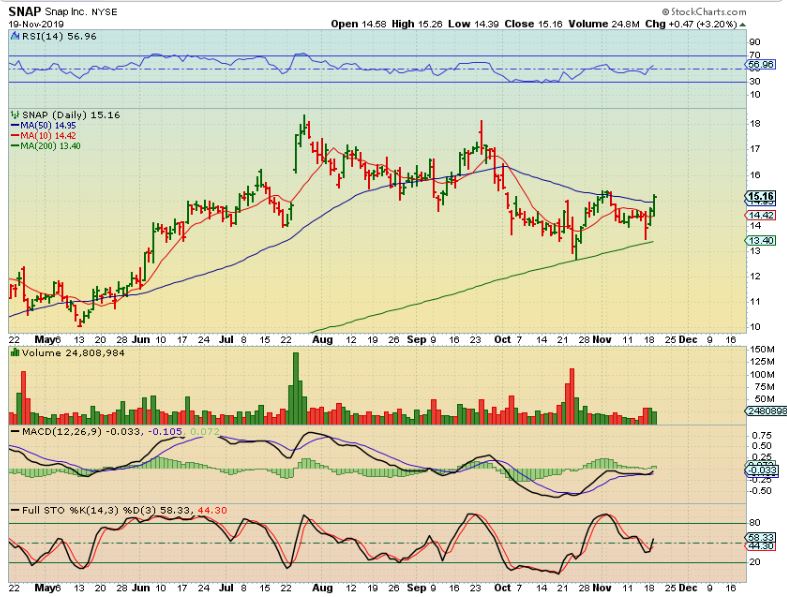
SNAP – From yesterday, it is a BUY