November 9th Weekend Review
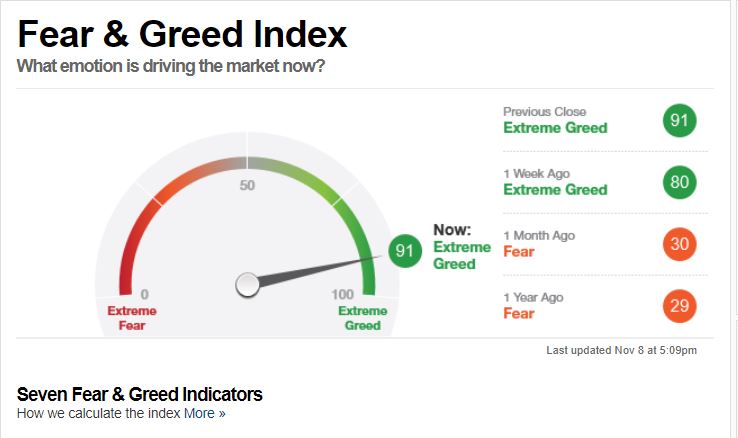
As a reminder, I started Fridays report discussing FEAR & GREED. Excess GREED can lead to a sell off, excess fear is often seen at the lows. I mentioned that I have been seeing EXCESS GREED, which usually signals that a sharp sell off can happen. GREED is currently SO HIGH ( 90%!) , that it looks serious & I wanted to research this further. THAT IS WHEN I FOND SOMETHING THAT I FIND VERY INTERESTING, even contrary to popular belief …
.
Notice that GREED reached 91% Friday, EXTREME GREED.
.
I REPORTED THIS FRIDAY :
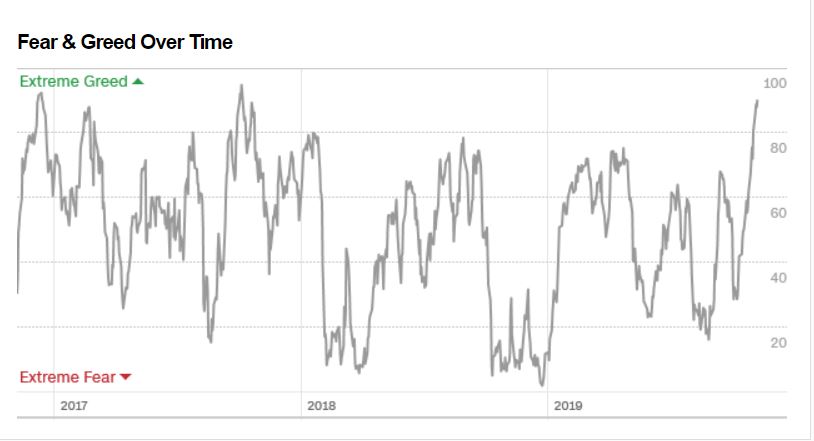
FEAR & GREED – Notice Greed is at 90%. Go back to 2017 and the end of that year is the last time that I found Greed at this 90% level as seen on this chart. Notice how we are currently at 90 reaching near 100% now, and look back at what looks like OCTOBER 2017. That seems to be the last time the Markets hit 90. So I had to ask myself, ” I wonder what happened in the last few months of 2017 when Greed hit 90%? Did the Markets top & Crash??”
.
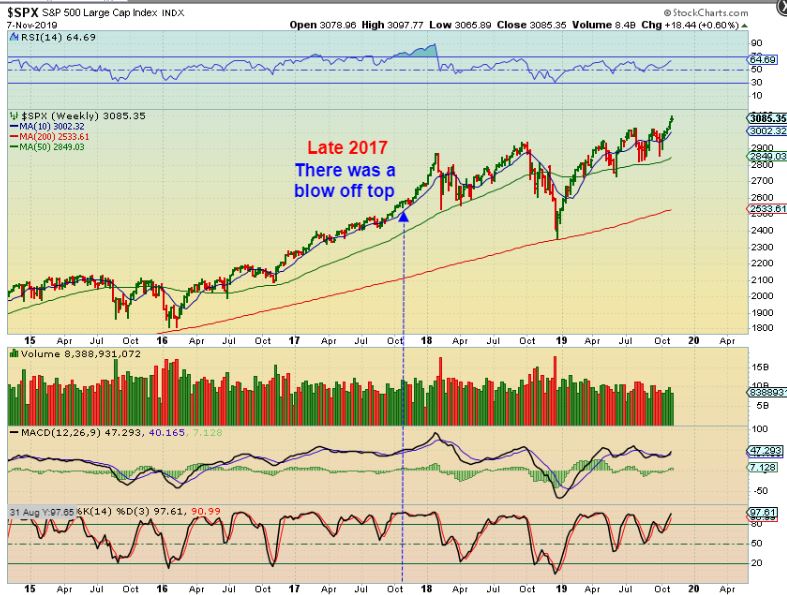
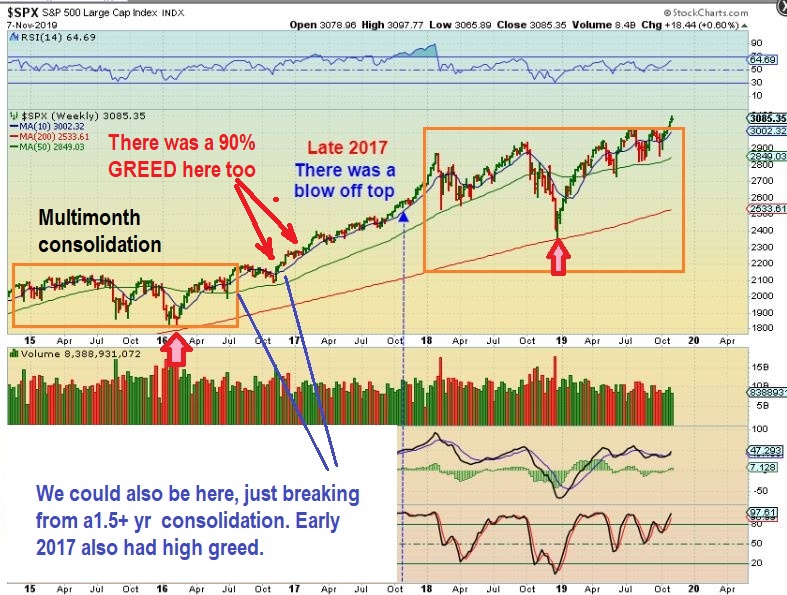
SPX– Look at September / October 2017 to the end of the year. Greed was 90% then too and the markets just rallied to a blow off top. I will discuss this in the weekend report, because I did a bit more research and found other factors…
So here we are at the weekend report and this is what else I found…
.
I see many analysts saying that the 90% Greed will cause a crash. Ok, it could, but look at this chart again. I see 90% greed Now, but also at Late 2016/early 2017 , and at the end of 2017. ISN’T IS IMPORTANT TO SEE WHAT HAPPENED THEN, BEFORE ANNOUNCING THAT 90% GREED LEADS TO A CRASH? DID MARKETS CRASH THEN?
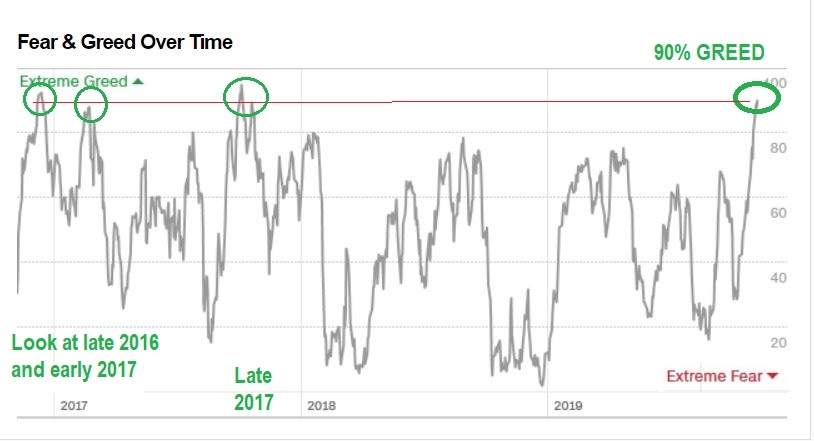
This chart shows me the end of 2016, early 2017 , and the end of 2017 (All 90% Greed). I do NOT see a crash in any of those times. In fact, markets broke out from a multi-month consolidation and the Bull ran strong, eventually into a parabolic top. That is also what is happening now ( mult-imonth correction break out) The ‘Greed’ condition actually wore off on the run higher as everyone started to ‘fear’ a pull back. VERY INTERESTING. So…
,
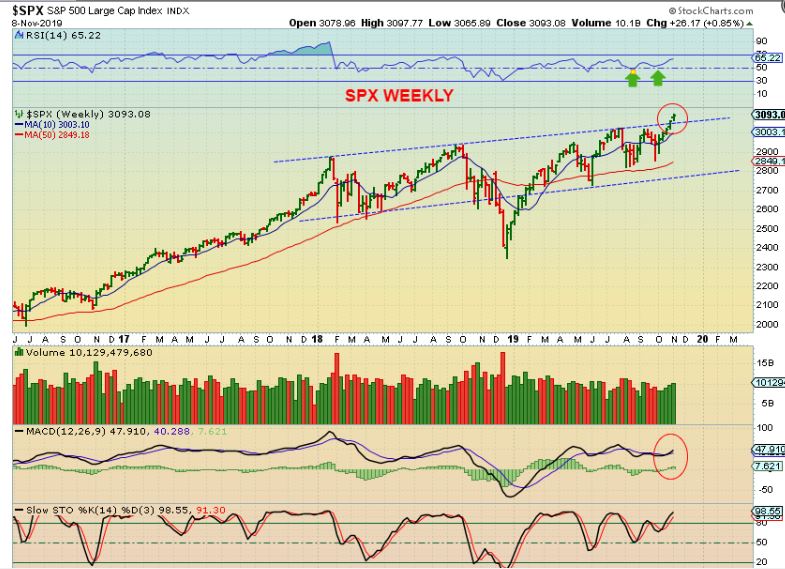
Right now we broke to new highs from a multi-month consolidation again. We have 90% GREED. Do you see that big drop at the end of last year ? That came after a few Fed Hikes, when the Fed Juice ran out. Now the Fed is cutting rates again and the markets are running higher again. My Point? This could lead to a parabolic blow off top eventually, since that is how most markets top. That said, I DO EXPECT A PULLBACK and not a straight up run…
,
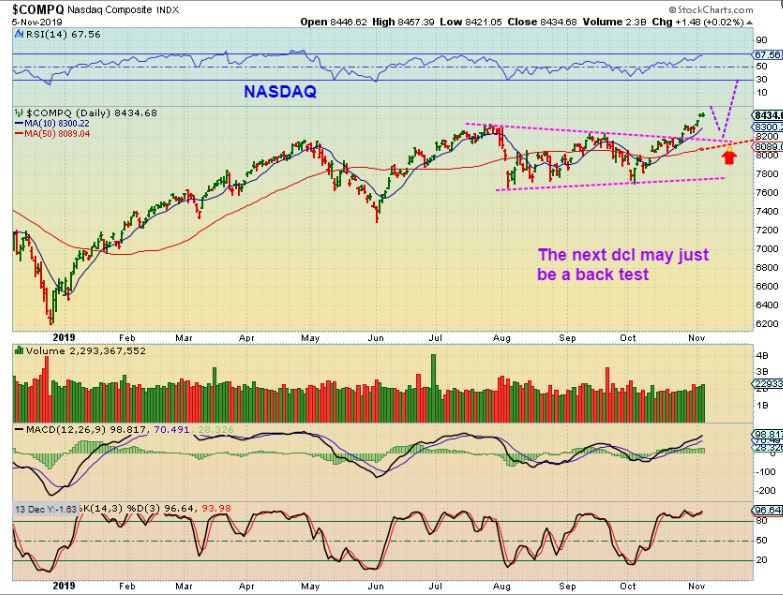
I have also discussed that a drop may just back test the recent break out as this daily cycle ages. That may be a great buying opportunity. For now I have admonished raising stops from the 50 sma to the 20sma, and now to the 10sma this late in a daily cycle & go from there.
Having mentioned all of that and after having pointed out those bullish charts, we need to expect that Fundamentals seem a bit worse than in the 2017 time period. I have seen many ‘Earnings reports’ drop stocks 15-20%, so we always use stops and we will take it daily cycle by daily cycle. I Just wanted to point out that these markets broke to new highs out of a multi-month consolidation, and that can be very bullish. Greed is high, Fear is low, but now we’ve seen that from a contrary view point ( historically). As always, We will watch this play out daily cycle to daily cycle, ready for whatever comes our way.
.
,
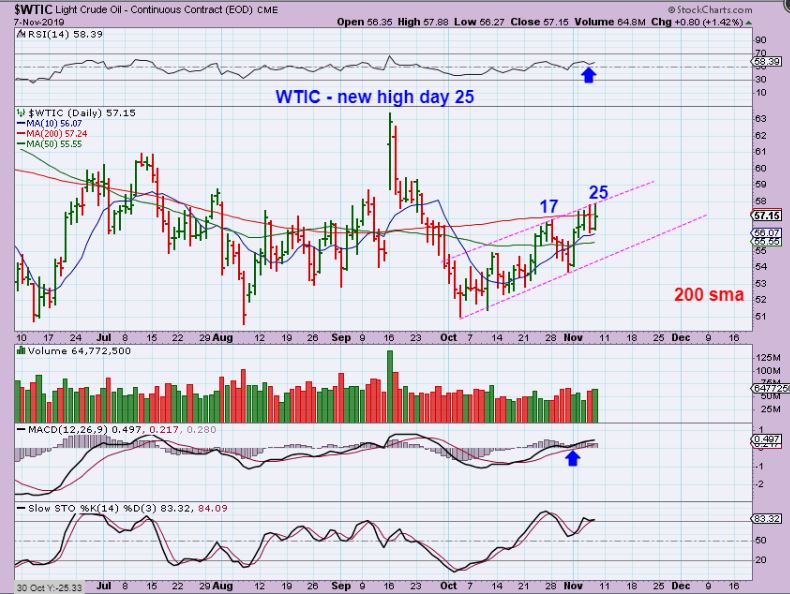
WTIC – Thursday Oil was pushing on that 200sma. A new high on day 25 (Thursday) makes this look like it will be a r.t. daily cycle. Notice that on a daily chart the 200sma was priced at $57.24.
,
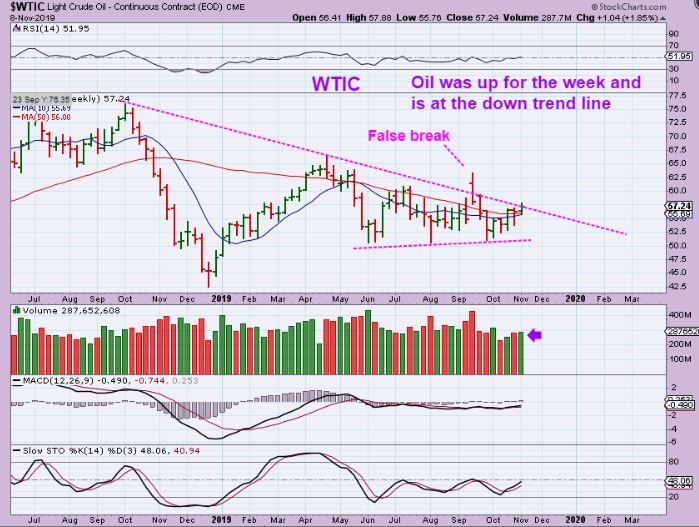
WTIC WEEKLY – Oil closed at $57.24, so day 26 is a new high too. It may Finally be ready to break out again, after a failed break out in September. Oil & Energy stocks also look to be in a bottoming process…
.
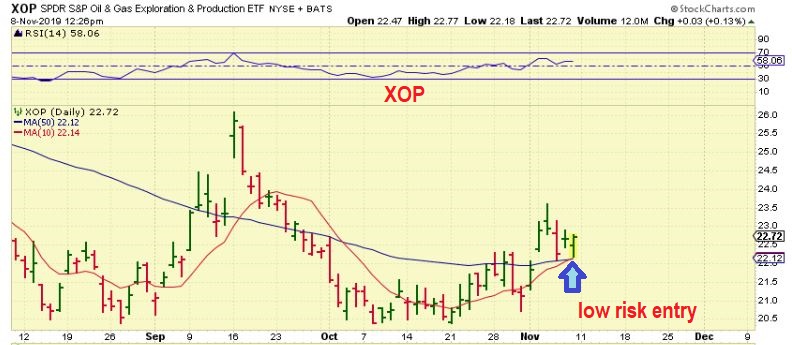
XOP – After a small rally over the past few weeks, the XOP dropped to the 50sma, and reversed Friday. For those that like to ‘Buy the Dip’, THIS Is what it means to properly buy a dip. We don’t just buy ‘anything that has a down day, but we would
1. Patiently wait for a few days drop to a support area,
2. Look for a reversal, and then you can buy at support with a tight stop. So this is a buy and…
,
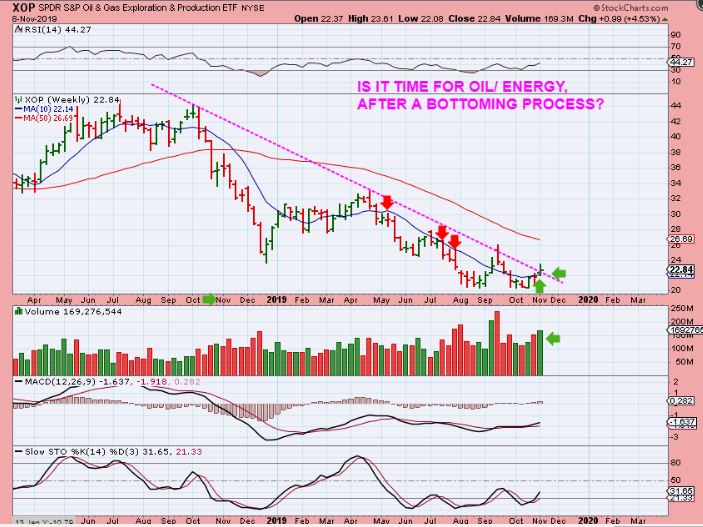
XOP WEEKLY – The weekly is actually trying to break from a downtrend. It did close above the 10 week MA with good volume, so this sector amy FINALLY be ready to move higher . Oil stocks will be monitored ( MRO, DNA, OAS, LPI, WTI, WLL, VLO, etc are just a few of the many that I watch on my watch list).
.
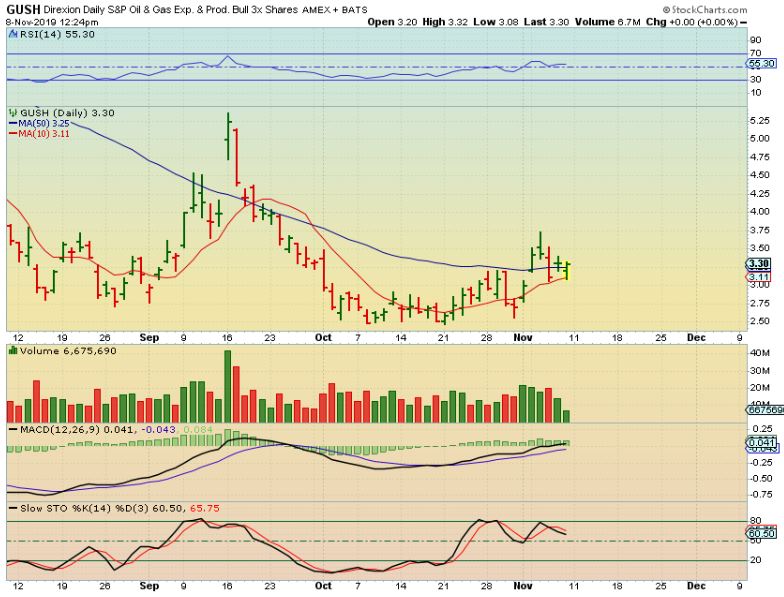
GUSH – And of course, the leveraged trade like GUSH, OILU, etc come into play. OILU just ran from $13 to $18, but it did have some chop & drop that would have been difficult. GUSH ran from $2.50 to $3.75, also with some difficult chop.
,
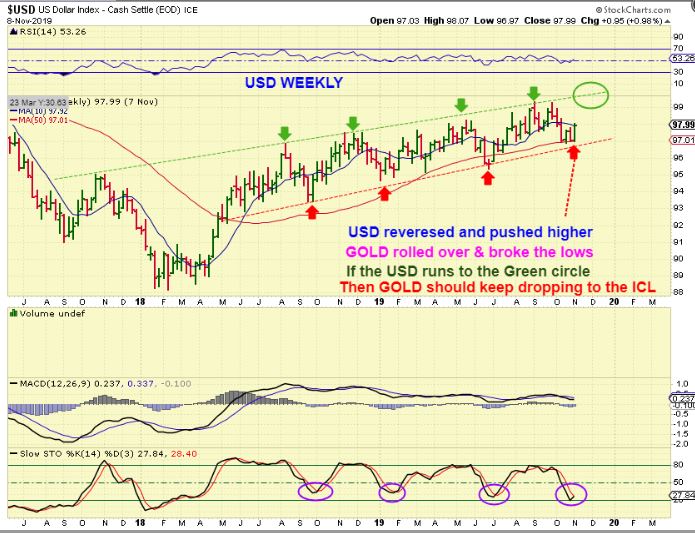
USD – The USD looks to have put in an ICL. What does that do to Gold Usually? Often the USD pops & that drops GOLD into its ICL. If the USD runs to the upper green line , Gold may keep dropping to its ICL.
.
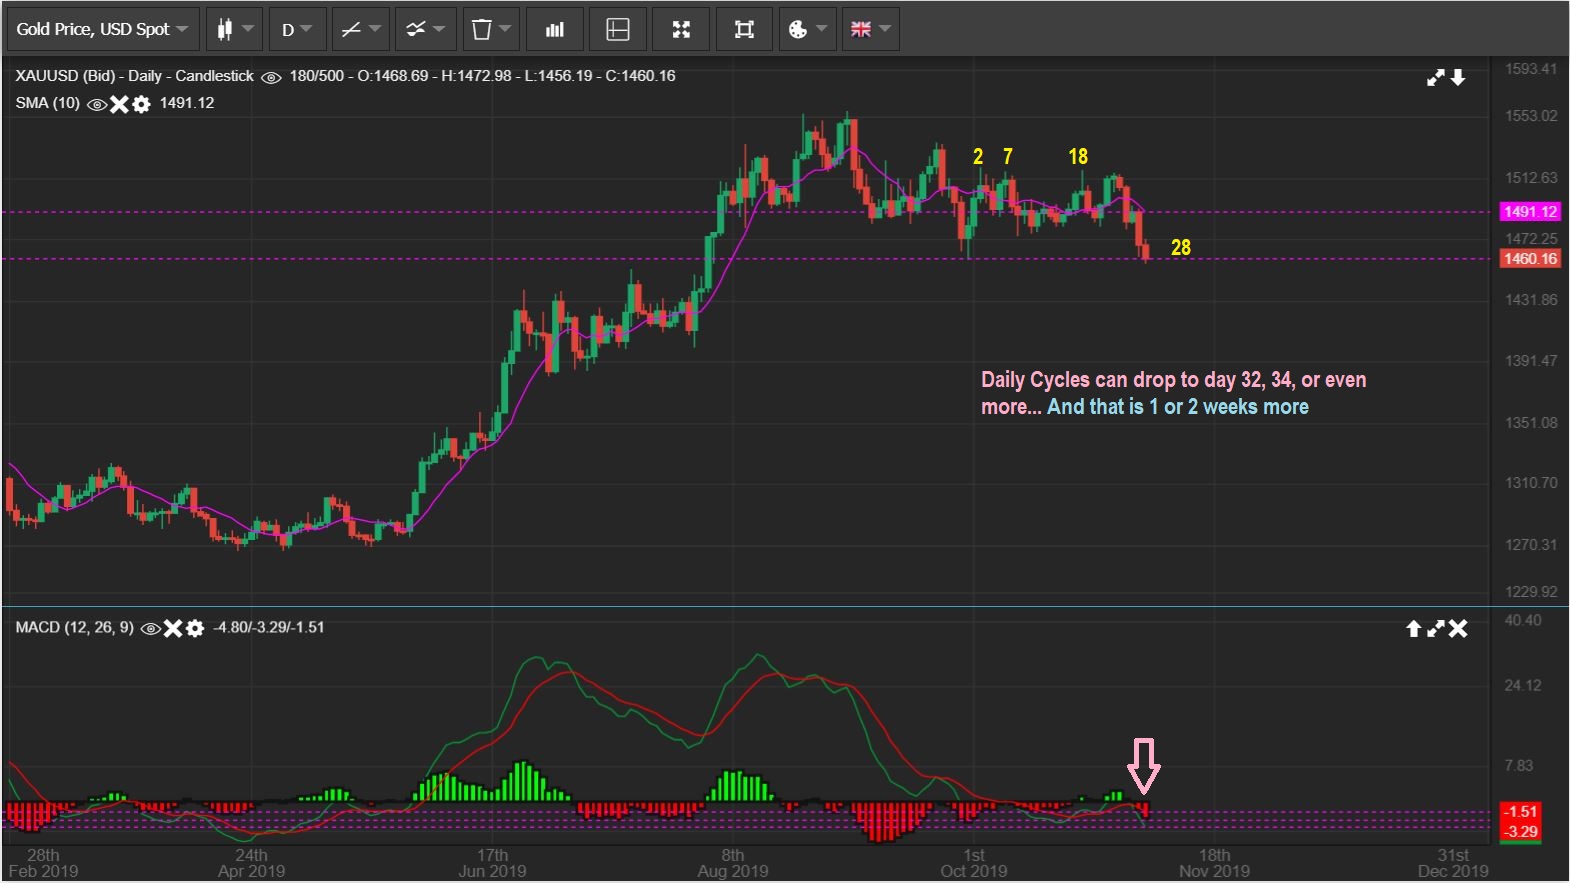
GOLD DAILY – Gold has now been dropping for 4 of the last 5 days. We broke to new lows ( a failed daily cycle) and this tells me that we are dropping into the next Daily Cycle Low. It is MOST LIKELY GOING TO BE AN ICL , but I should mention that another final daily cycle drop into December is not impossible time-wise. For now I deem that as less likely based on Miners holding up pretty good, but I will discuss it a bit more later.
.
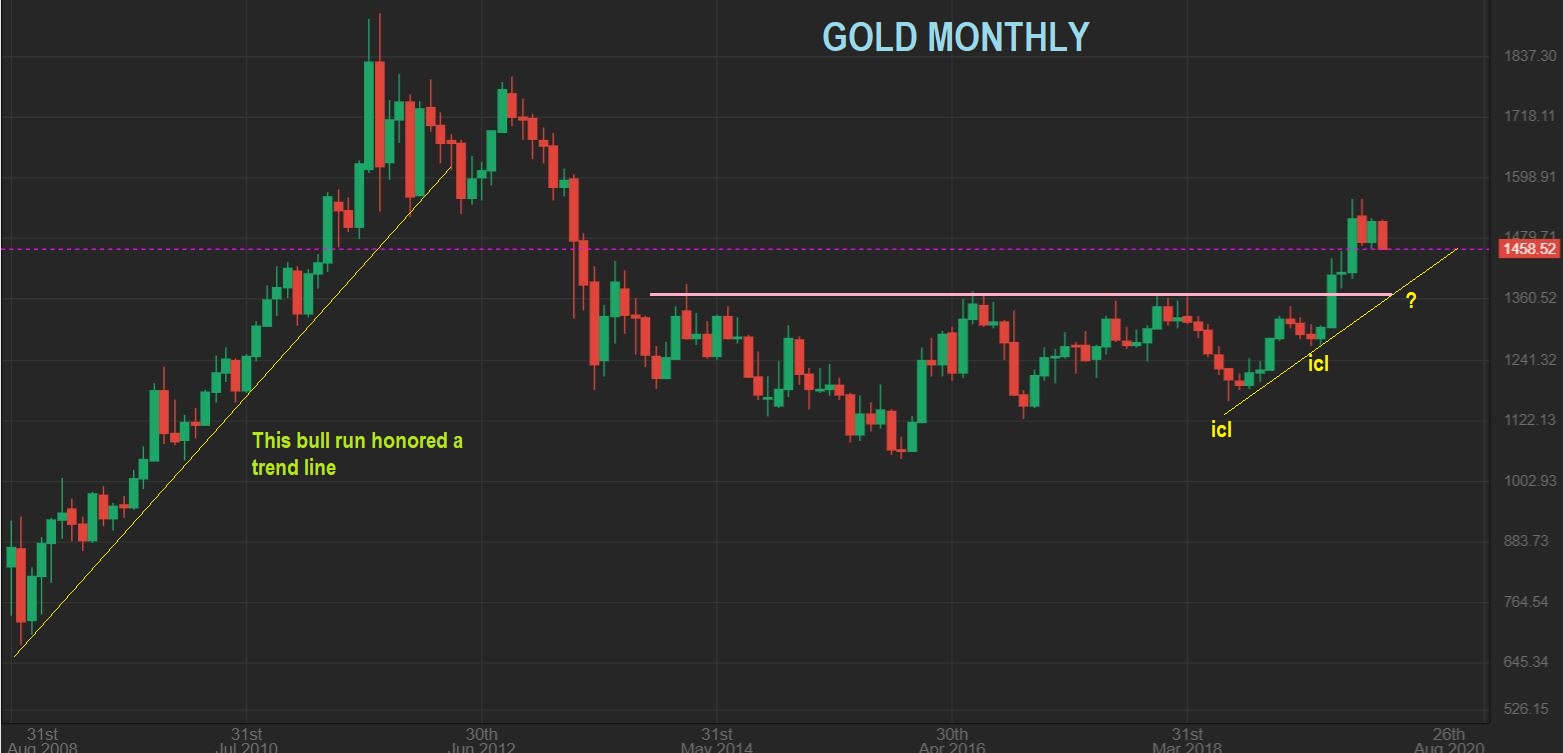
GOLD MONTHLY – I honestly expected a back test and we never got it. We do not HAVE TO get one, but if we did, the ICL could be as low as $1380- $1400 using the yellow line. So far this just looks like a nice Monthly Bull Flag as a 1/2 way point in this initial run to prior highs.
.
THE FOLLOWING 2 CHARTS WERE IN FRIDAYS REPORT
.
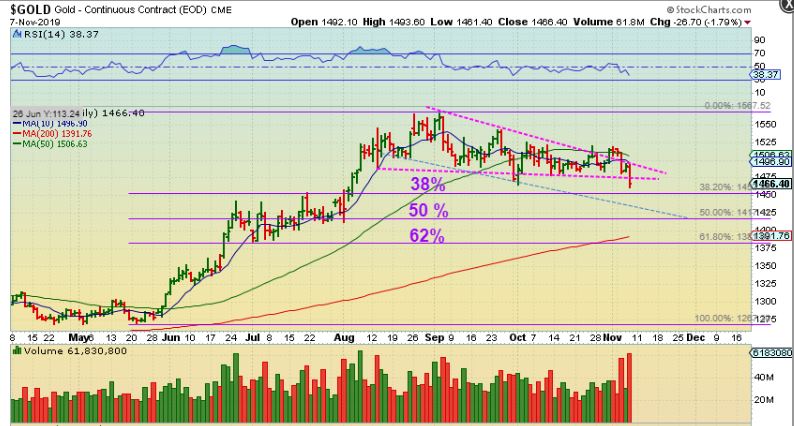
GOLD – Gold is nearing the 38%, and that is a support area from the July consolidation, so it MIGHT stop there. A drop to the 50 & 62% would bring it to the 200sma. Any of these could be valid and ICL drops can be sharp. Let me show you one more thing…
..
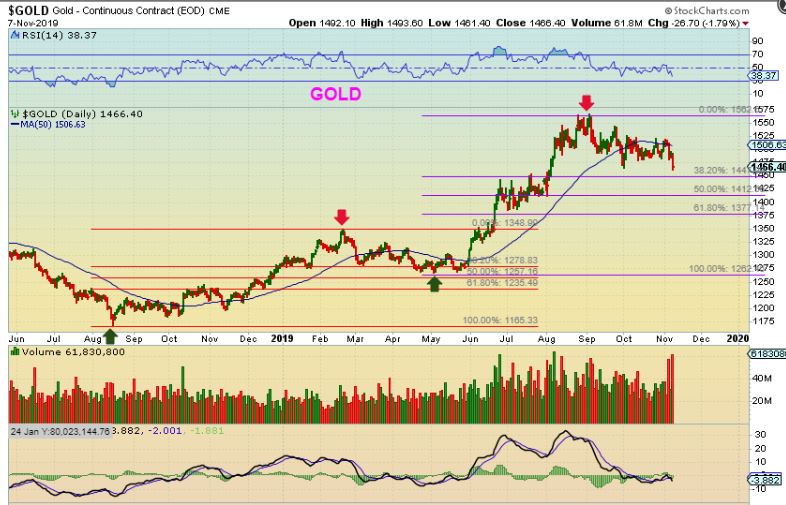
GOLD –
A) Tagged that 50 sma repeatedly in Feb to May as it slowly dropped to an ICL. That drop was Choppy, Sideways, and Frustrating too. Notice that it only dropped 38 – 50%, but that low was tricky.
B) A repeat of THAT may be what we are seeing now as we approach 38%. We could be close to the low here, but this weeks drop on day 25 & day 27 may be the start of the final drop with up to 34 days or so.
.
How could GOLD put in a dcl next week, and then actually have another Final Daily Cycle? I will show you something similar to what we have now…
.
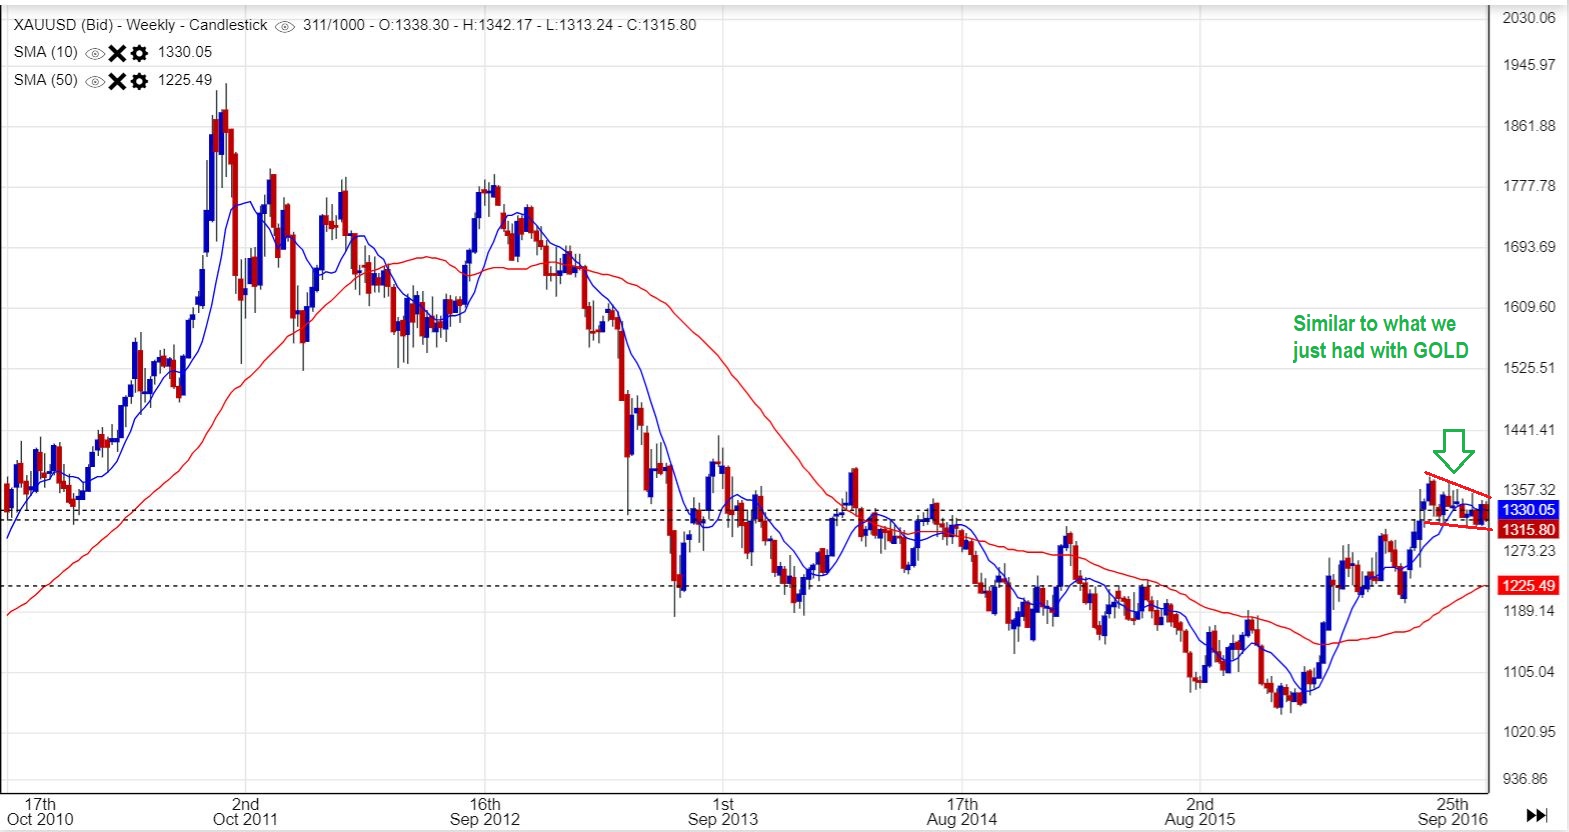
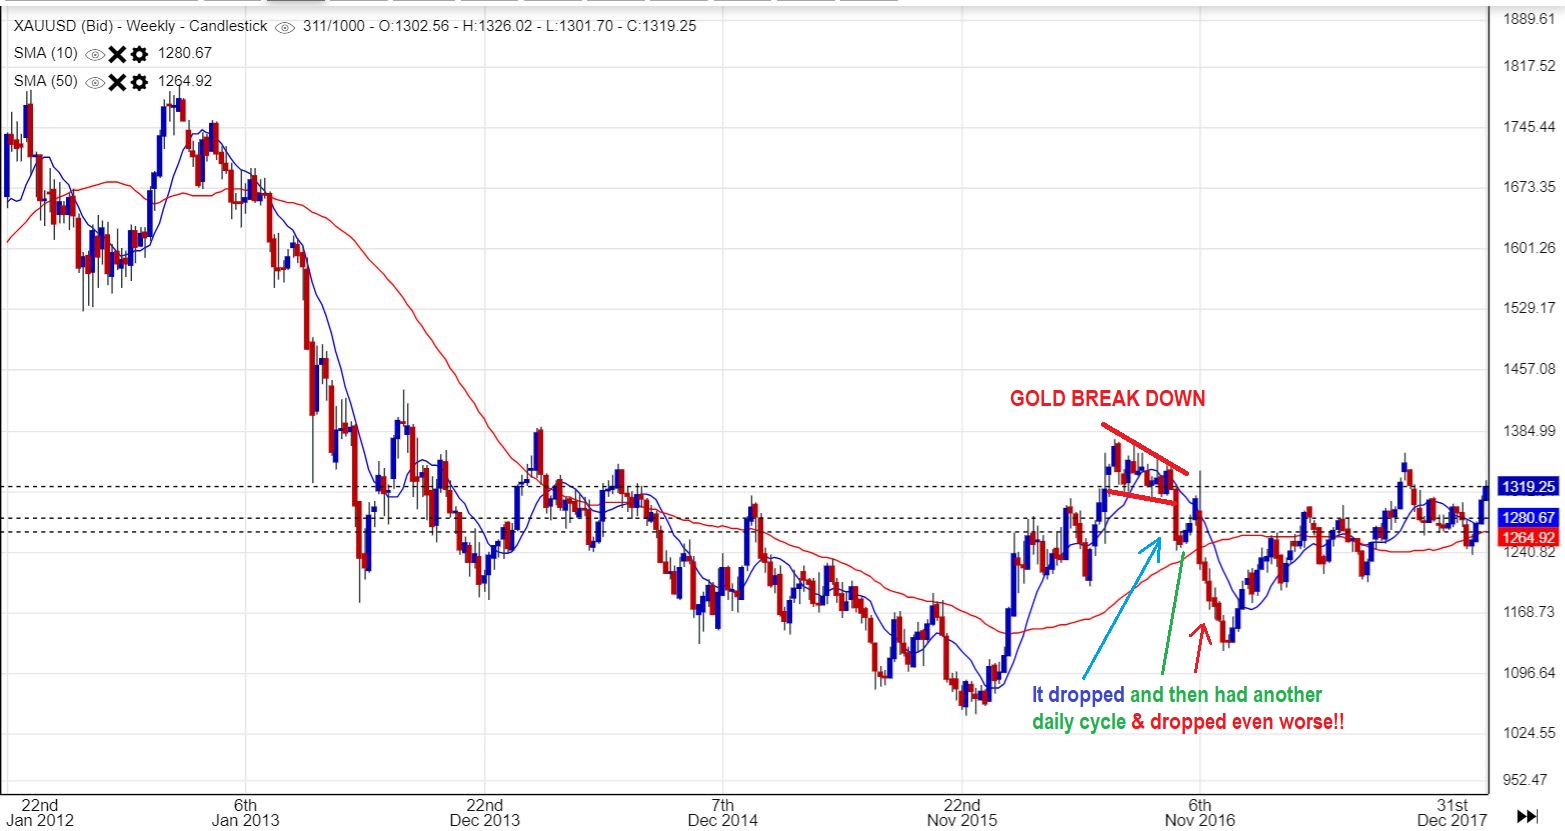
GOLD PROGRESSION – Doesn’t this look like the flag like chop that we just saw? It too looked too strong to drop, but watch what happens next…
.
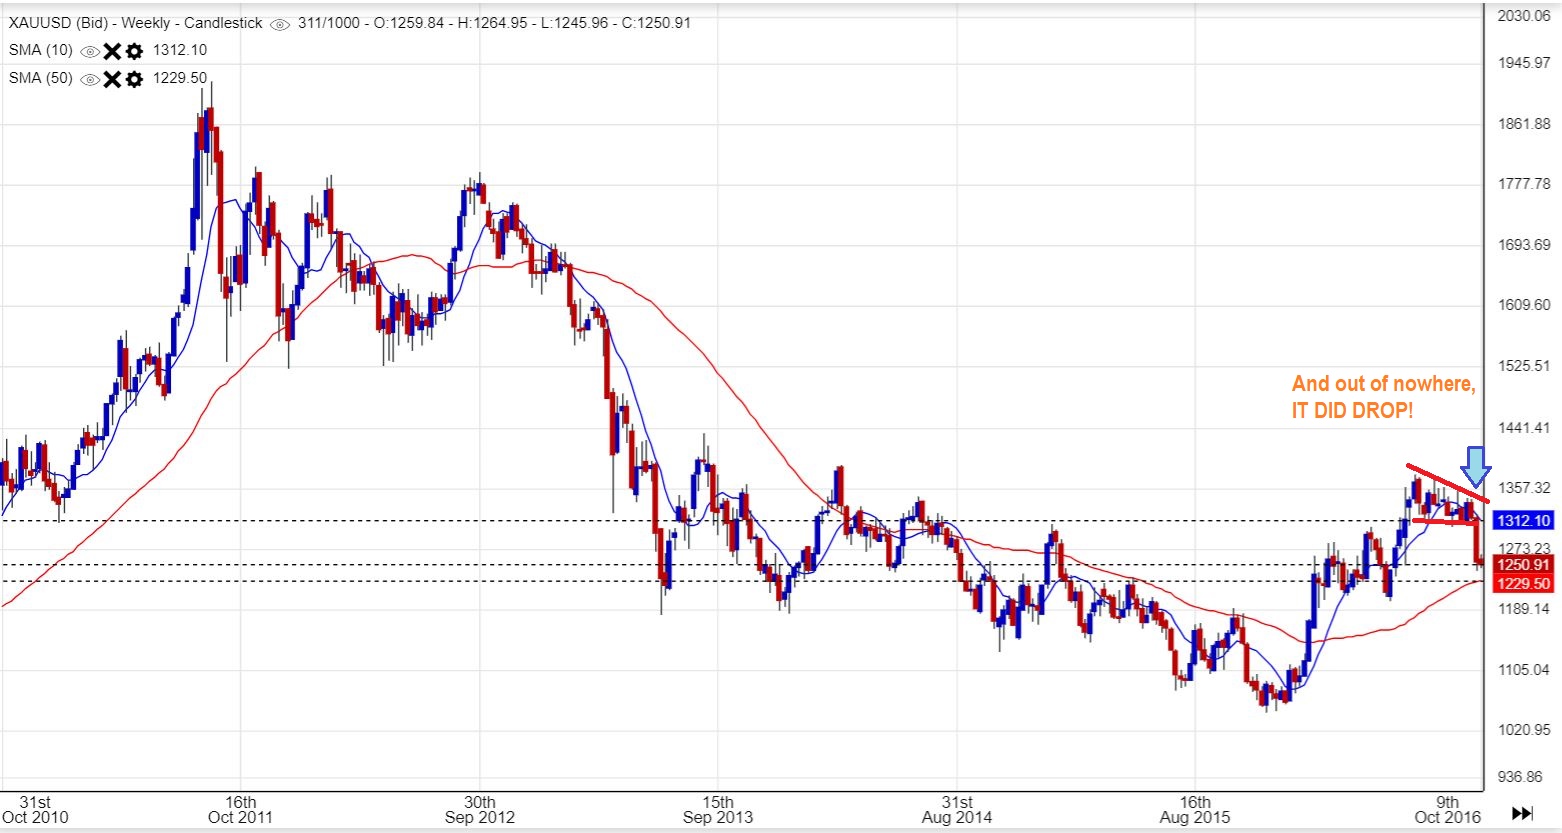
GOLD – out of nowhere, a big weekly drop. We actually just had that too. Well, it was close to support of the red line, so what happened after this drop?
.
GOLD BREAK DOWN – A DCL was in place a week after that drop, it rallied for 3 small weeks and then rolled over into a sharp ugly drop. That strong looking bull flag was damaging to those that Buy & hold. So I just like to constantly recommend using stops to avoid such drops. That said…
.
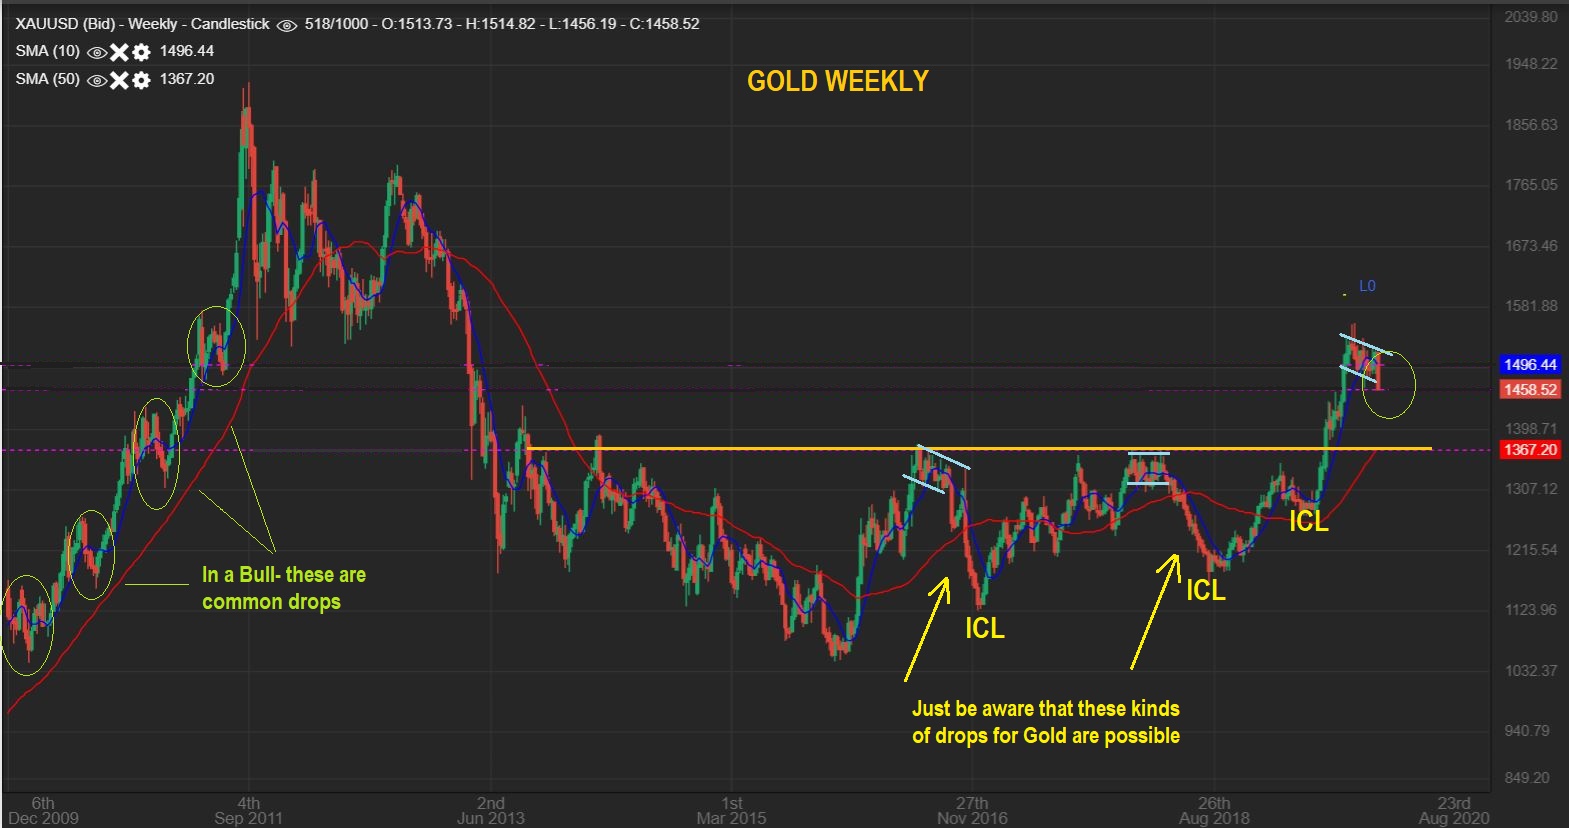
GOLD –Though DEEEEEP drops do happen in Gold as shown here, common ICL dips can be seen to the left with Green circles. We could still have further to go to just match those common drops too. Please read this chart.
.
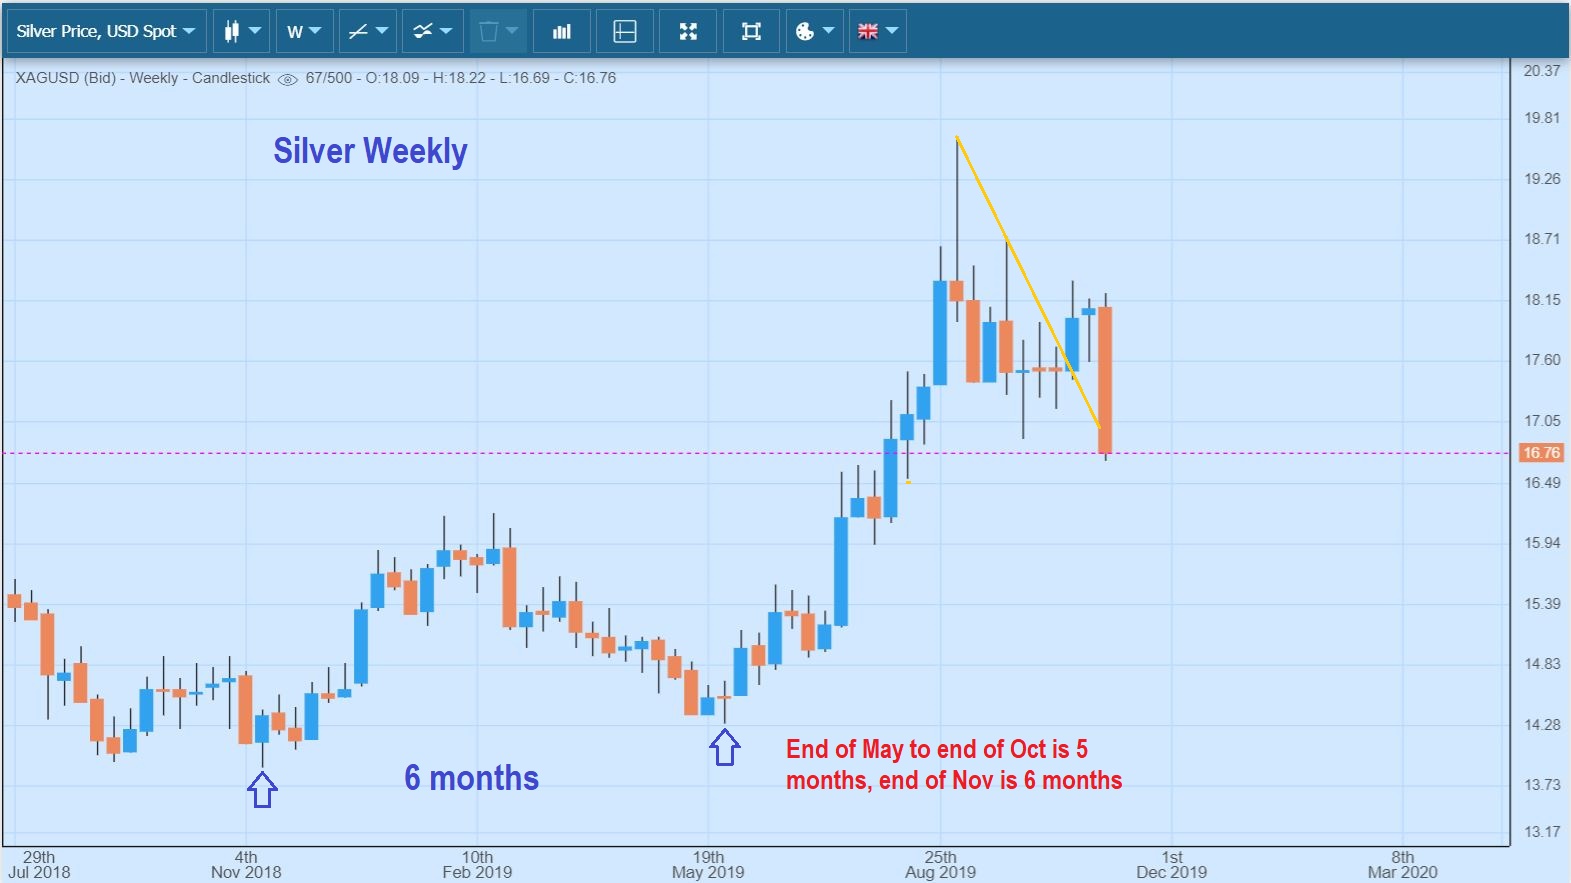
SILVER – Silver was looking good until this past week. That is a 1 week drop for Silver, and we have new recent lows hgere too. Next week could drop even further. At least most Silver stocks held up pretty good so far, under this pressure.
.
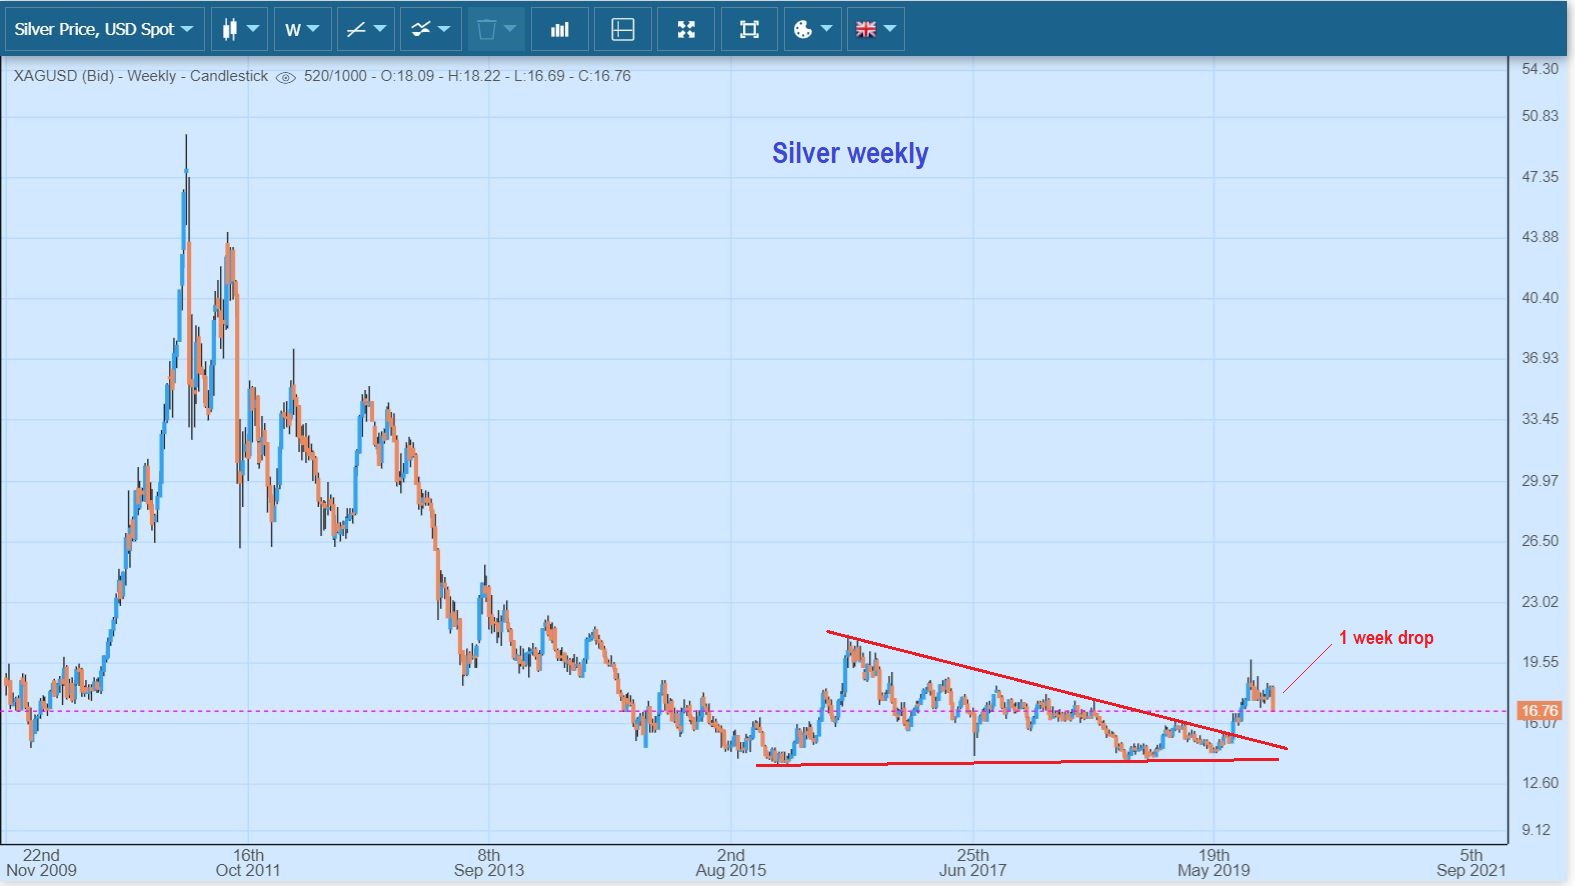
SILVER – It still resembles a weekly bull flag, but we’ll see what happens next week.
.
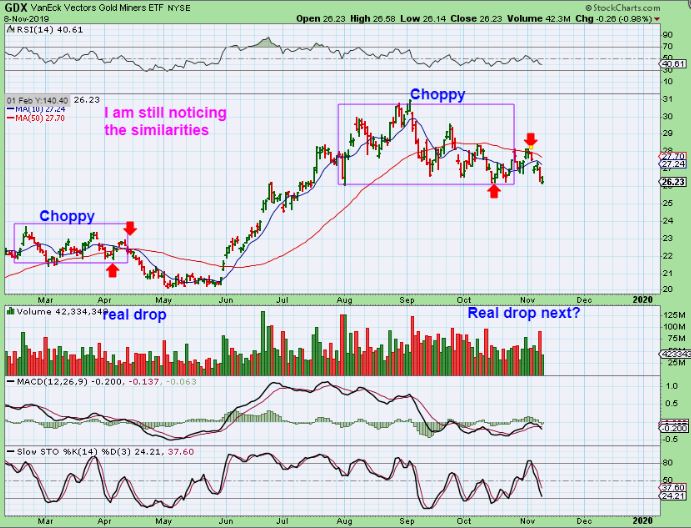
GDX – I do see similarities between the drop into the last ICL and this one.
– They both had choppy topping areas and looked strong .
– They ran up & tagged the 50sma , but then notice how the April sell off went.
– Until then, things looked strong like they do now
– So let’s just be aware of these similarities. Look at the Red Arrows after the chop dropped from the 50sma. This week changed the look of GDX & especially GDXJ.
.
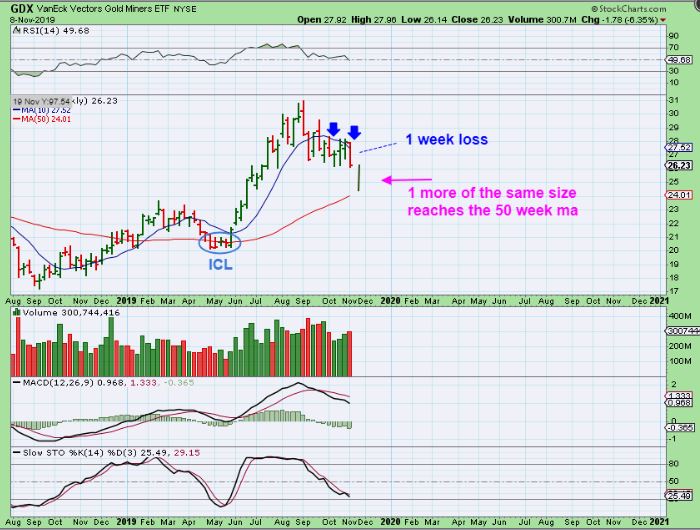
GDX WEEKLY – On a weekly chart, we see that we have been selling downward. We had 1 solid week drop last week. Now if we had another one equal to last weeks, we could drop just above the 50 week ma.
.
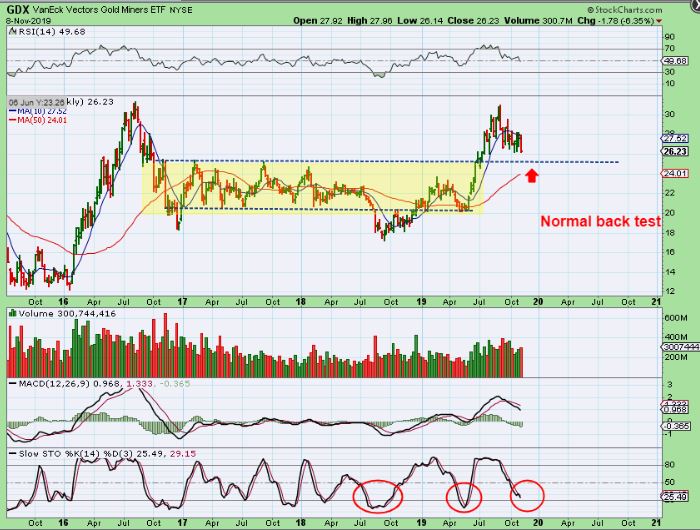
GDX – I have always expected a back test of this break out, and now this chop & Drop could bring us there. That is the $25.50 to $26 ish area. That is not much deeper for GDX, maybe close to only $1 lower.
.
THE FOLLOWING CHARTS WERE IN FRIDAYS REPORT AS A GUIDE TO THE DROP TOO
.
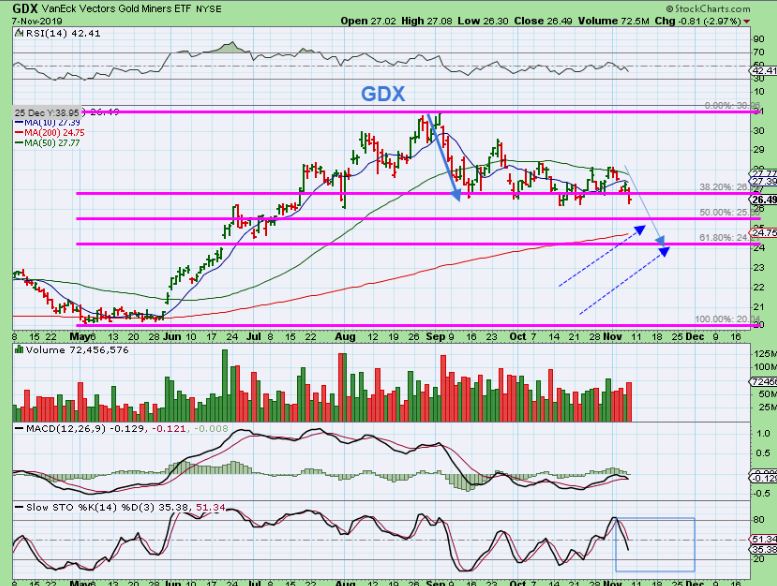
GDX – GDX FIB LINES are given on this chart, so we could see Miners drop further too. The stochastics is not oversold yet. The 50% is again around $25.50 ish. The 200sma is $24.75.
.
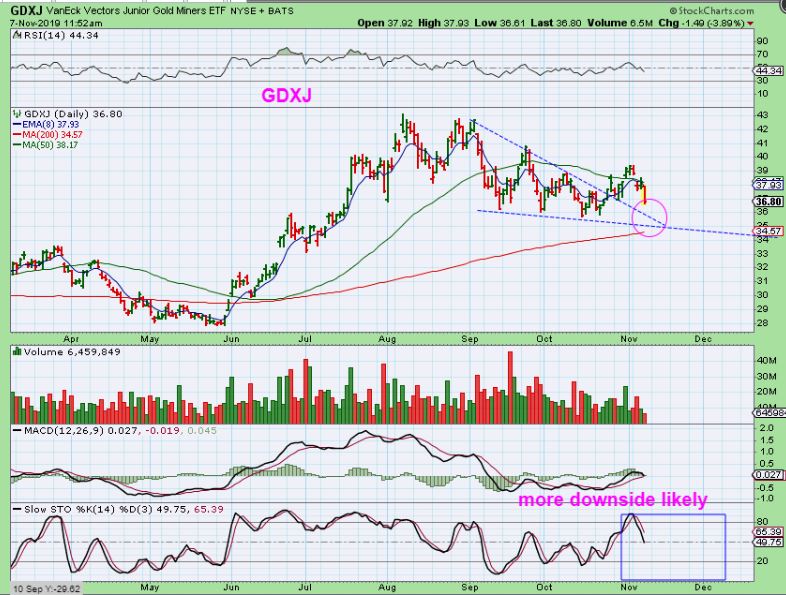
GDXJ – So GDXJ closed above the 50 sma for 3 days looking bullish, but on Tuesday it broke back below it ( Fake out). I closed my long positions because this could drop further, Possibly to the 200 sma. Read the chart.
.
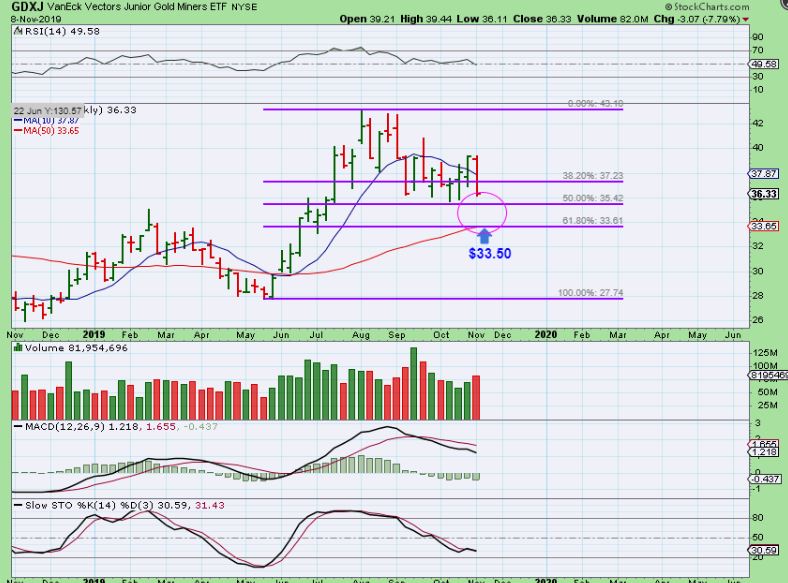
GDXJ NEW CHART – GDXJ had a heavy weekly reversal after making new recent highs and breaking above that weekly 10 ma. What a head fake. So after an 8% drop last week ( WOW!, that is 22% for JNUG), $33.50 is very possible on GDXJ, since the 62% Fib is there, along with the 50 week ma. We could see that as soon as next week really. GDXJ already tagged the 50% fib area.
.
Sudden reversals this week had the GDXJ, which was closing over its 50sma for 3 days, crash. It fell 8% and that is 22% on JNUG. THIS IS WHY I USE STOPS. Things looked fine, and suddenly you need to exit positions. Well, GOLD & SILVER are on day 28 for the daily cycle, so next week may lead to more downside, but it also could be coming to an end soon. That coming swing low should offer some good entry points, and that will be discussed in the week day reports.
.
For now, rest up & enjoy your weekend. Last week was a fast move and next week could be the final part of a drop for the precious metals sector. Enjoy your weekend and thanks for being here at Chartfreak.
.
~ALEX
.
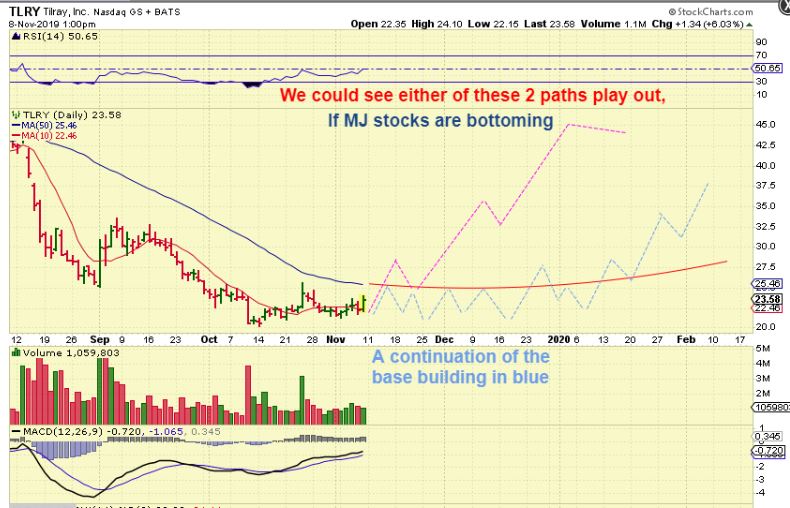
I just want to mention again that many MJ Stocks COULD BE BOTTOMING. You do NOT have to buy here, but if I mention it now, it gives everyone a ‘heads up’ as to what may be looking good down the road. These run SWIFTLY if they can get going and can be rewarding over time. So maybe 2 weeks from now they’ll have started a run & will be back testing their 50sma or bases, and then they’ll be set up for another low risk entry. So let me point out just a few possible bottoms in this sector…
,
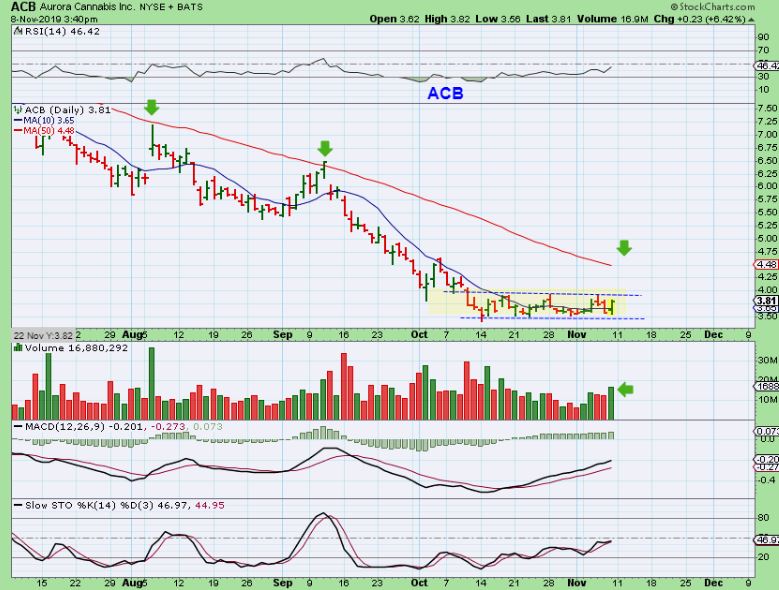
ACB – This looks like a little base and some nice volume started to come in on Friday. It is trying to trade above the 10sma for now.
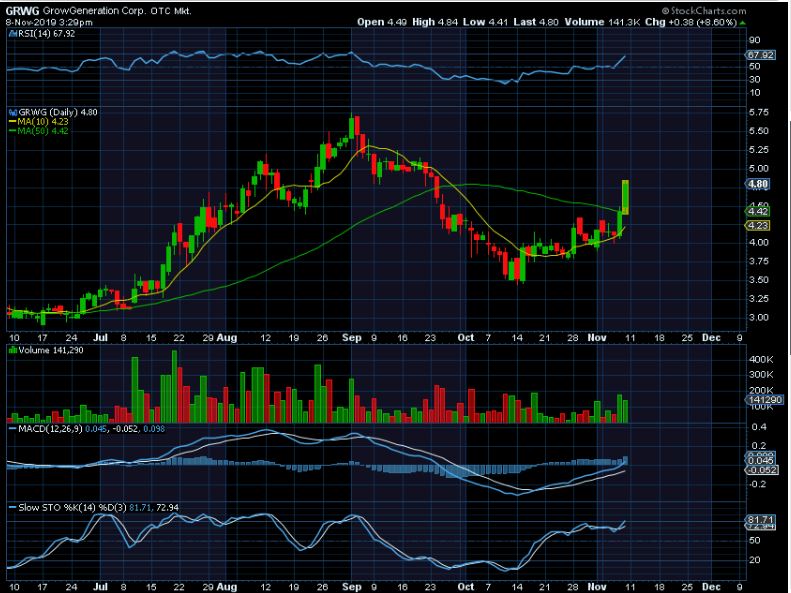
GRWG – GRWG looks like a leader. It already climbed up the 10sma and now burst through the 50sma. Great gains actually, when you look at the $3.50 to $4.80 . The weekly chart looks excellent too.
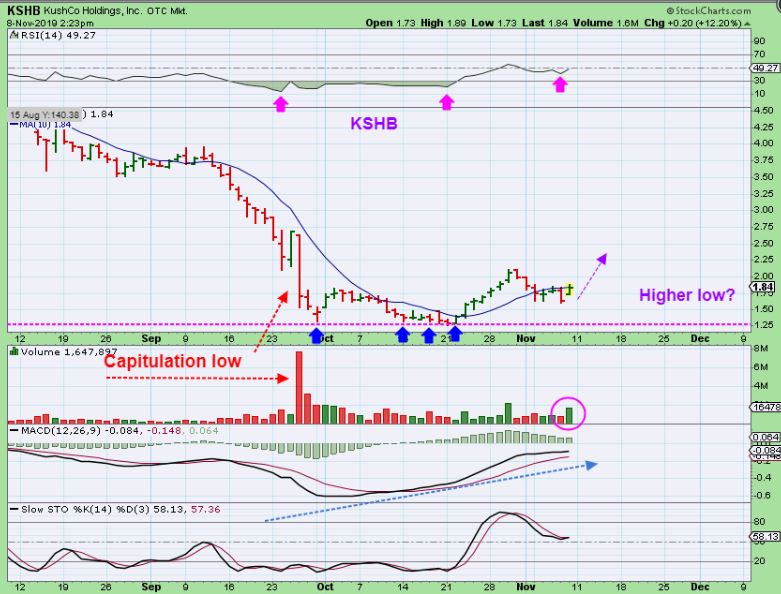
KSHB – KSHB released earnings this week and it has put in a higher low. Volume started to rise as it tries to get above the 10sma. It actually closed with 2.2 Million.
TLRY – So I drew this to show that these may be bottoming, but that process may or may not be finished for some. GRWG obviously is running now, but this shows how some that are basing ( TLRY, ACB, etc) can either break out now like this magenta line, or it can continue to churn and drive people crazy . So you can buy a little starter now with a stop under recent lows, but you also don’t have to buy now. I am giving a heads up to be able to update you later too.