Oct 31st – Post Fed
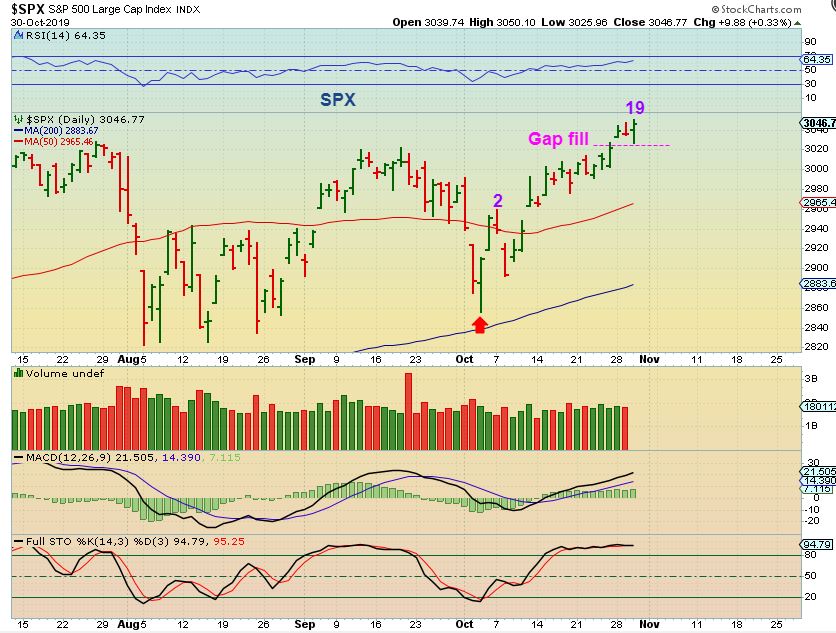
SPX – The General Markets sold off, and recovered after the Fed Decision. That gave us a new high on day 19, possibly making this a R.T. Daily Cycle.
.
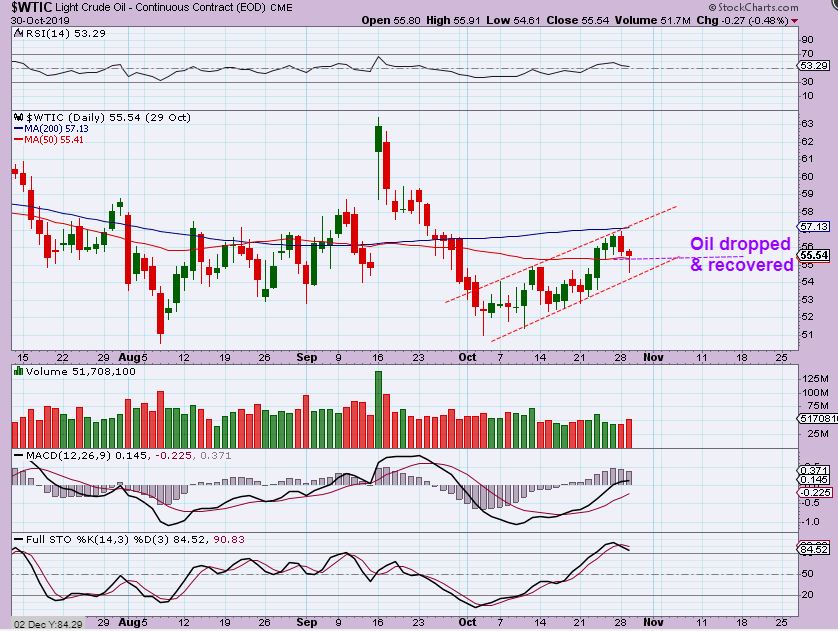
WTIC – Oil dropped heading into the Oil Inventory report, and then reversed higher into the end of the day. We have a reversal candle, but even though Oil saved itself into the end of the day…
.
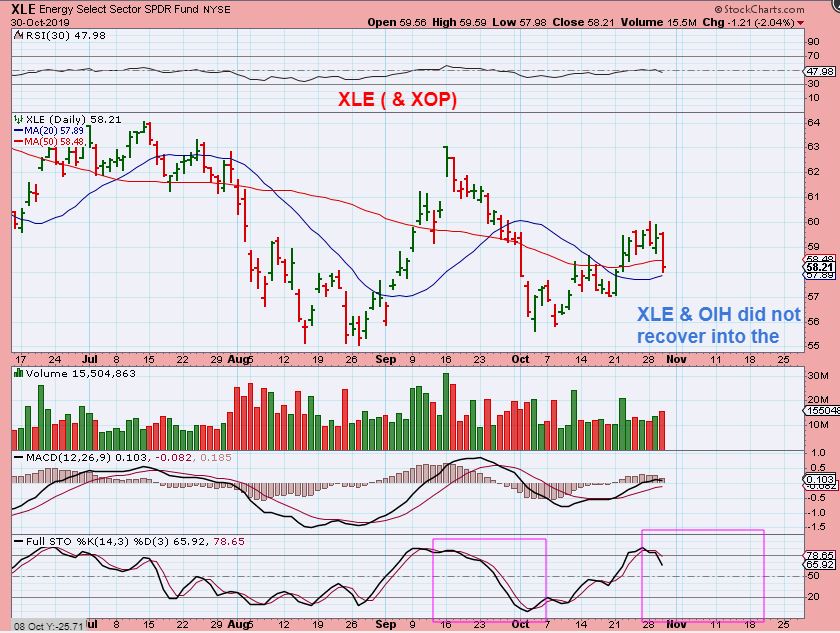
XOP – The Oil / Energy Stocks represented by XLE, XOP, OIH, did NOT recover. In fact, the OIH closed under the 50sma, so I’d be cautious here if you are long. This has been a very choppy sector.
We have been having a mixed set up in the Precious metals sector, with several Miners acting very bullishly, but a confusing Cycle count when an ICL drop was due. Did the Fed Decision clear that up? Not exactly. 🙁
.
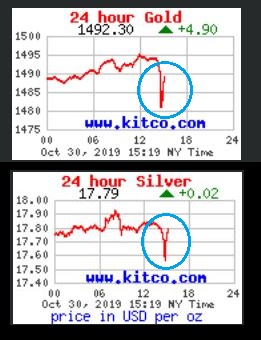
GOLD – After the Fed Mtg released the decision, Gold dropped quickly, but then it started to recover as Fed chairman Powell spoke, so I captured this reversal candle & posted it. Some Miners started to recover too, but some never went red.
.
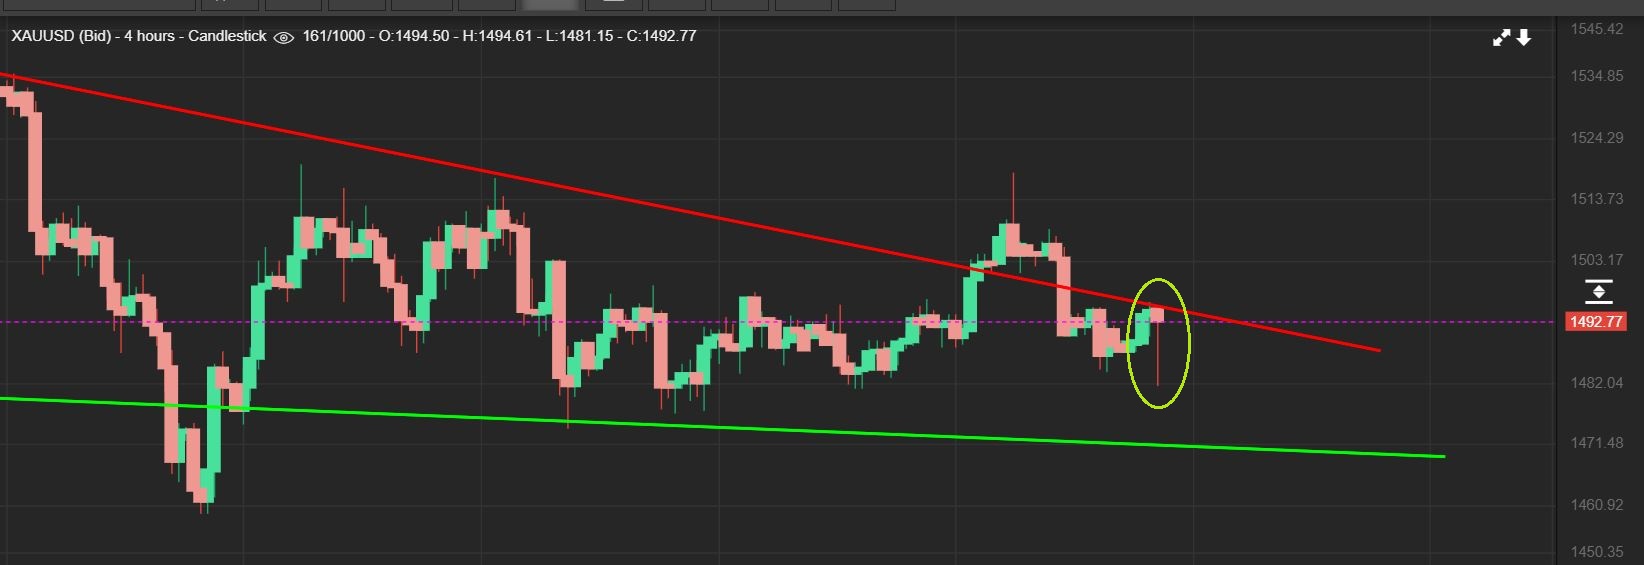
GOLD – By the final trading hour, Gold was recovering from that drop. THIS REVERSAL CANDLE LOOK LIKE THEY COULDN’T PUSH IT DOWN, AND IT WANTS TO BREAK OUT.
.
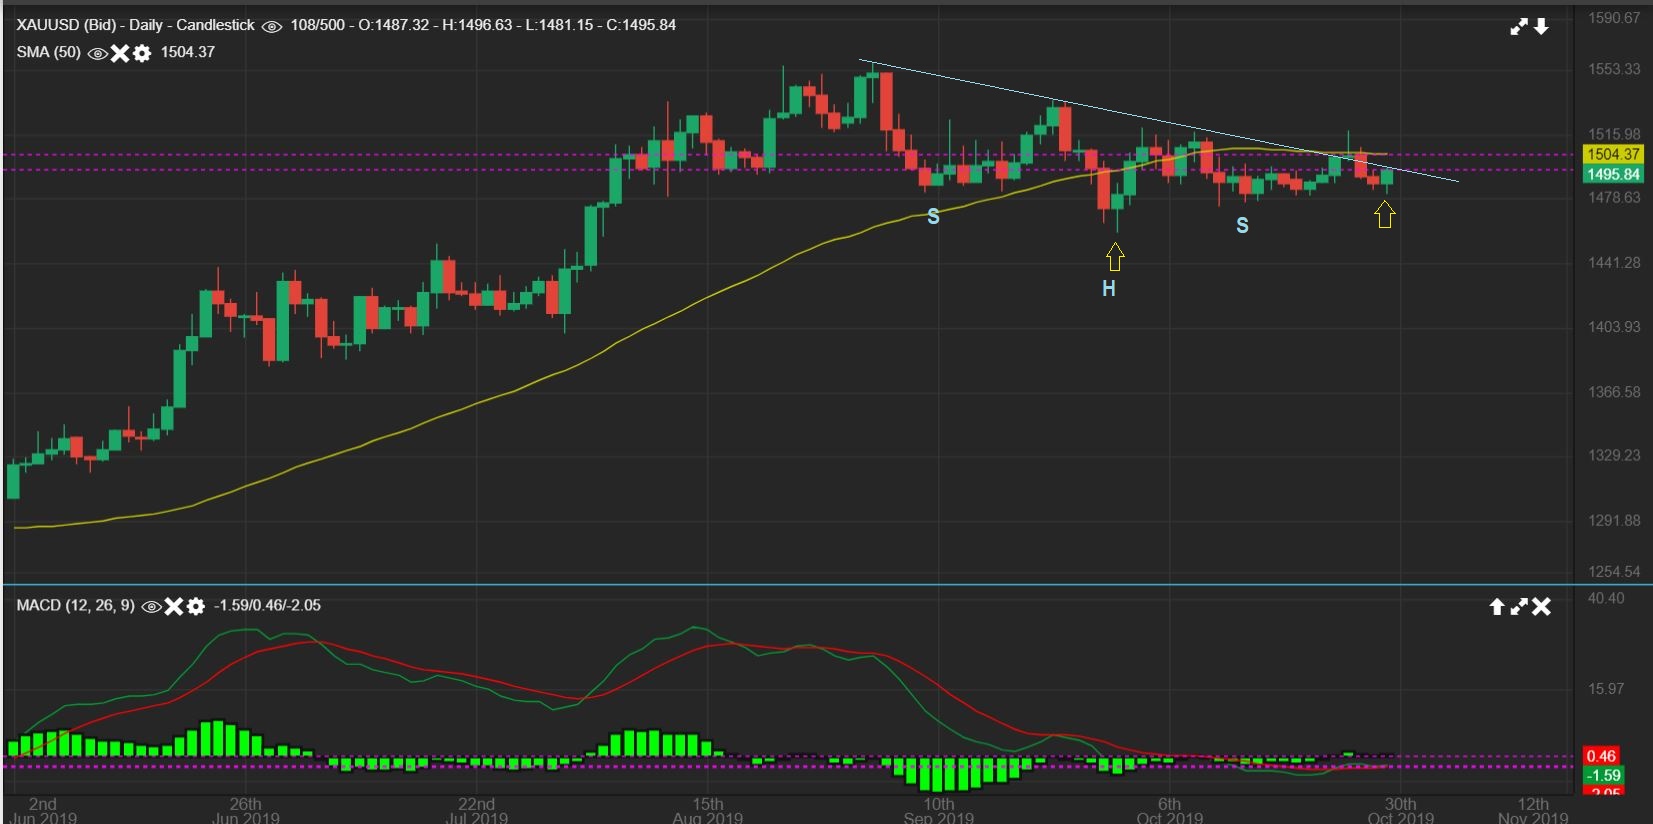
GOLD – By the close Gold had this daily candle and that possible inverse H&S is still in place.
.
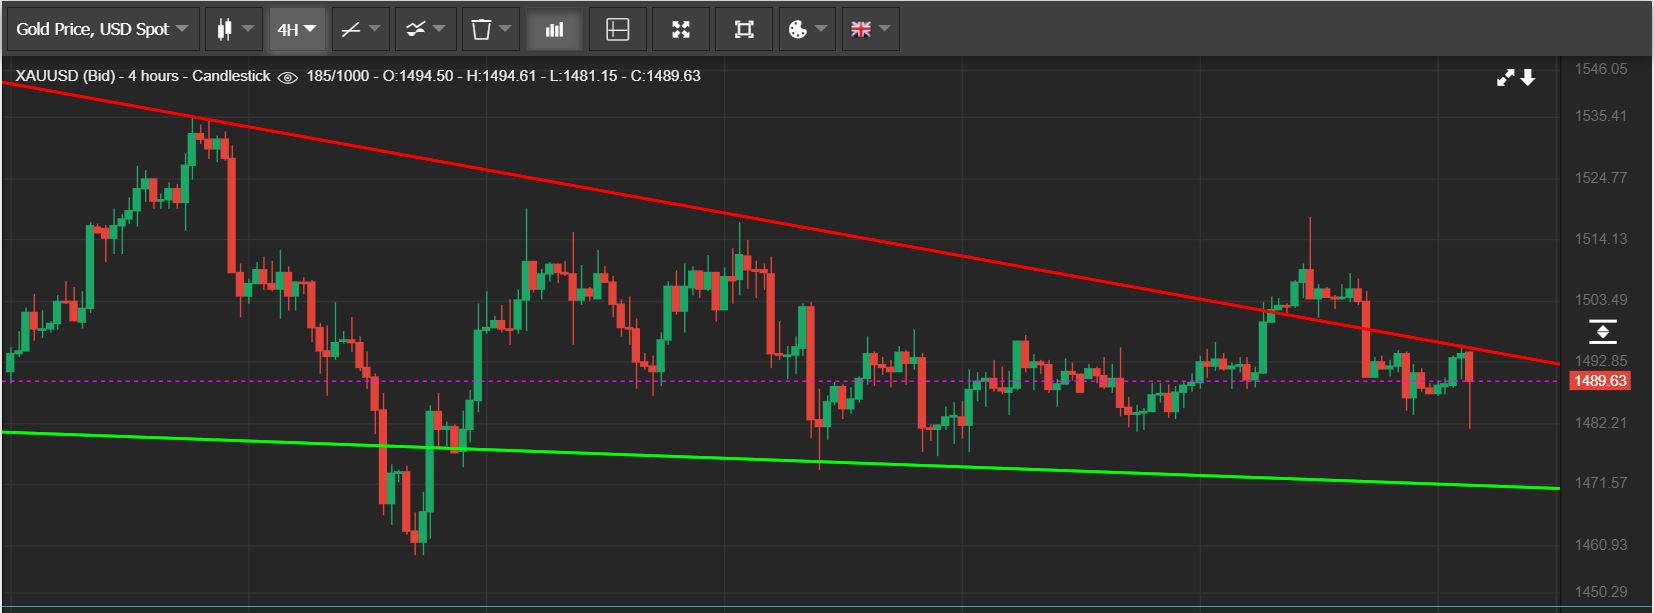
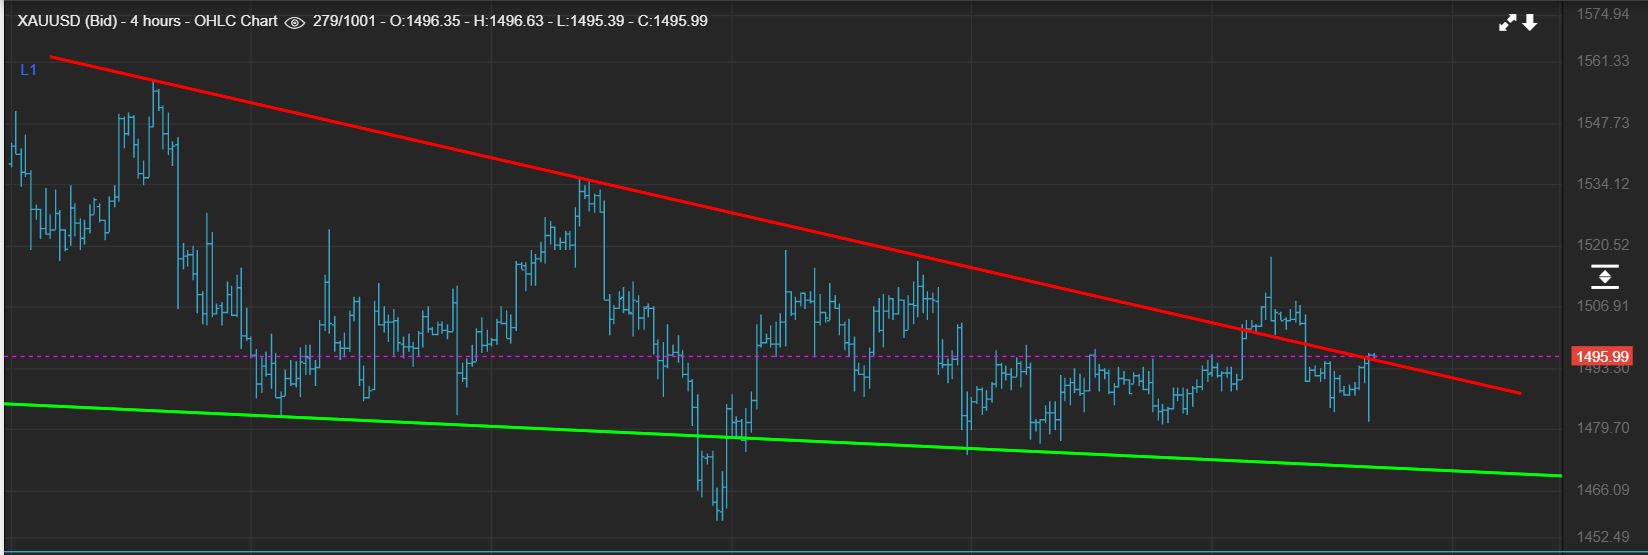
GOLD – I have been showing this 4 hr chart with the upper and lower support / resistance. When Gold moved higher, it slightly broke that upper line again. We’ll have to see if we have a Post Fed break out or dip down from here.
.
GOLD & SILVER at 3 p.m., a return to green, so the knee jerk reaction was a sharp drop, and then it reversed. That may have stopped out some Bulls, or even invited some bears to increase their short positions. Those shorts may have to close Thursday if Gold breaks out.
.
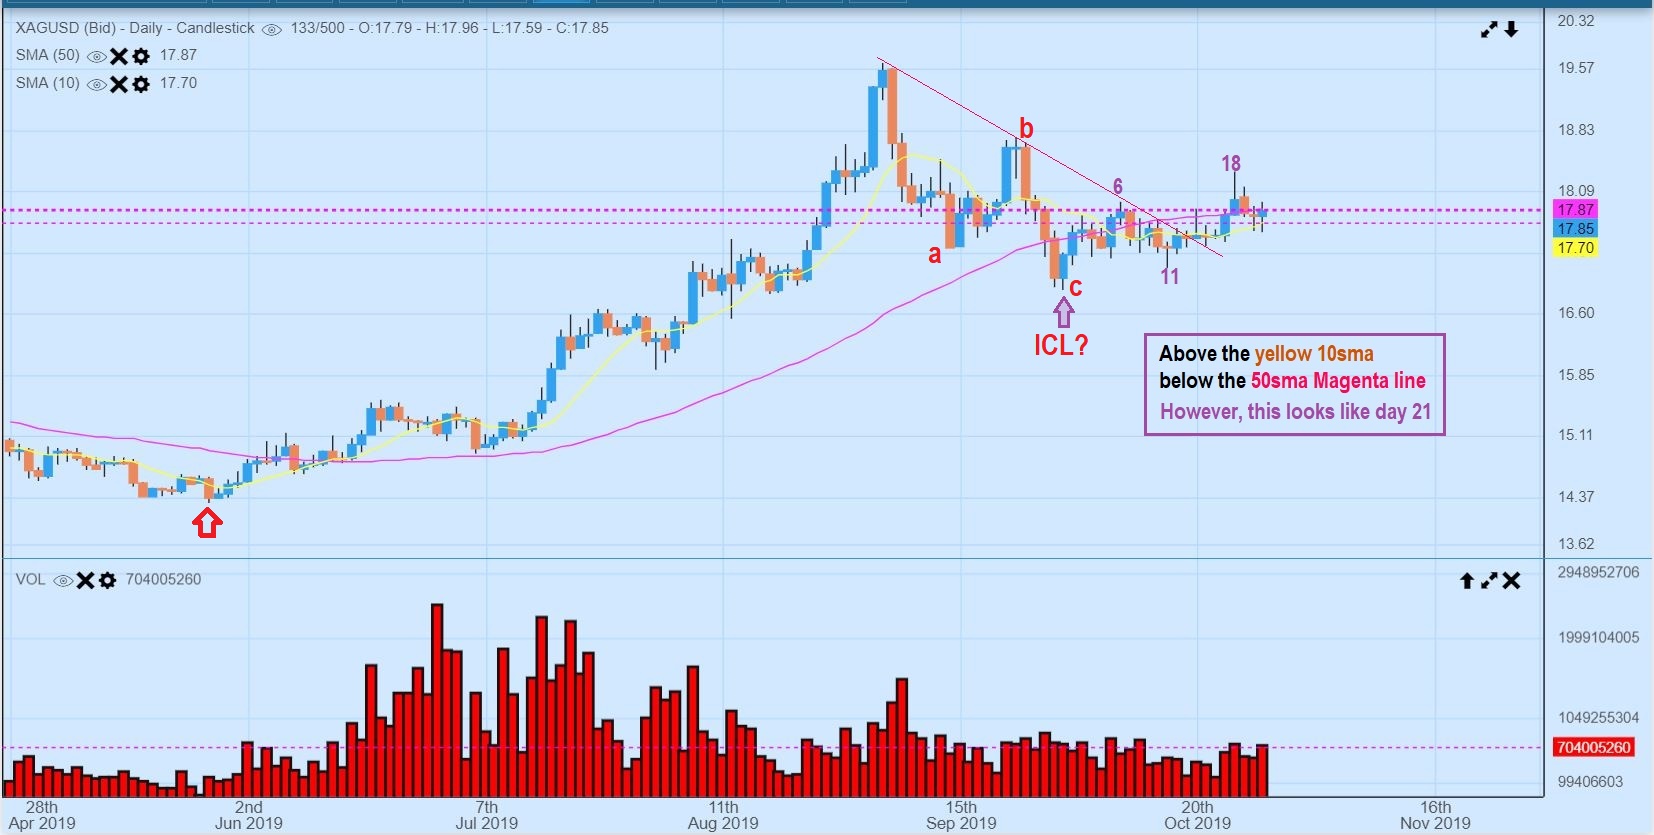
SILVER – Looking at Silver, it looks completely different. It also dipped & recovered and is parked right between the 10sma & 50 sma, so it too will either break out higher ( Above the 50 sma) or break down lower (below the 10 sma) . Honestly?…

.
SILVER : Honestly? Silver just simply looks like a steep a-b-c drop to an ICL more than Gold or the Miners do. That was only 4 month, but we have seen a 4 month ICL to ICL.
.
GDX – Miners dropped to the downtrend line & reversed just like the day before. I like the MACD & RSI, ignore the volume, I captured this before they added about 23 million more in volume. This is a Bullish Set up.
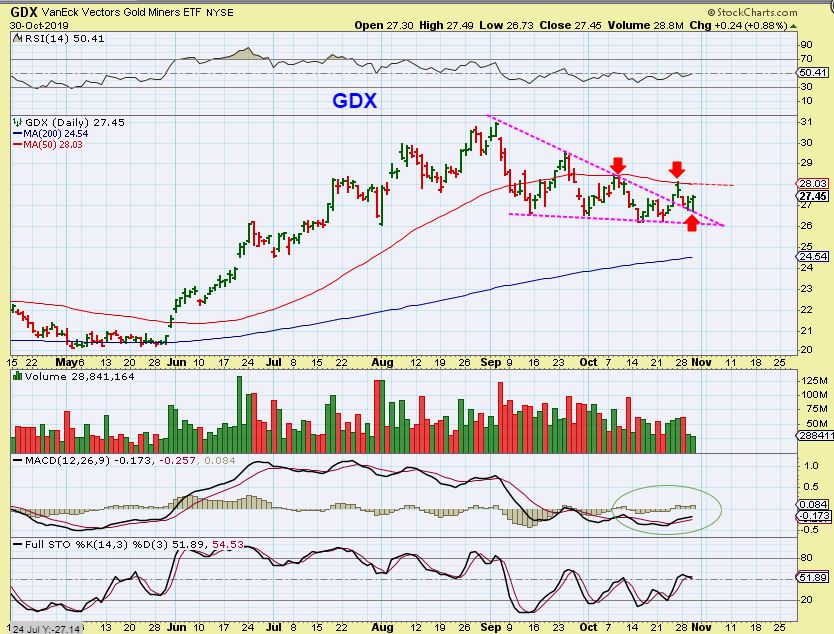
Yesterday I ran through several Bullish looking Miners, and I am going to do that again here.
.
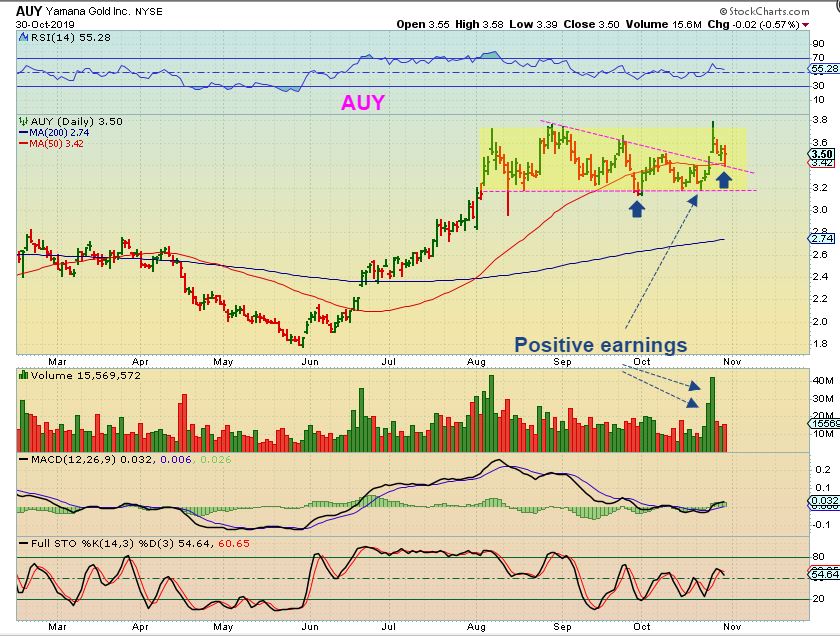
AUY – AUY had earnings that were met with a break out to new highs. Now it dipped down, back tested that 50 sma & trend line triangle & reversed Thursday. This could have been bought with a tight stop, and still can be.
.
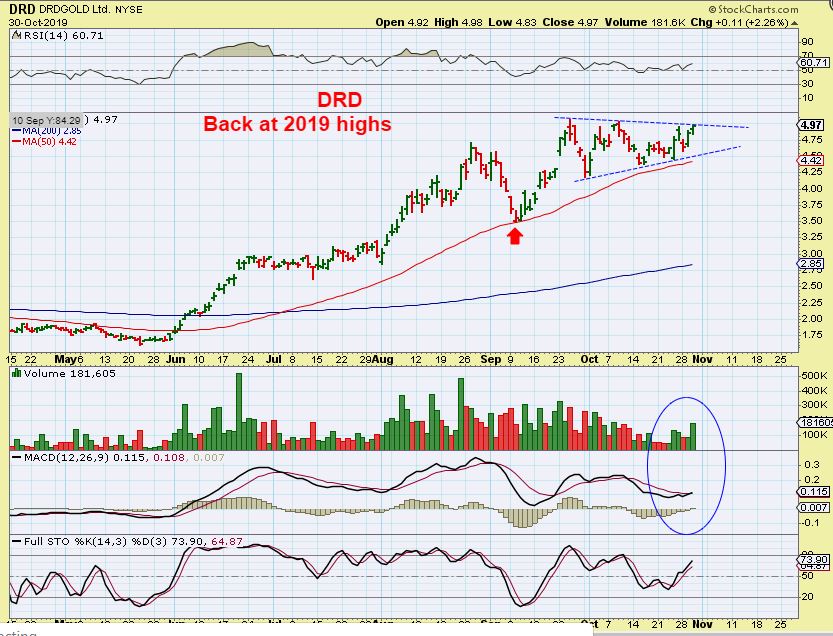
DRD – I added to my DRD because it has not dropped very much Since September, it has formed higher lows and a continuation triangle. It is back at 2019 highs.
.
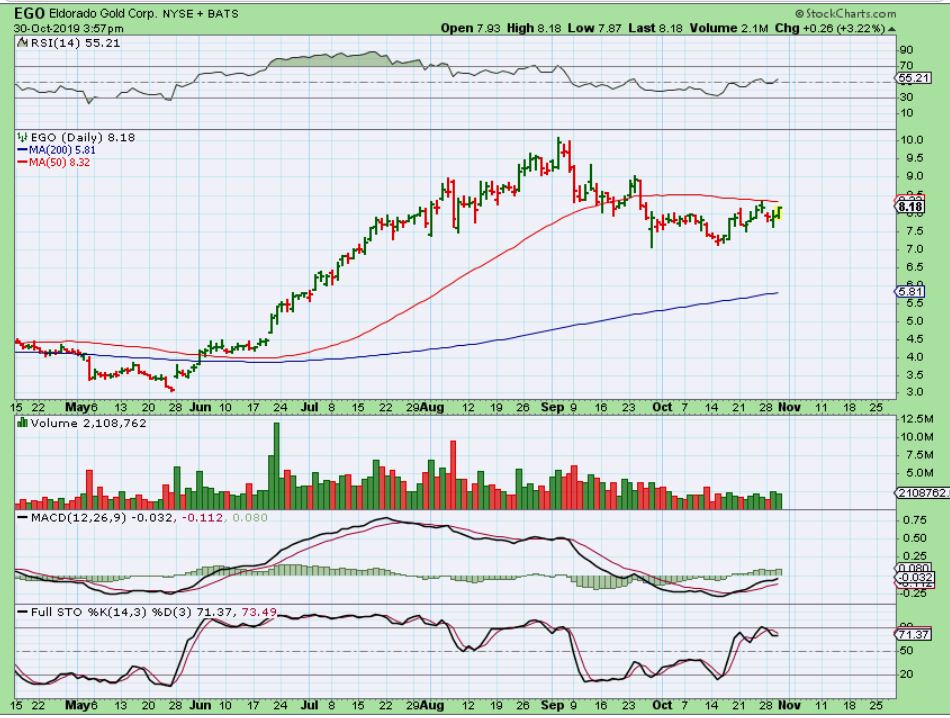
EGO – EGO could be bought here a bit early, or when it breaks the 50 sma. This is a bullish set up and should break out if Gold breaks higher. The MACD & RSI are rising while price chopped sideways.
.
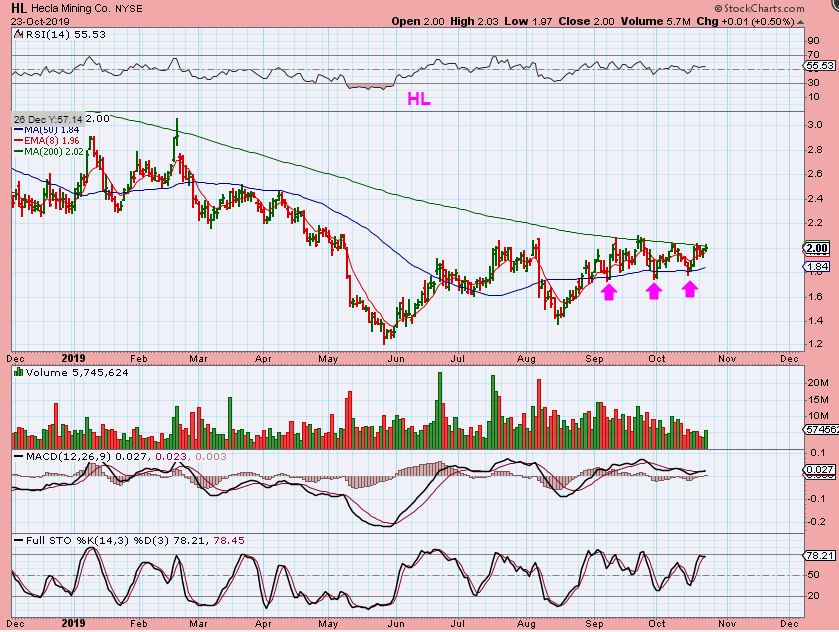
HL OCT 23 – I ended up buying HL during this pinch or ‘crawl’ between the moving averages.
.
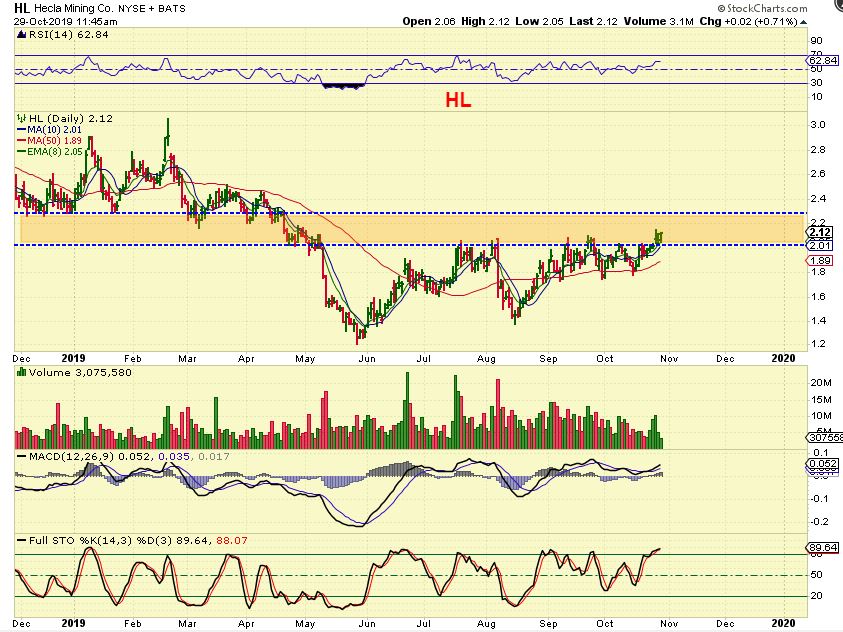
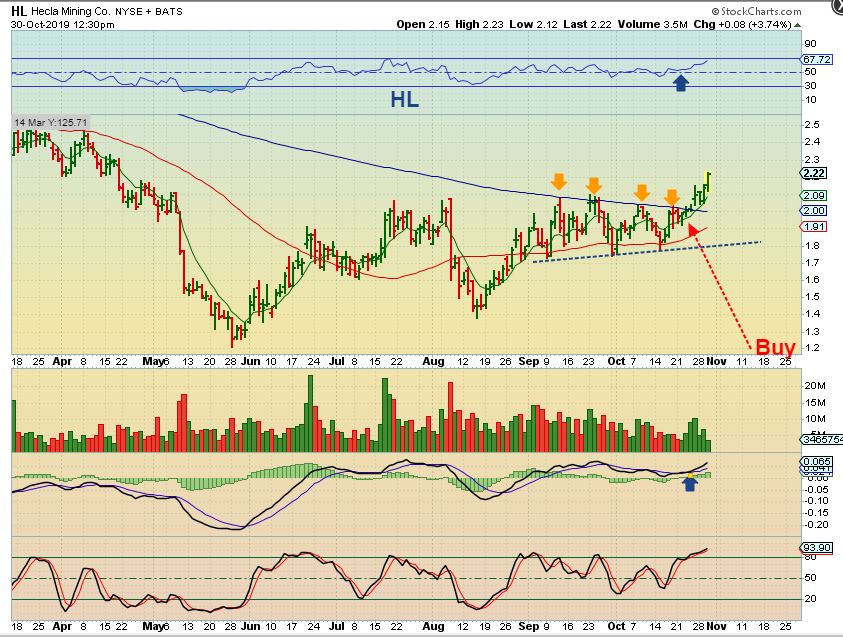
HL OCT 29 – In yesterdays report I showed the break out that should now be support. If the Fed doesn’t hurt it, this could run nicely.
.
HL – I added, because HL was one of the miners that STAYED GREEN all day Wednesday. It dipped down, but the selling was weak and it never went red, so I bought more. It looks ready to just continue higher.
.
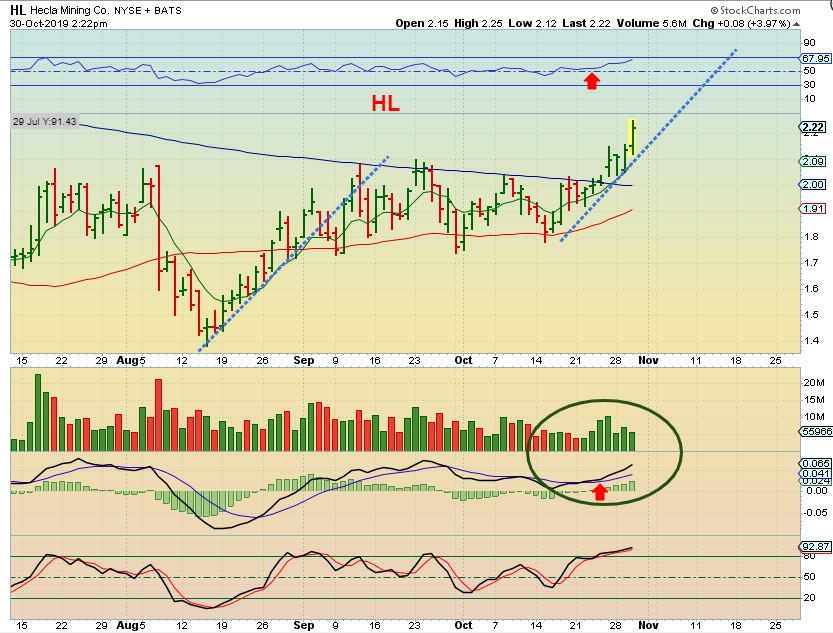
HL – A normal price extension would be something like this, but it will run further if this sector rallies.
.
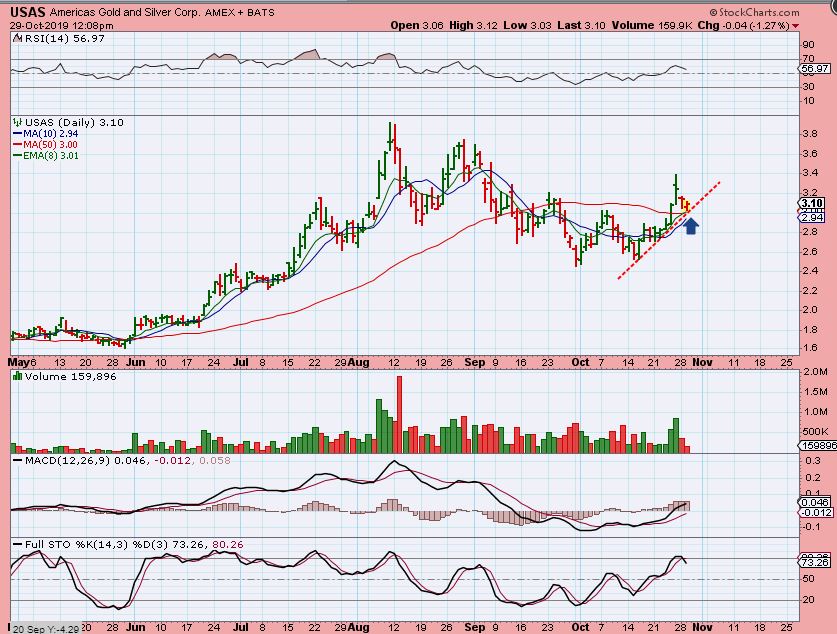
USAS FROM YESTERDAY – USAS broke above the 50 sma, and has still held up above that area too. WHAT HAPPENED AFTER THE FED?
USAS – USAS dropped 11 cents , tagged the 50sma, and reversed again, losing up 3 cents for the day. 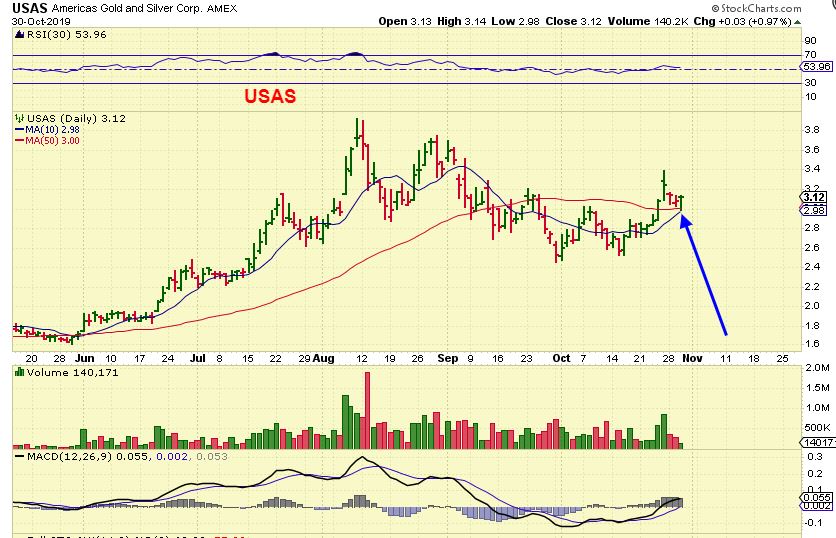
.
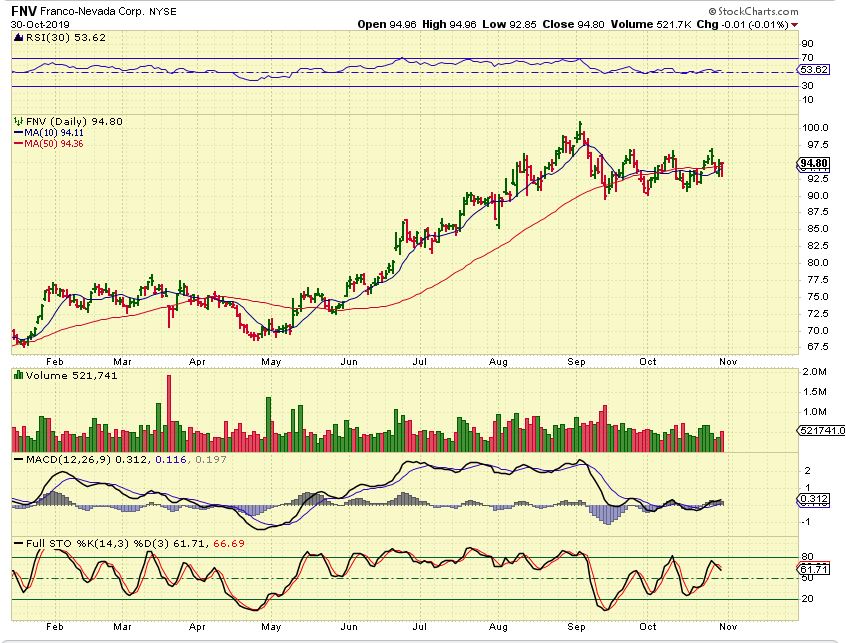
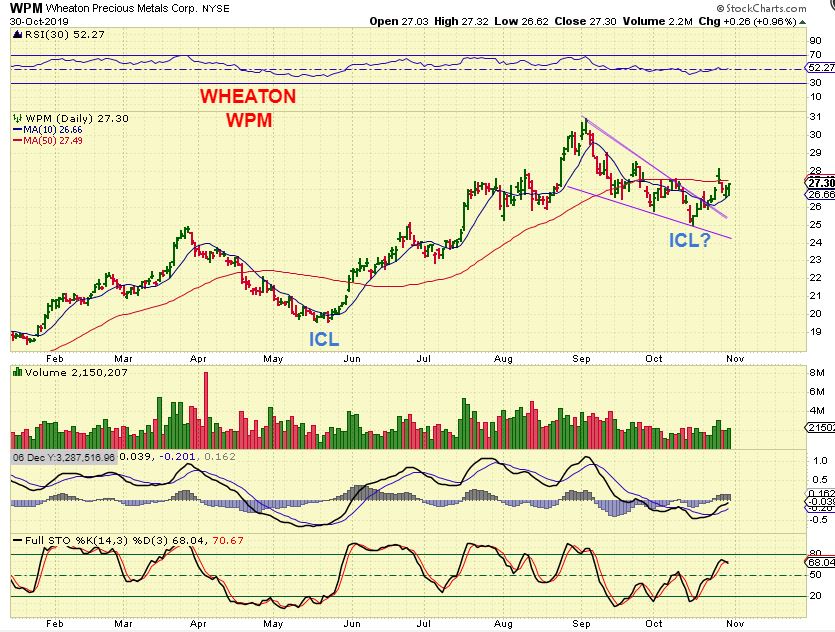
LONG TERM INVESTORS MAY LIKE FNV, WPM, AEM, AU, etc.
.
FNV – This one is holding up VERY WELL, no big sell off here.
WPM – This has been a Sept 1 to Mid October drop, now starting to form a cup of its own. This has run well during the bull runs.
.
So we see that many of the miners mentioned in yesterdays report and other reports acted bullishly again by the close.
The Rate Cut saw Gold sell off as Chairman Powell was speaking, saying that inflation is not a threat. Then after the 2-3 p.m. hr, the Precious metals sellers were apparently overwhelmed by buyers. Thursday will be a day when we can look for further conviction or follow through to the reversals in both the General Markets and Precious Metals, or not.
.
Enjoy your Thursday trading!
.
~ALEX
.
Just a few ideas that you can look at if the Markets look to be moving higher Thursday
.
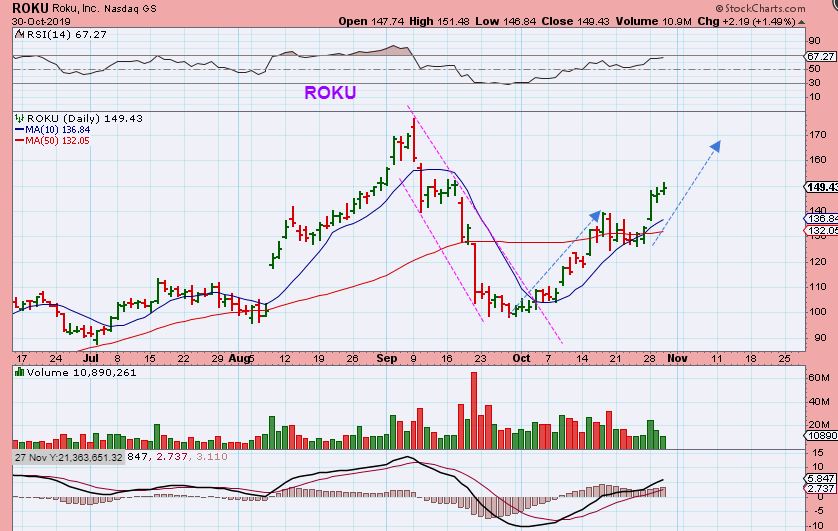
ROKU – Roku’s bull flag is continuing.
.
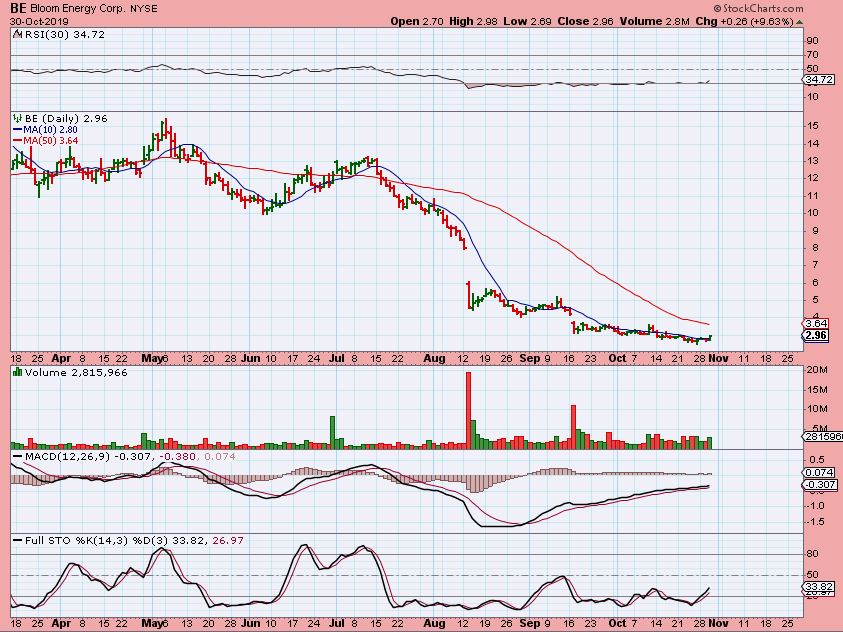
Funny story. With The Boeing CEO testifying, I wanted to see how the Boeing stock was doing. I accidentally looked up BE instead and I actually loved the chart, so here it is…
.
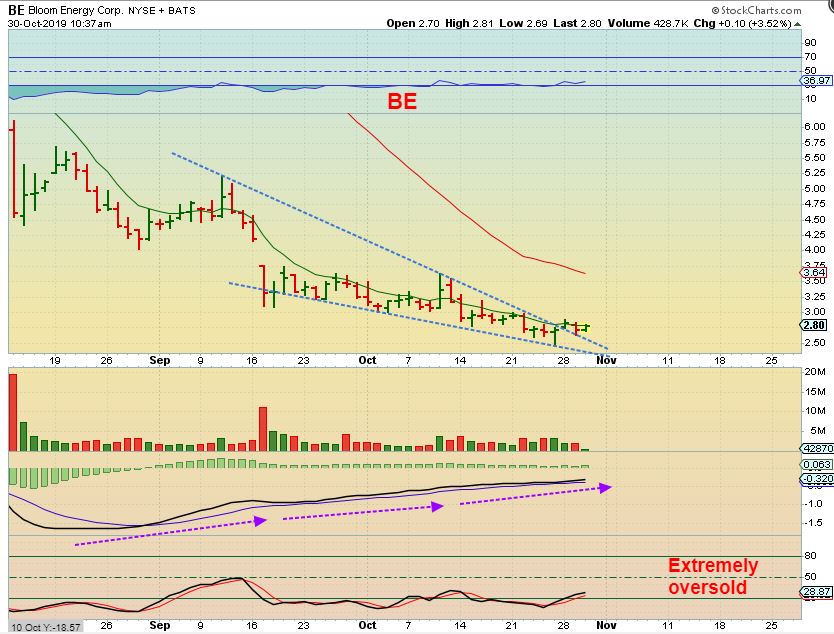
BE #1 – Extremely oversold, MACD rising strongly, and breaking from a falling wedge. This could be a buy above that 10sma, and then it pushed above it Thursday. BE was $2.88 when I captured this chart, it closed at almost $3.00 on 3 million volume. Also …
,
Bloom Energy Corp. engages in the manufacture and installation of on-site distributed power generators. Its product, Bloom Energy Server, converts standard low-pressure natural gas or biogas into electricity through an electro-chemical process without combustion.
.
BE #2 – That MACD really stands out an the upside potential is big if it can recover. I’d do DUE DILIGENCE, Earnings are set for Nov 7, and earnings caused that Aug drop / gap down. High risk, maybe wait until after earnings?
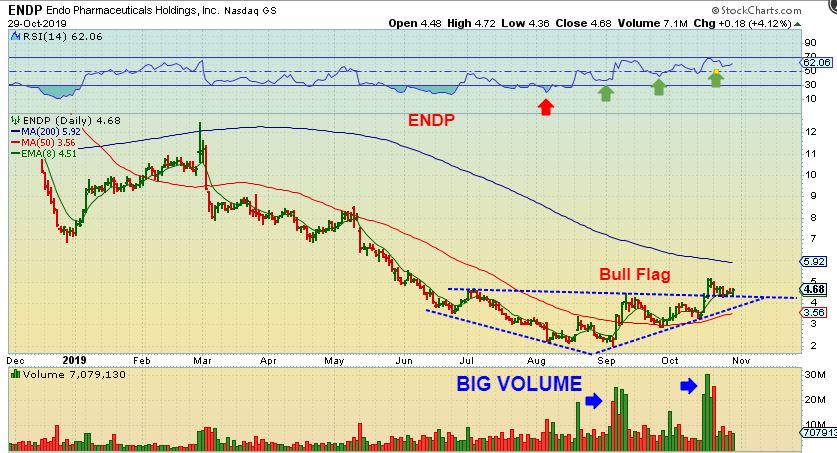
ENDP – ENDP is in my Pharma list and I saw it POP in September on BIG Volume, and that doubled the price from $2 to $4. It has now consolidated and took off again with Big Volume. Now it is flagging. It just looks bullish and may continue to climb back up to prior rice levels. A huge move from the $2 lows, a great move from here too. This is a BUY & HOLD candidate.
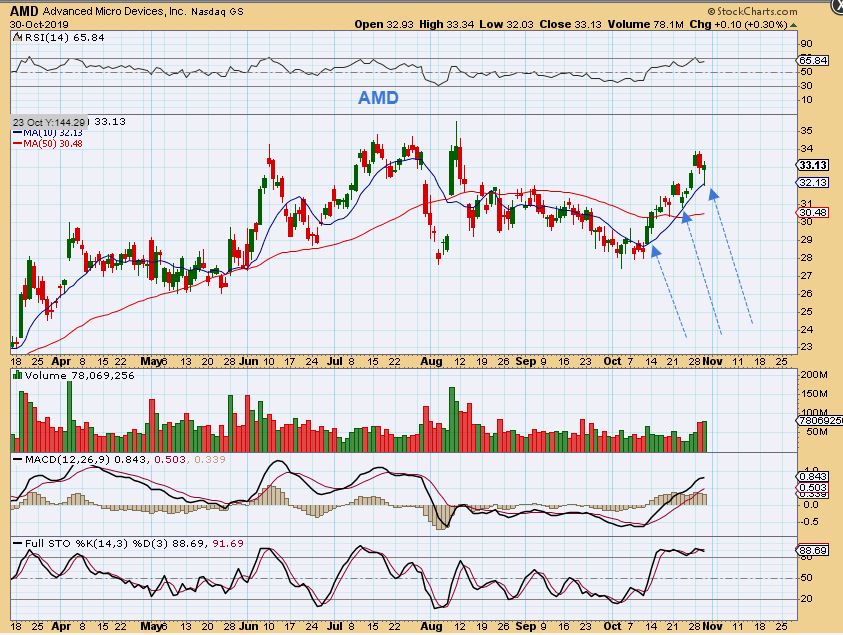
AMD – AMD bounced off of the 10sma and has just about completed the cup that I was expecting. NOW something else may be happening. THIS CUP…
.
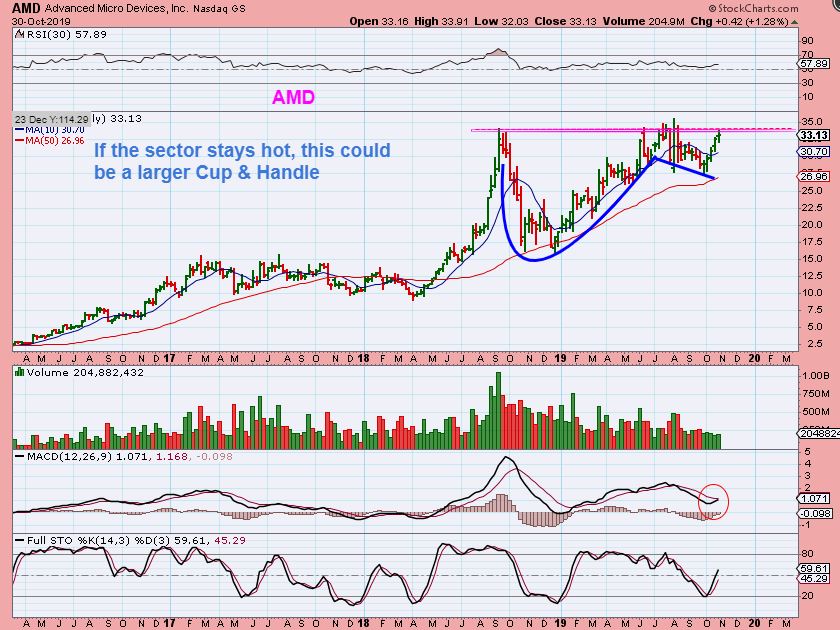
AMD WEEKLY– THAT CUP may simply be the handle of a larger weekly cup & handle, so if the sector stays hot ( Semiconductors) AMD can break to new highs and keep running….
.BY
By email request, do I like KIRK? I do…
.
KIRK #1 – I see a base that broke out & back tested, pushing the RSI to 70. Price is above the 10 & 50sma. That MACD has been rising through the flat chop of this base, and…
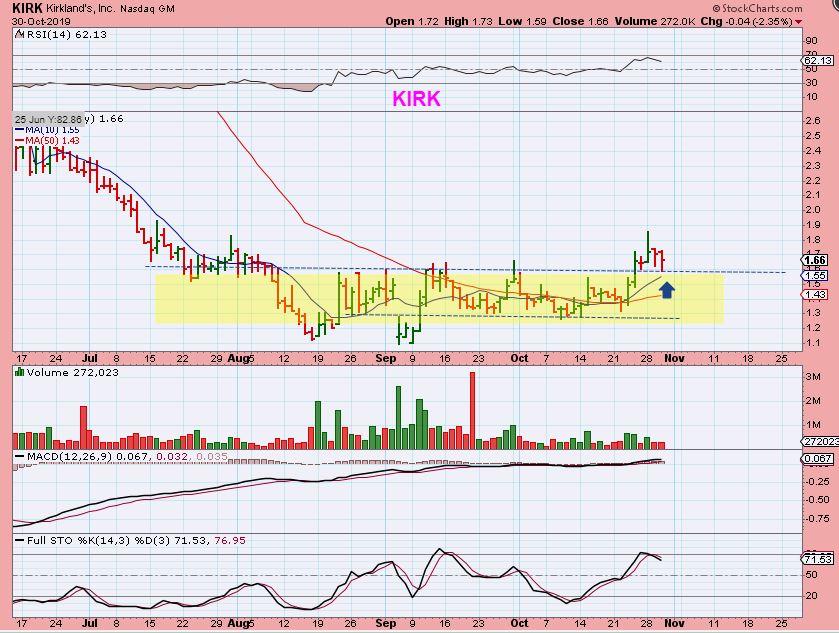
.
KIRK – We are landing on that 10sma now. This has been sideways for months, but it could start trending higher at any time. Let’s zoom out…
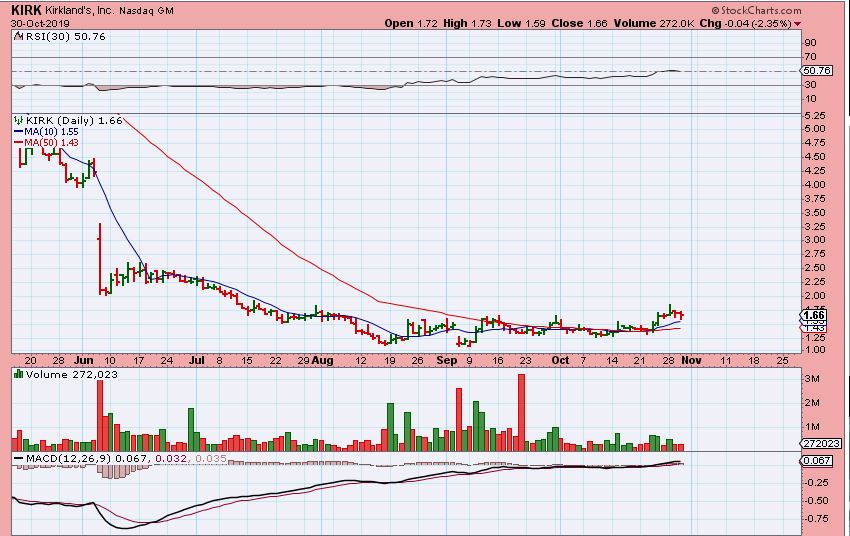
.
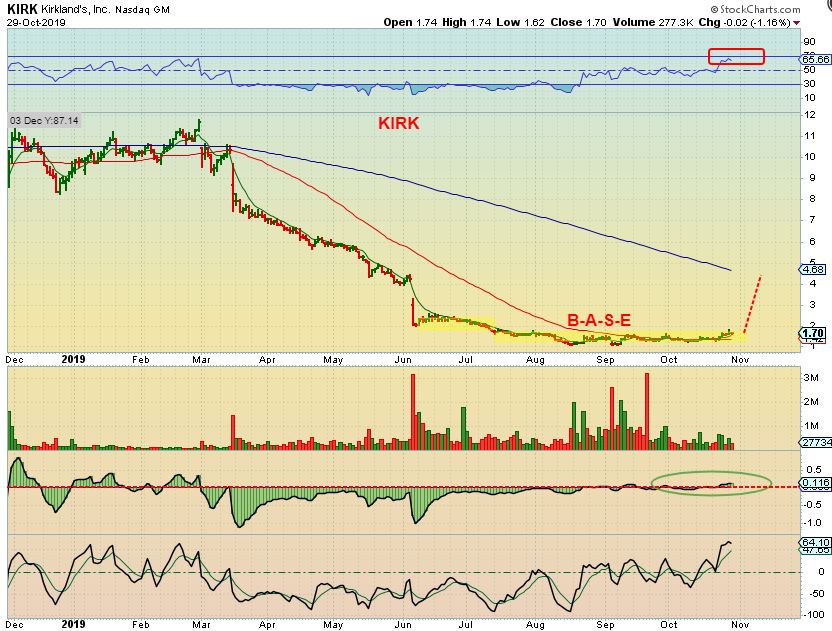
KIRK – This is really a Big Base, with many high volume Pops. It was a $10-$12 stock before dropping, but now it has based out. Currently under $2, this really could make nice gains for the patient one, but this too is a longer term BUY & HOLD.
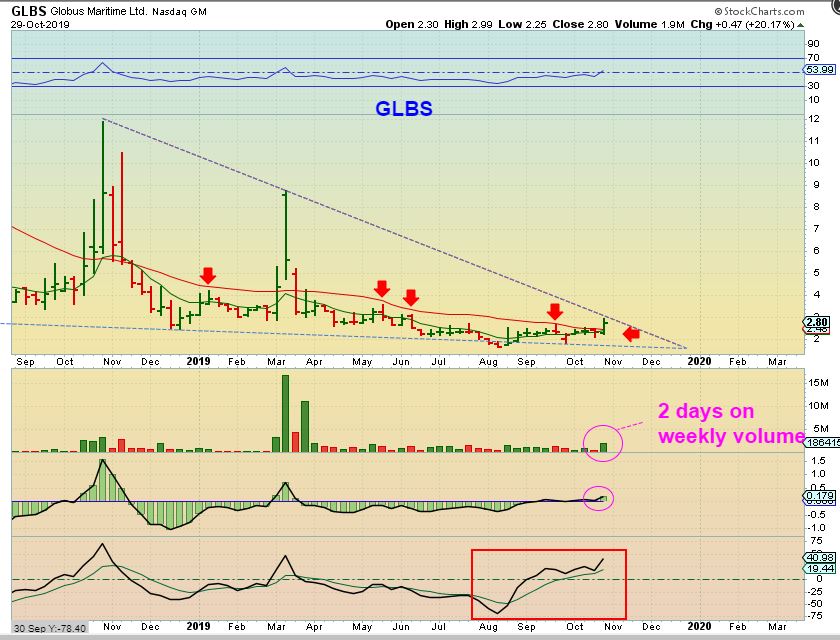
GLBS – I recently mentioned GLBS. It then popped to the 200sma and now we have 2 doji candles up near that 50sma. It can breakout, or it may BULL FLAG as drawn here, but another thing that I really liked was…
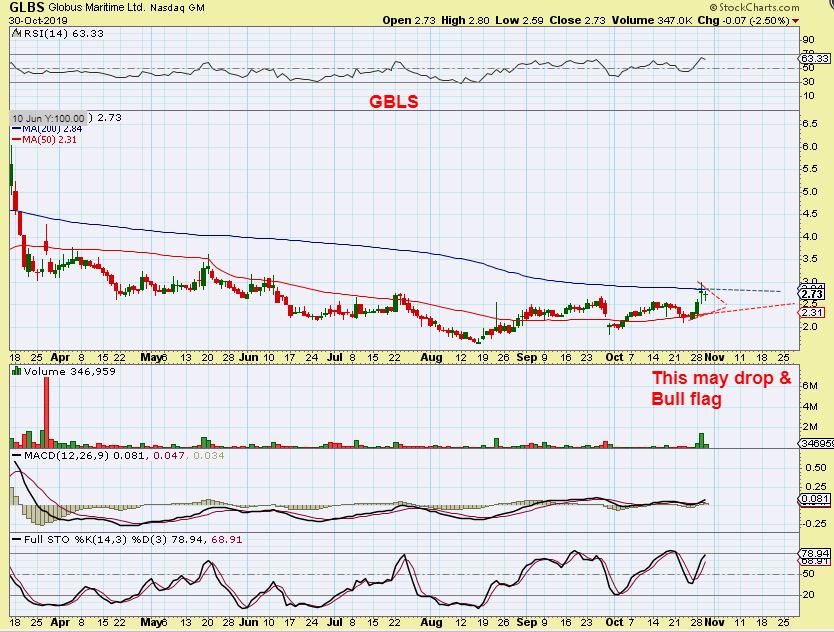
.
GLBS – I HAVE ALSO LIKED THE WEEKLY CHART. It is a long base and seems to want to push higher.