Weekend Oct 26th- Is It Time Yet?
I had to travel to a wedding in N.Y. this weekend, so I gathered my charts Friday night and for me to be able to get this report out by Saturday, I’ll need to be brief & to the point. I’ll make sure that what I am seeing is made very clear though.
.
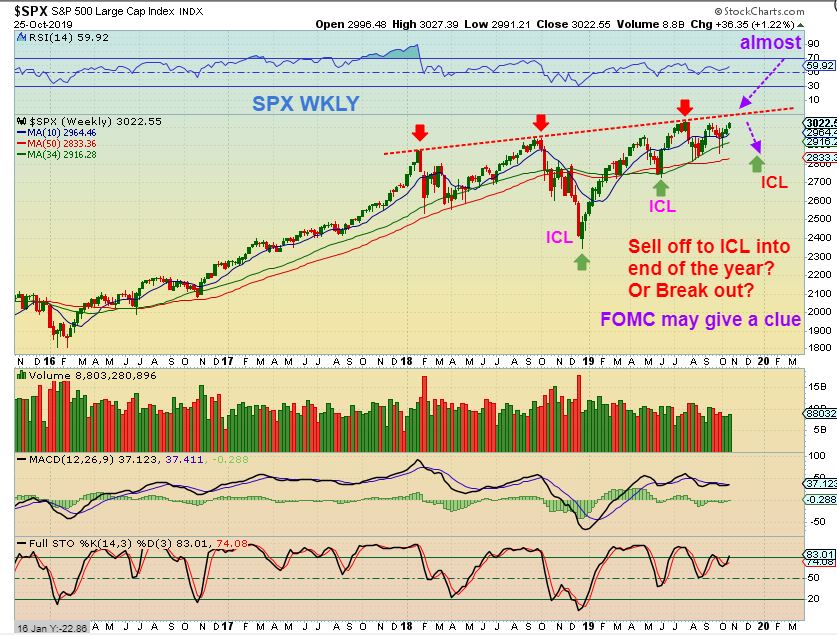
SPX WEEKLY – The SPX is approaching the area that I would be looking at as resistance. So far it has been running out of the DCL as expected, though it did get a little choppy on the drop back to the 10sma daily. This can continue higher into the fomc meeting. Read the chart.
.
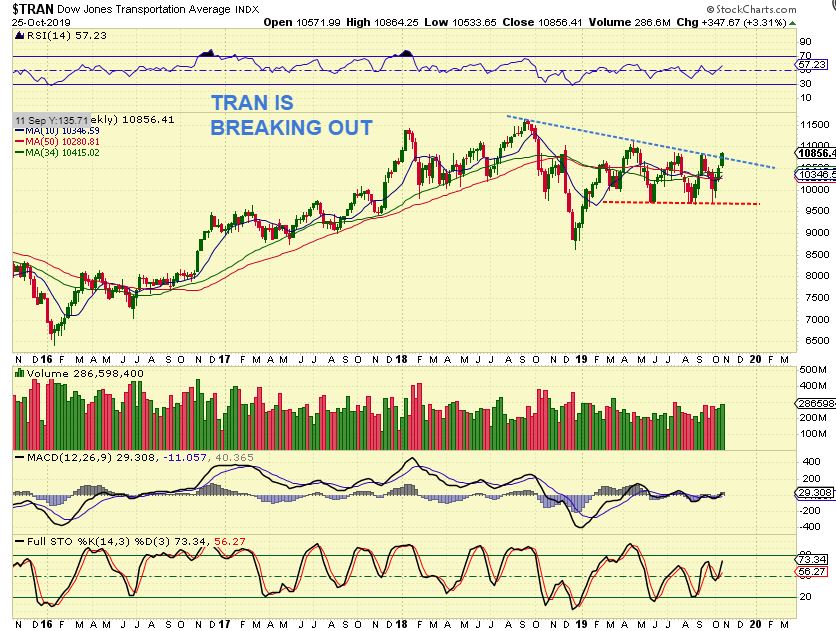
TRAN WEEKLY – I discussed this set up as possibly a bullish set up now finally ready to break out, and it has. The volume is good and THIS could now run to the former highs of 2018 ( 11500 area or beyond). It SEEMS LIKE the fomc mtg will be bullish for the markets so far.
.
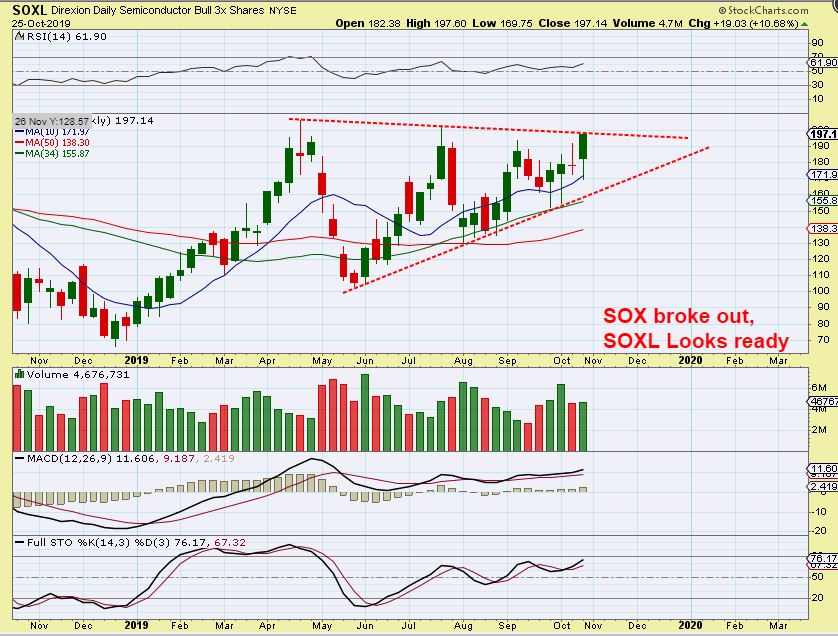
SOXL WEEKLY – The SOX broke out, SOXL is looking good too.
.
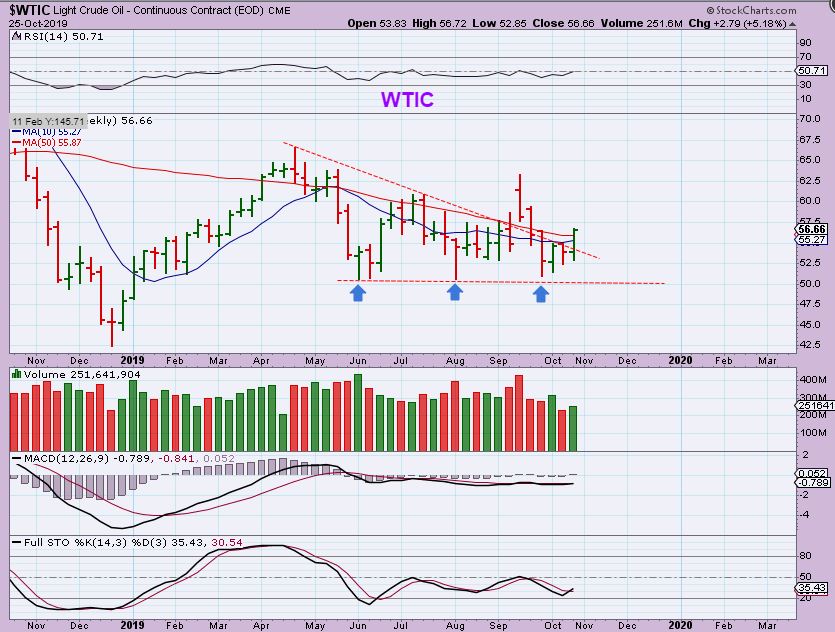
WTIC WEEKLY – Oil finally broke higher Friday, giving the weekly chart a bullish look too. The XOP trade ( Gush) also looks ready to continue higher.
.
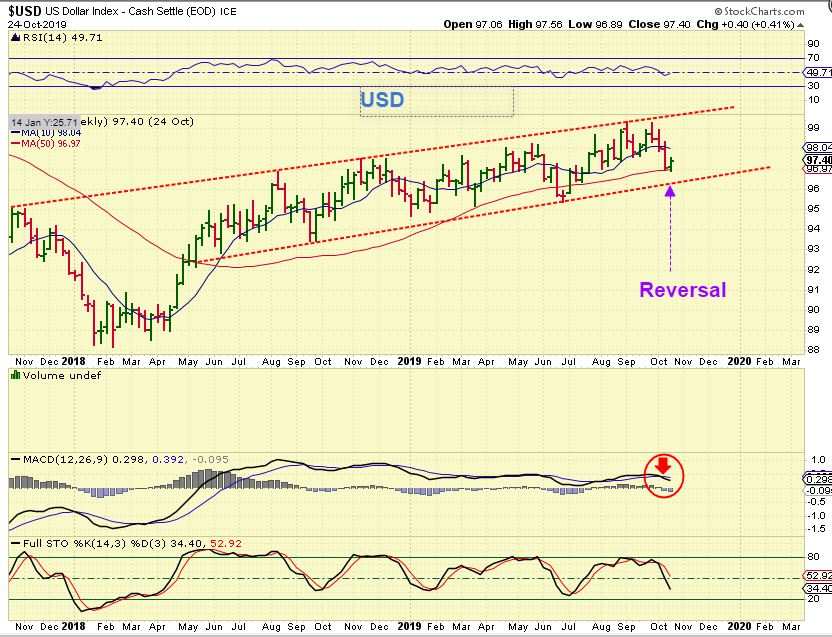
USD WEEKLY – The USD reversed at the 50 week MA, but that didn’t stop GOLD from popping. That inverse relationship is not in place at this time.
.
.
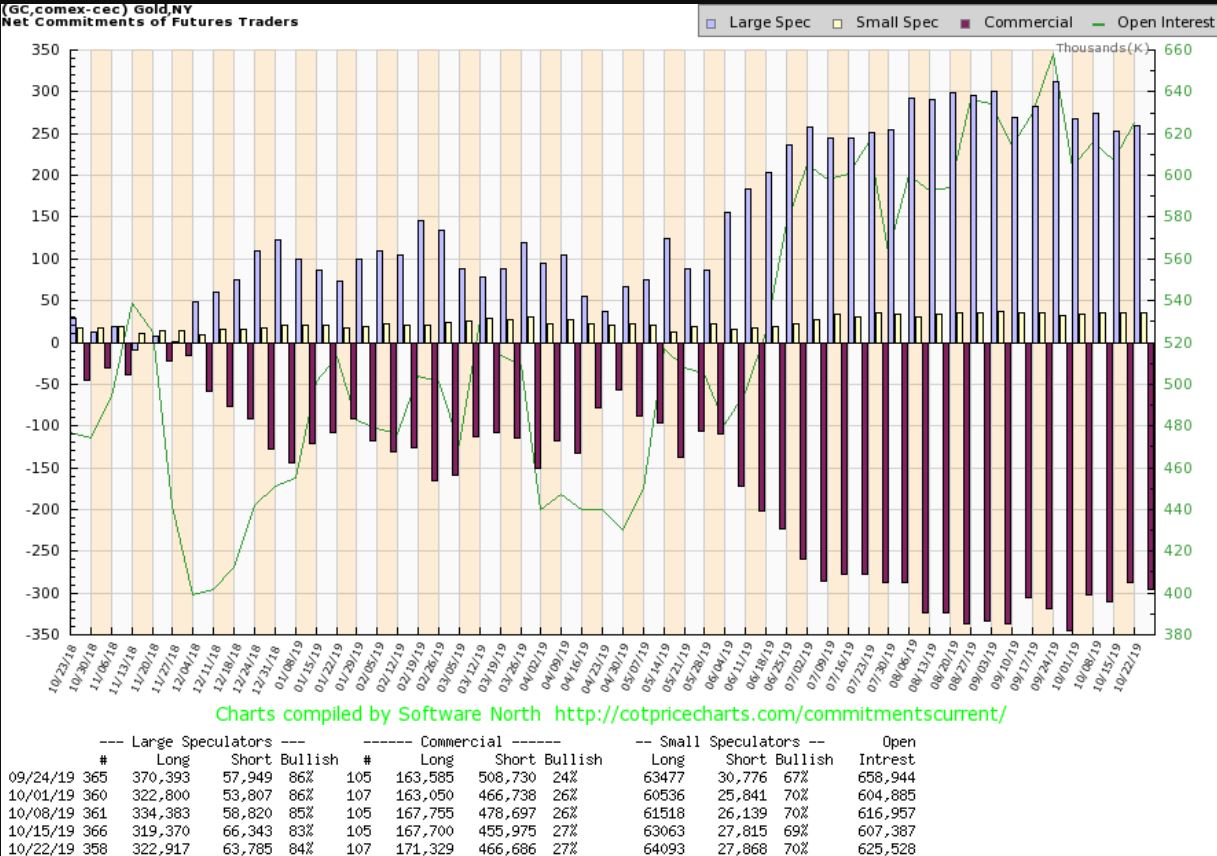
COT – The COT has seem some short covering over the last few weeks, no longer at peak levels.
.
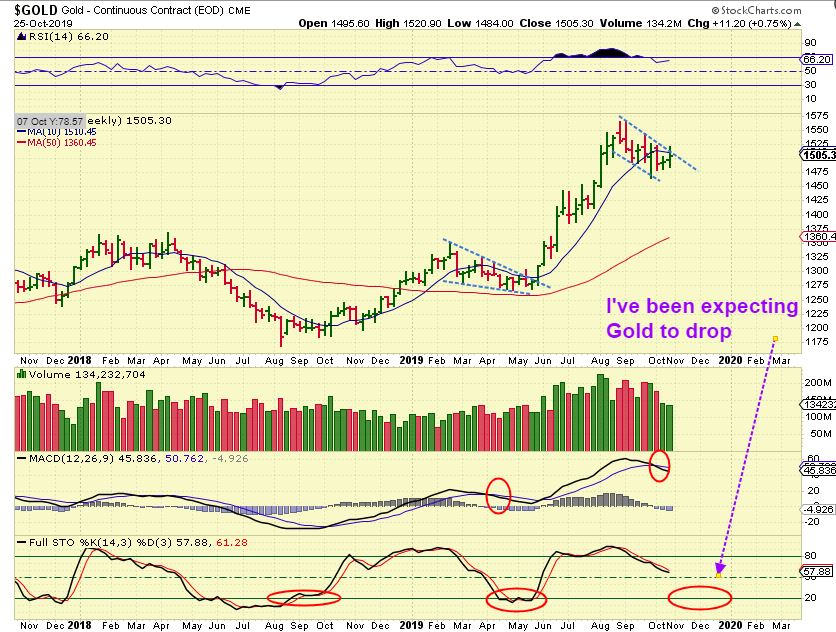
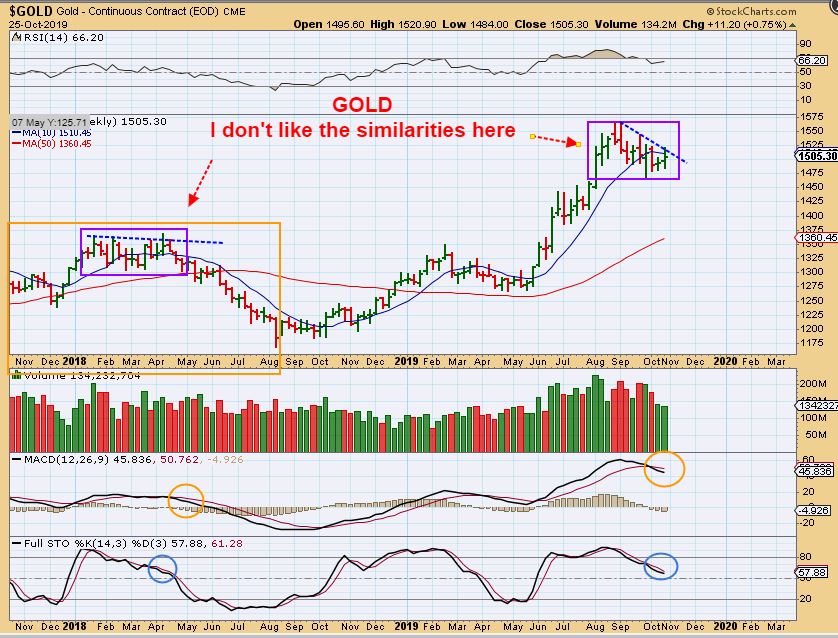
GOLD WEEKLY – Gold broke out Friday, but as you know, I have expected a deeper drop than just this for an ICL. Look at the stochastics compared to prior ICLs. I started buying the bullish set up in Miners last week, but I need to make sure that everyone knows, this may also simply be the start of a FINAL DAILY CYCLE, before rolling over & dropping into an ICL by Nov/Dec.
.
GOLD WEEKLY – I remember when the Early 2018 Precious Metals set up refused to sell off week after week too (purple box), and yet eventually it rolled over and sold off. Seeing that, I know that we need to use stops and be prepared for either scenario to play out ( A break out & run next week FOMC Style, or roll over & one more sell down). Look at my comparisons on this chart.
.
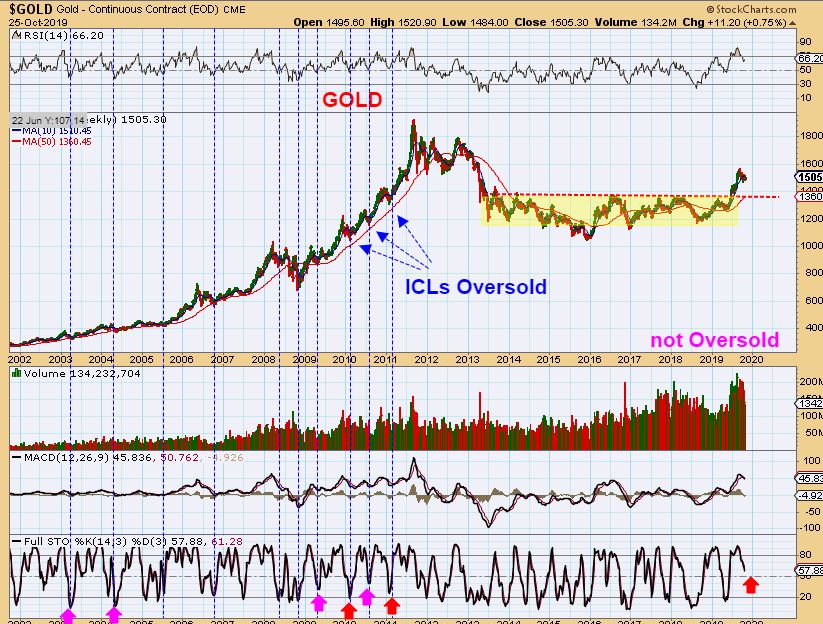
GOLD WEEKLY – In the real Bull Run of 2000-2011, ICLs were still good sized drops that reached oversold Stochastics . LOOK AT THE 50 WEEK MA & STOCHASTICS THEN & NOW. Let’s Stay Frosty here. Also a back test of that red line is normal if it were to happen, but not necessary.
.
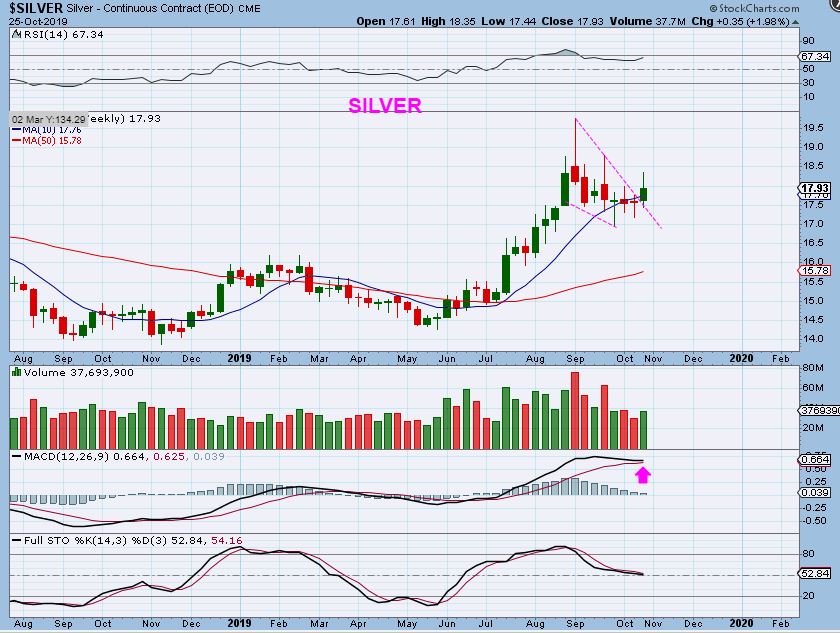
SILVER WEEKLY – Silver broke the down trend but couldn’t hold the gains into the close. Some would say that this is a reversal candle ( top), but at the start of a run, they can appear and just be a sign of indecision. Look at June & July 2019 & you’ll see a few, but we still went higher.
.
SILVER WEEKLY – You can also see that Silver actually bottomed at the end of May & now appears to have bottomed in September so far. That is only 4 months. That is very different from GOLD, but Silver stocks did sell off with Gold stocks.
.
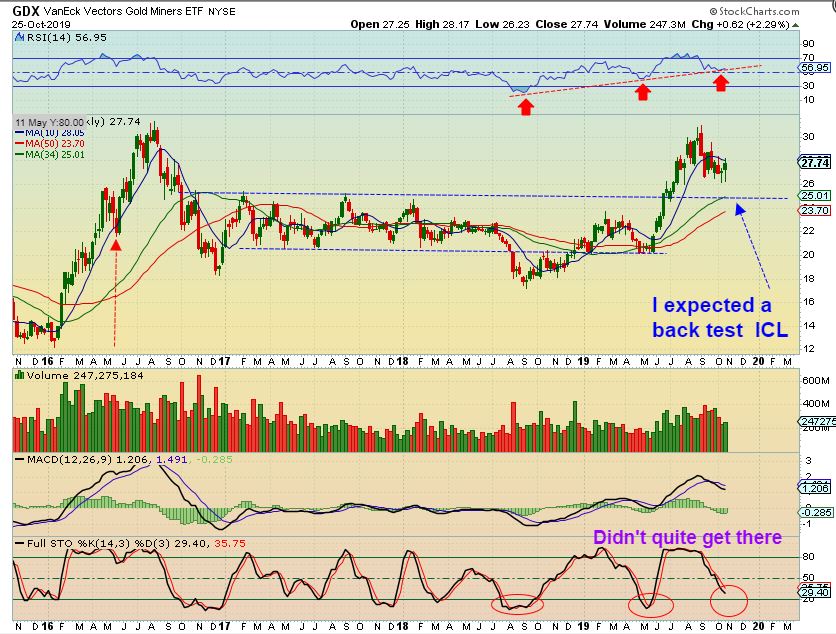
GDX WEEKLY – To be honest, I expected a deeper drop, but we do have 2 weekly reversal candles here. Look at the RSI, near 50% & a trend line, so it is at an area where it could turn higher .
.
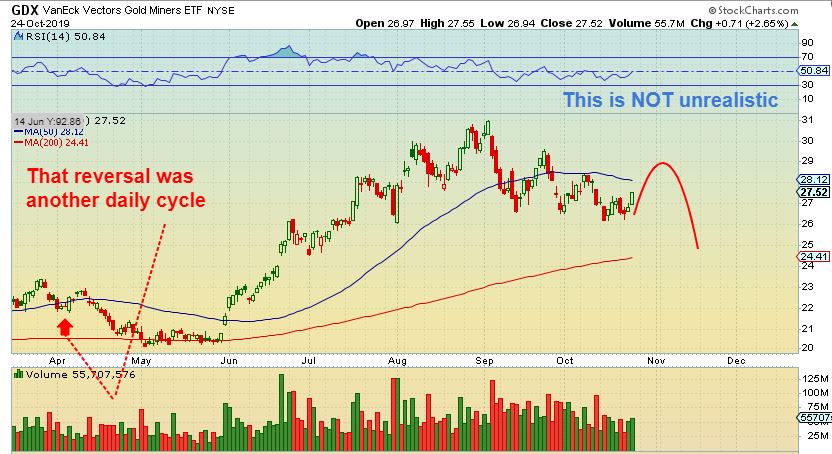
GDX WEEKLY – Now look at the weekly stochastics. Even our last Mild sideways ICL reached oversold, and that could also be signaling that this daily cycle may just be a strong looking bounce that rolls over too.
Important: Now look at MAY 2016 on the same chart above, and that dip did not come close to oversold. It then just rocketed straight up. Seeing these things, I am cautious, but I have to play this as though it were a meaningful low like we saw that May. Also individual Miners DO LOOK VERY GOOD.
.
I started buying Miners last week, and so far it paid off on Friday, but at this point, I am cautiously optimistic. This report explains why and I’ll add more at the end of the report.
.
I don’t argue about things like ” Isn’t the Fed Rate cut bullish for Gold, so we know that Gold will take off higher?” Haven’t we ALL been fooled by the markets before? Haven’t we seen bad technical stories, but a stock just keeps climbing? I’ve seen very Bullish looking stories and yet the stocks sell off. I have to ignore any bias, I don’t need to know all the reasons why or why not, I just trade what is showing up in front of me in the charts, and MINERS are at least short term bullishly set up.
.
I am excited about the set up in Miners, and I have purposely been putting the bullish set ups & what I like about different Miners in each report. Some are releasing earnings & being rewarded with Upside surprise! VERY NICE. Now we just have to see if we can get bullish follow and that strong second rally now starting on this Fed Week, or will it just be another slap in the face. 😉 Even if the ICL is still another daily cycle away, and even if this becomes a small stop loss/ slap in the face, we can keep reminding ourselves that when that ICL hits, we can double our money on the next run out of the ICL. The small loss now will amount to nothing.
.
REST UP & ENJOY YOUR WEEKEND, I can just tell that we are going to have a busy week ahead of us!
.
~ALEX
.
How about a short summary on Miners before we move on?
1. The set up in Miners has progressively become more & more Bullish looking. Why?
2. I started feeling bullish last week seeing strength begin to progressively develop (breaking ‘down trend lines’, closing over the 50 sma, etc).
3. GORO, AEM, and AUY released earnings and all had bullish surprise to the upside. That is certainly nice for a change. See their charts.
4. I started Buying some positions to hopefully take in some gains while things play out, but using stops because …
5. IT IS BULLISH, YET WE NEED TO BE A BIT CAUTIOUS, BECAUSE IT CAN ROLL OVER. I’ll discuss that further below.
.
In prior reports I have discussed the possibility that we get 1 more daily cycle too. That would involve having a dcl in place now from a recent low. It would run higher into the fomc mtg & then may roll over L.T. I have seen that before, I will show you that below so that you too will know that it is possible. Let’s review that again and discuss how I play that…
.
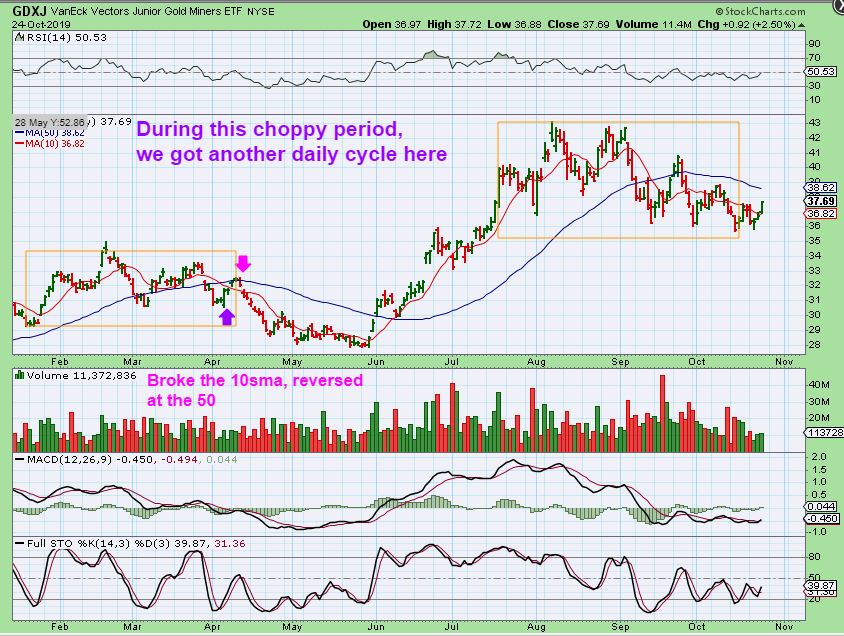
GDXJ – Look at the orange box in Jan through April 2019. I expected an ICL in April, and we got a bounce like we have now. THAT bounce in April was another daily cycle starting and then THAT ONE rolled over…
.
.
GDXJ – Look at how quickly that last daily cycle sold off in April. It sold off relentlessly & THAT is what I look for when I expect an ICL. GDXJ also closed above the 10sma & tagged the 50sma in April just like we just did & dropped on day 3 or so ( see the 2 arrows). This chart was as of Thursday, but we just did that too.
.
GDXJ – If we got another daily cycle , similar to what we saw in April, then we could drop down & fill that gap or tap the top of the gap. We just need to keep this cautionary idea in the back of our minds, while gaining a more bullish outlook. FOMC Week is always volatile.
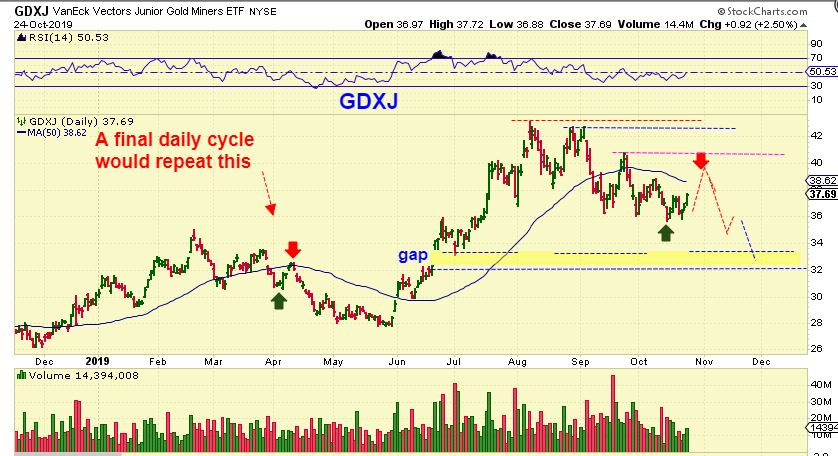
In that situation, you have to play that DCL as though it is a final ICL, just in case it really was a Mild ICL. Why play it now? It would be too hard to enter later if it just took off and kept running for 7 or 8 straight days, right? So at this point, until we get going & until we put in a higher high, we just raise our stops and stay alert.
.
I will also show you another interesting view…
.
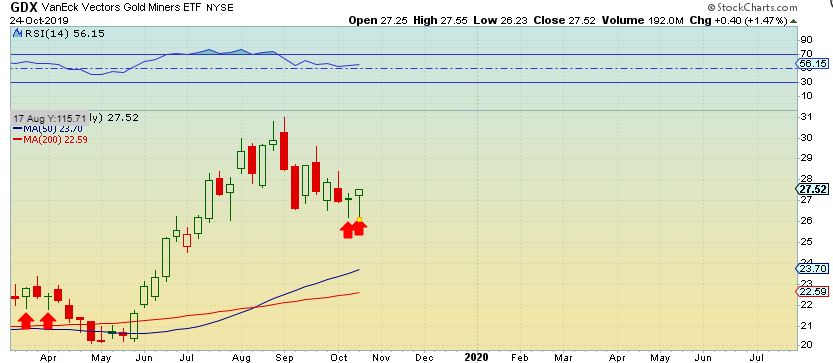
GDX WEEKLY – This chart is from Thursday night. Someone pointed out that we have 2 weekly reversal candles forming. Doesn’t THAT indicate that the lows are definitely in place? Well, look back at April & the 2 arrows show something similar right before a drop into the ICL. We had 2 weekly reversal candles and that last reversal candle was really just a DCL. so…
.
GDX Daily – “We had 2 weekly reversal candles and that last reversal candle was really just a DCL. ” This is the daily view of that time. You can see that 1 of those weekly reversal candles was the start of a L.T. Daily cycle. We then sold off into the ICL. So I drew that in for right now too.
Another Example:
.
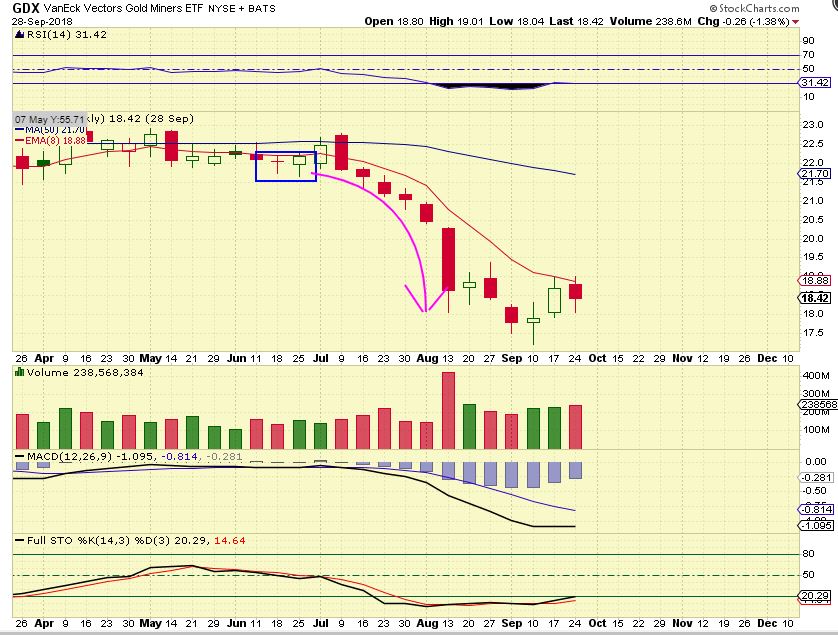
GDX SEPT 2018 ICL – We had 2 weekly reversal candles in a row again (Blue Box) right before that savage drop in June – Sept time period. So that last reversal candle was also really just a DCL that lasted for 2 weeks . The bounce was short lived & it rolled over quickly.
..
These above examples just highlight to me that until we get higher highs, we need to remain aware of the possibilities, use stops, and Stay Frosty my friends! If we get higher highs, that is bullish and should signal the start of the next Bull Run. I am talking about possibly GOLD $1800+ or so.
So whether this next leg of the rally starts here after a rather Mild bullish ICL, or whether it comes after another Daily Cycle, our patience will be well rewarded. Some of my best gains have always been with Miners coming out of an ICL. You can even double or triple your investments. We will not miss a thing!
.
P.S. While I’m looking for a Bull, I found a rather friendly Deer here in a field in N.Y. True story, I had to keep pointing at him to stop him from following me. Now I just need to find a Bull that will stick around like that!