
Change In Character: T- Minus 4
I think that Fridays report needs to focus on the Precious Metals Sector. I am just going to mention a few key thoughts that I am having, and then we’ll get into the charts.
.
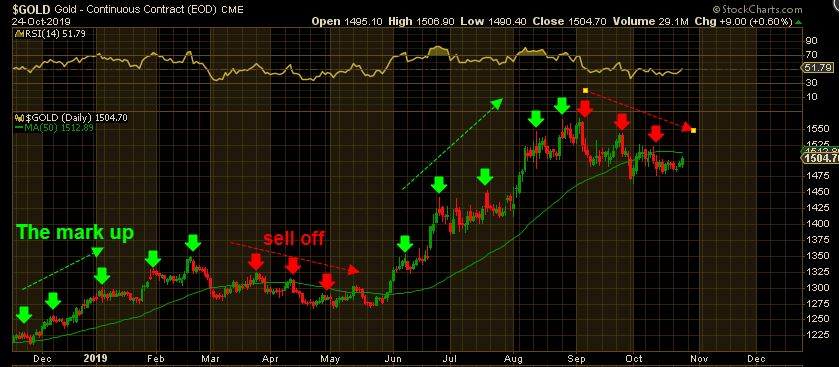
1. When we start to move beyond 3 or 4 months in an Intermediate Cycle, we have to expect a pull back that will begin to give us ‘lower highs’ and ‘lower lows’ ( a downtrend). When this happens and we break below a dcl, we are starting our sell off into an ICL. That sell off may take as long as a 4 or even a 5th daily cycle to get there. We have started to see that sell off type of action, so I have been watching for a dcl ( or ICL).
.
2. Important: The action in the Miners SHOULD be getting weaker as each final daily cycle moves forward. From experience I know that we really should NOT see price popping higher after day 25 or so, we should see WEAKNESS as time pushes forward.
.
3. I AM NOT SEEING WEAKNESS IN THE MINERS and we are very late in this daily cycle. Now lets discuss this sector.
.
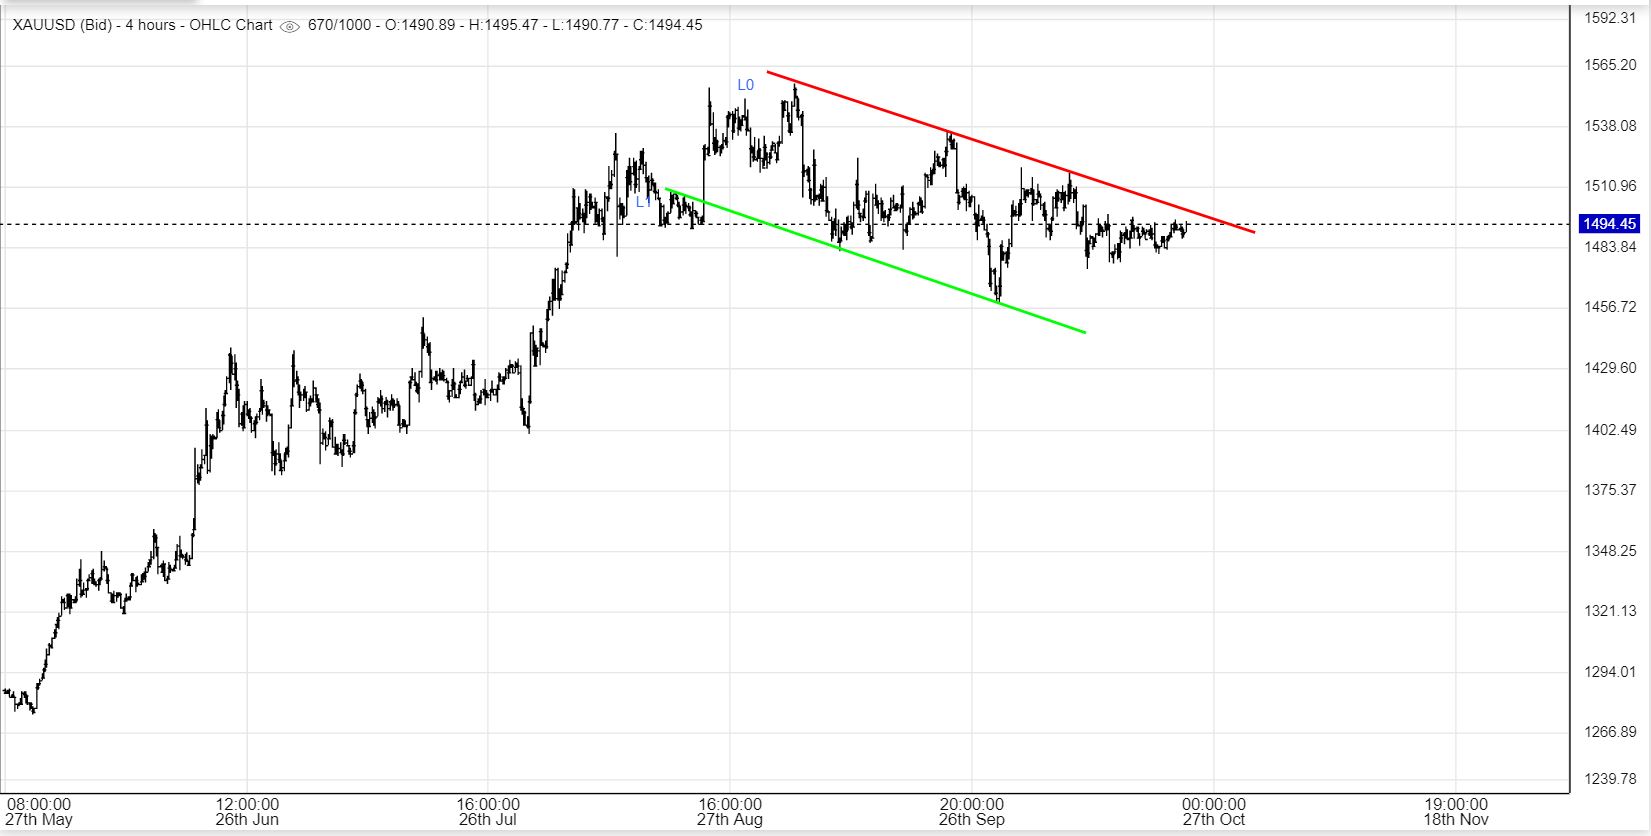
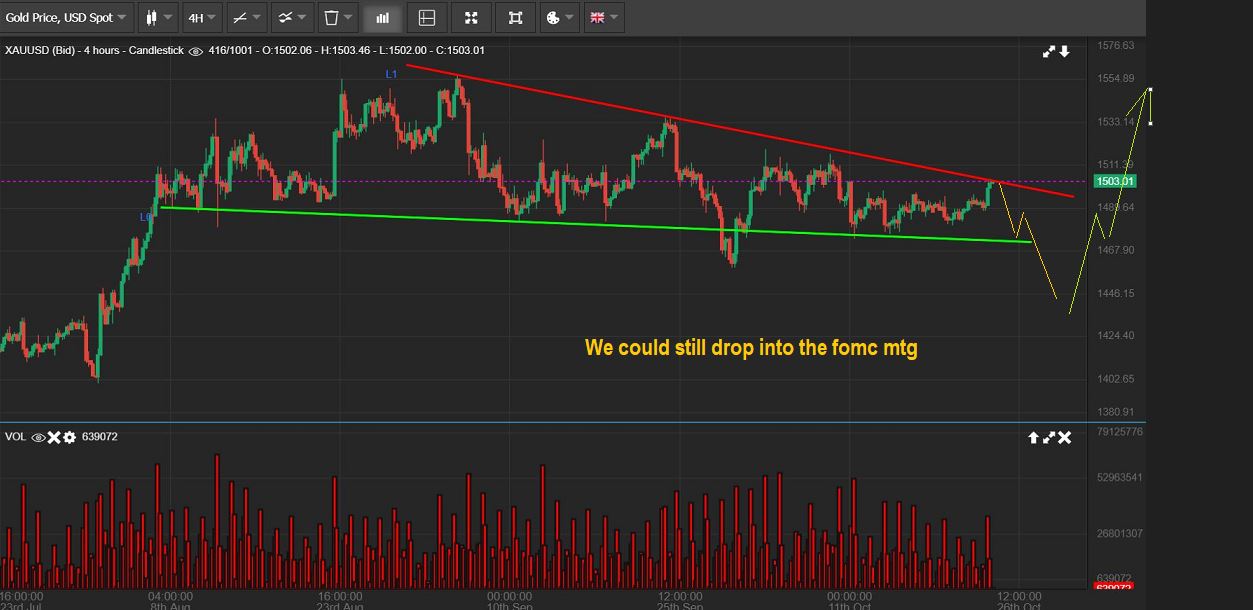
GOLD – This was a live 4 hr snapshot of Gold that I took pre-market on Thursday. It shows the current down trend, and the parameters that I am watching. Gold had been chopping sideways.
.
GOLD – Suddenly Gold Popped after I posted that and it ran straight to the upper trend line. Gold was threatening to break out, and as I have mentioned in a few of the recent reports- a break of the down trend would have to be respected. It is a sign of bullishness.
.
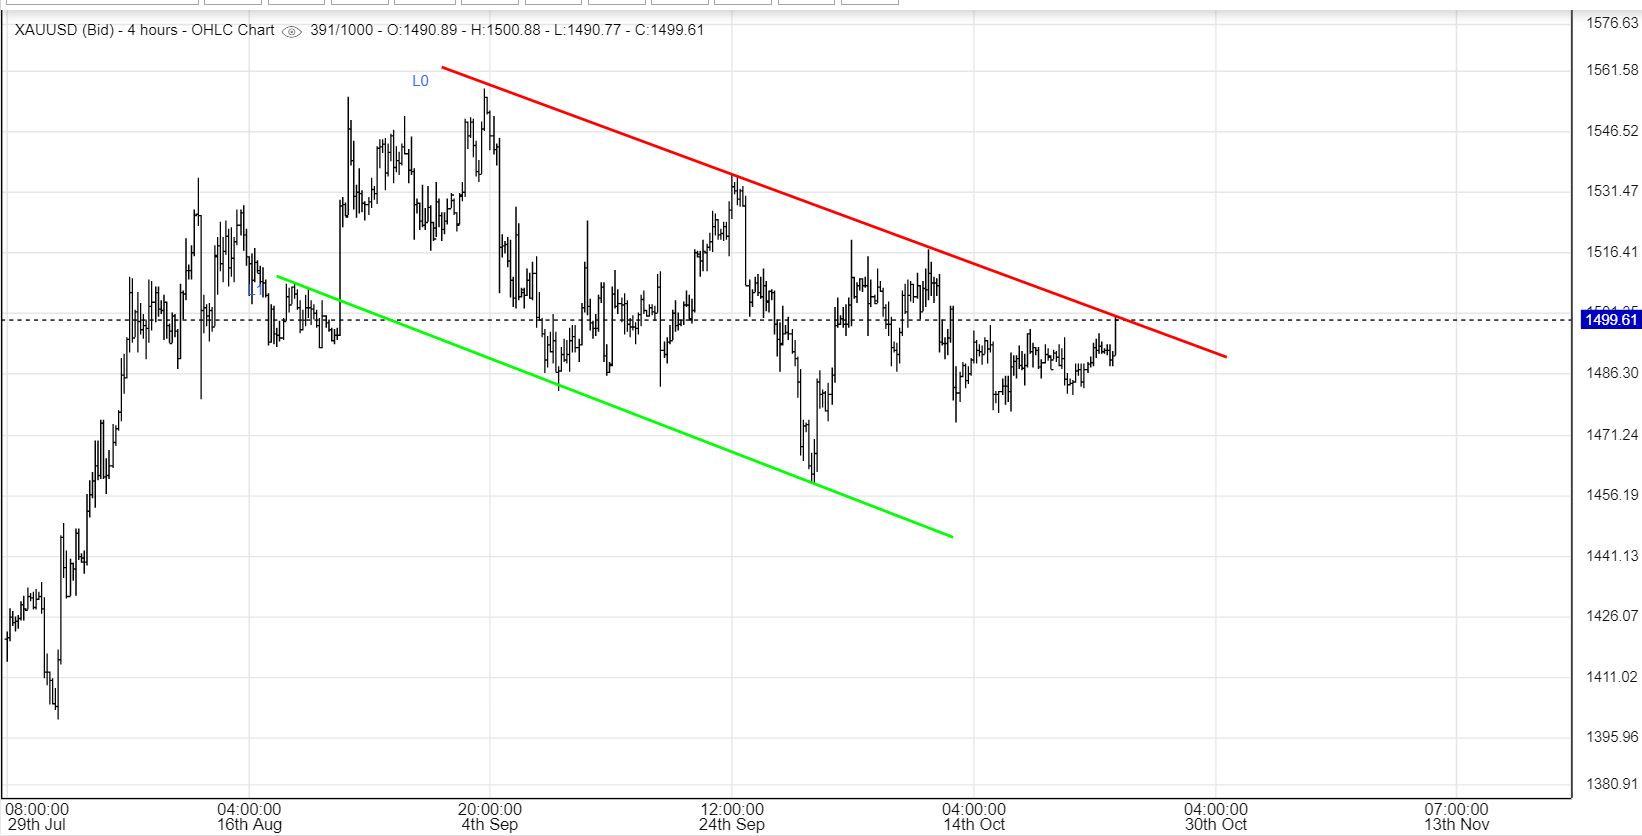
GOLD #1 – I moved the lower trend line, because I am seeing more ‘tags’ of the lows this way. It makes the 1 stand out / shake out drop look like a false break down from a wedge. This is Gold currently, so right now we see GOLD threatening to break out Friday. We are only 4 trading days from the fomc mtg. T-Minus four and counting.
.
I have said this before, but it needs to be repeated…
.
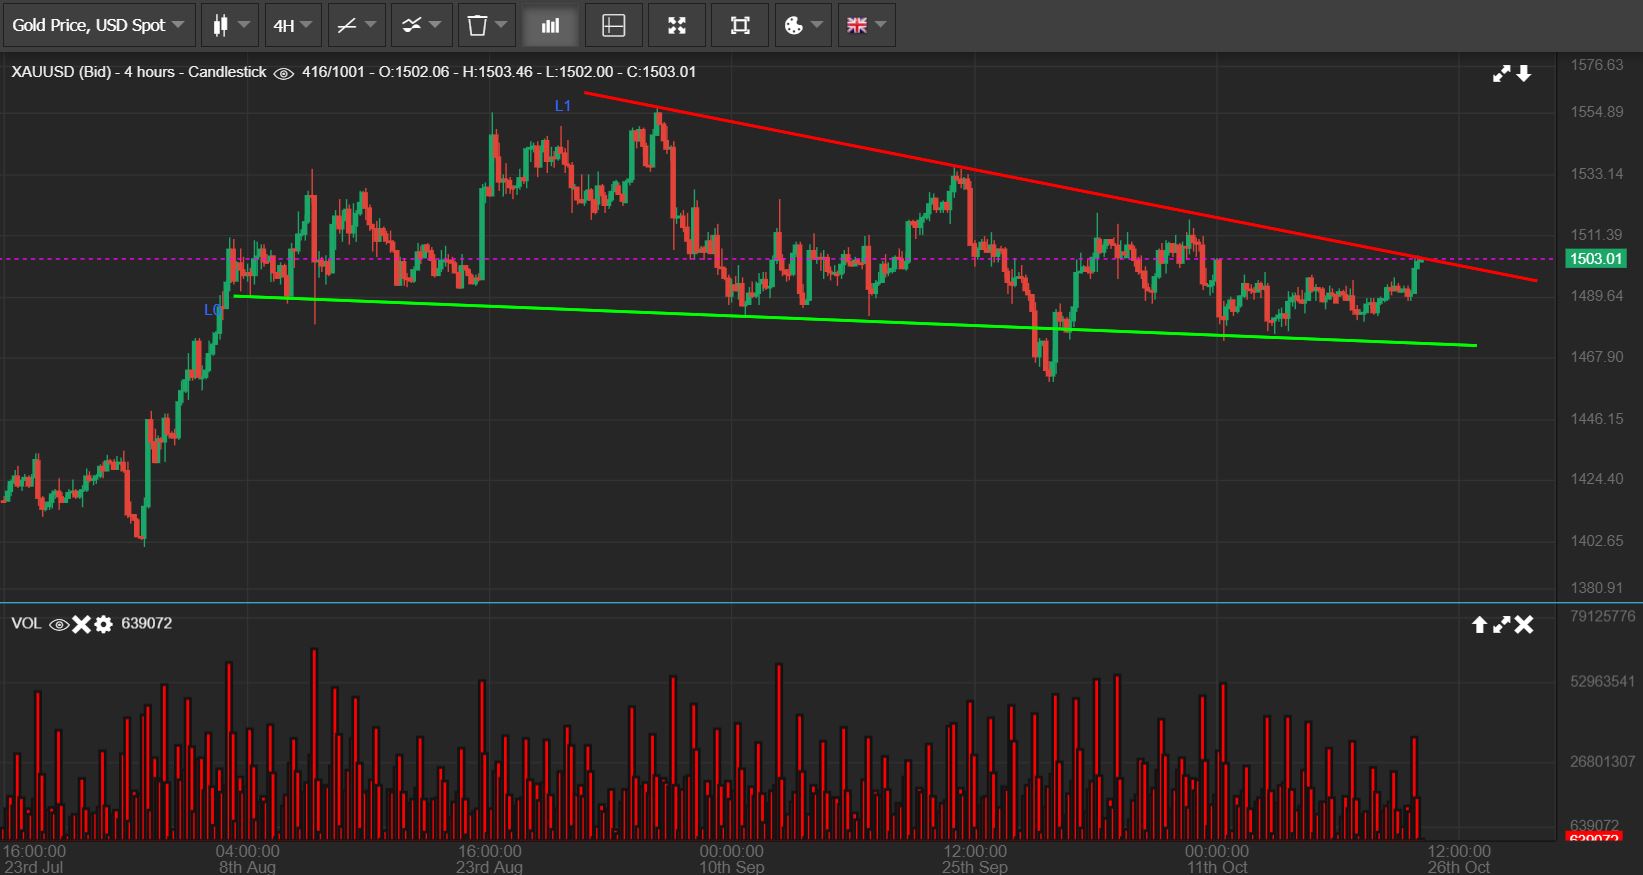
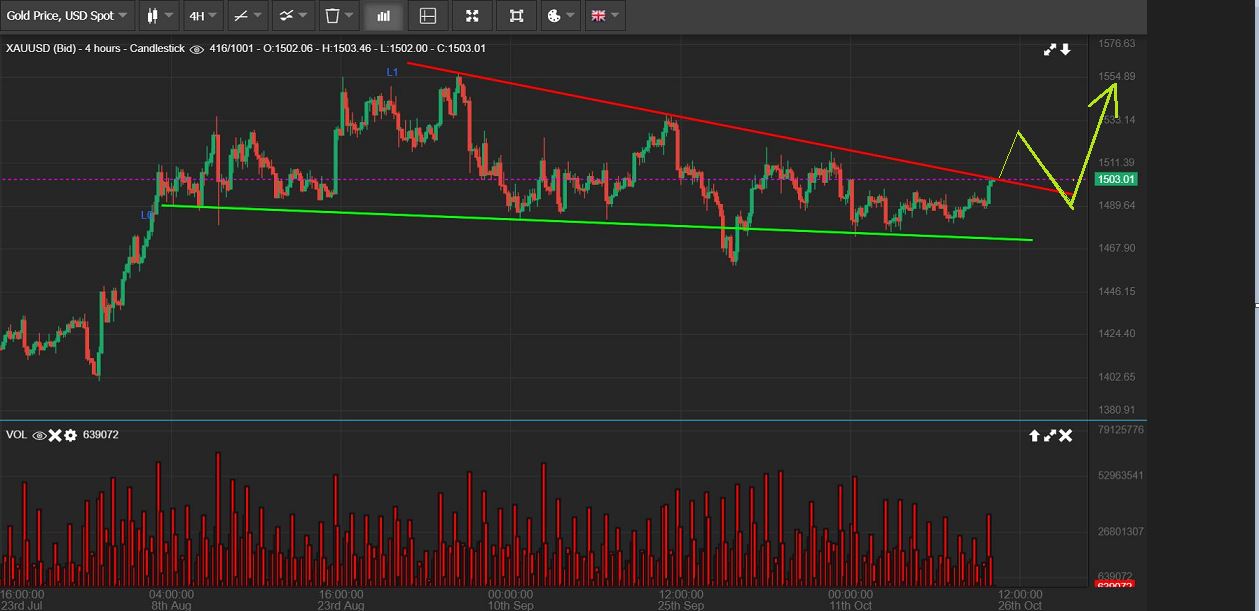
GOLD #2 – This is what I was expecting and it could still happen, however, I am NOT SEEING THE WEAKNESS IN MINERS that we should see late in a final daily cycle, so…
.
GOLD #3 – If this breaks out, it could run. This is a long consolidation and they can add fuel to the fire ( short covering, buyers grabbing the break out, etc).
.
I will discuss Miners shortly, but the reason that we needed to discuss a possible break out in Gold again is because the MINERS STARTED BREAKING HIGHER. They look Bullish, and that is not common in a normal 4th or 5th daily cycle on day 30. SOMETHING ELSE MAY BE HAPPENING, AND I WILL EXPLAIN THAT AT THE END OF THE REPORT.
..
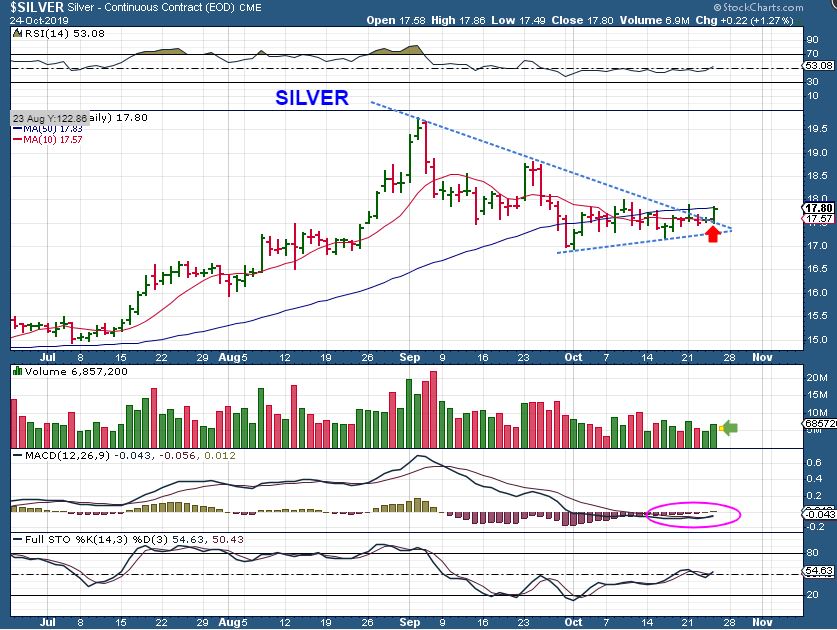
SILVER – Silver is under the 50 sma, but it broke out from this triangle. THAT is what is important to me. In my experience, I have seen Triangles ‘mess up’ cycle counts, because they are a series of higher lows and lower highs, and pennants are usually continuation patterns. .
.
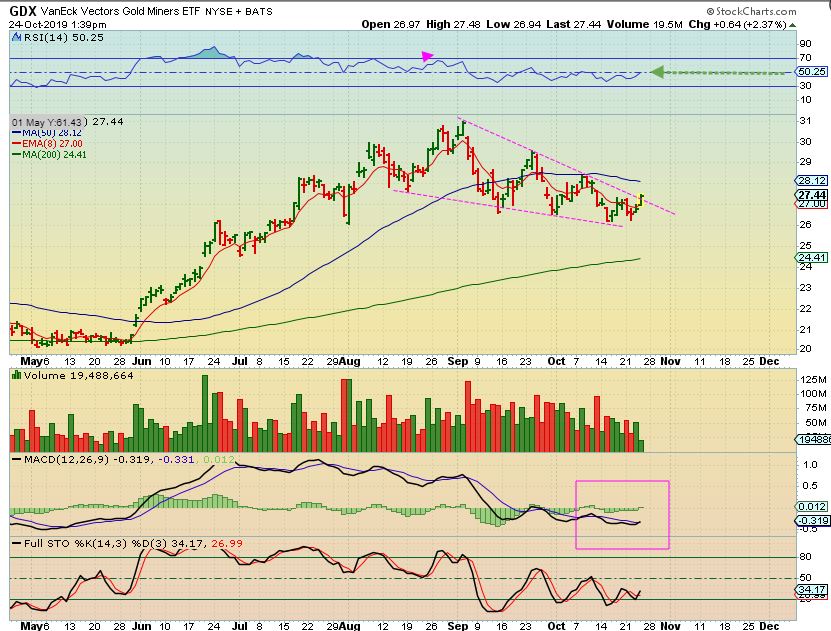
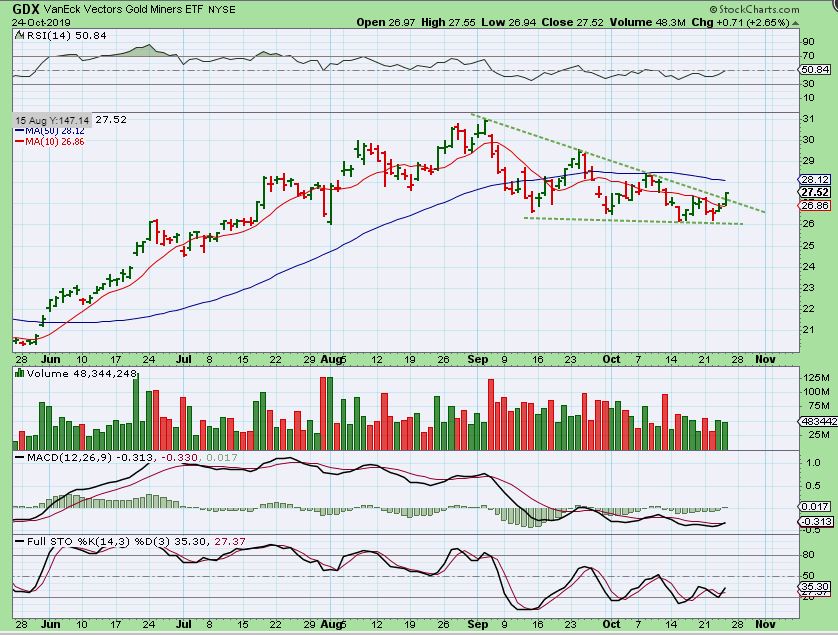
GDX MIDDAY – GDX broke that downtrend & was above the 10sma Midday. Many Miners were acting very bullish, breaking through their 50sma & above their downtrends. It was Noteworthy this late in the cycle timing. I mentioned that I have decided to start buying.
.
GDX – ANOTHER TRIANGLE. GDX closed at the highs. It may just run to the 50 sma and get rejected, but some individual Miners are breaking out, so that influenced my decision to start a few positions. As some Miners report earnings, they are also getting Bullish reactions.
.
I discussed the possibility that we get 1 more daily cycle too. What if we have a day 22 dcl, and it runs higher & rolls over L.T.? That is possible, so until we get going higher, we just raise our stops and stay alert. Let me show you ( again) What that could look like…
.
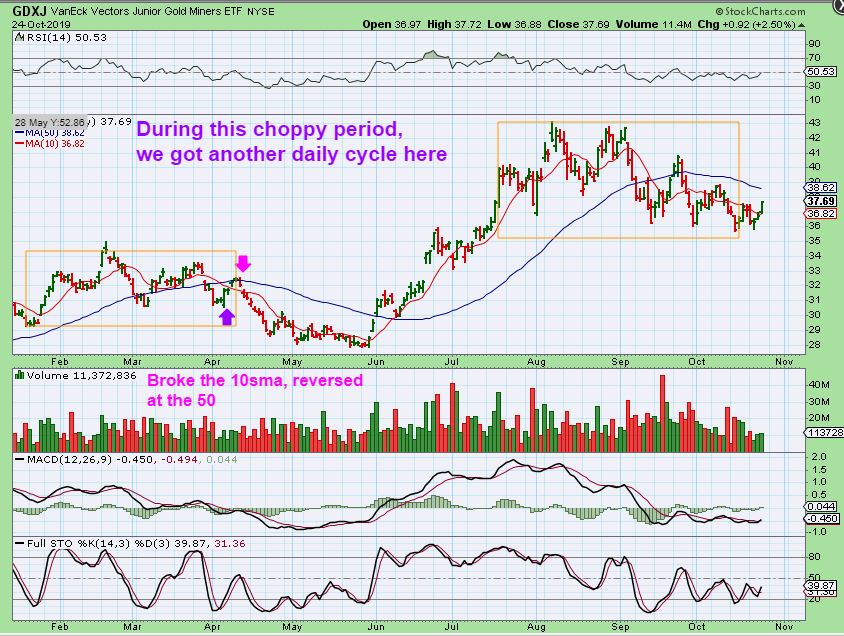
GDXJ – Look at the orange box in Jan – April 2019. I expected an ICL in April, and we got a bounce. THAT bounce in April was another daily cycle starting and then THAT ONE rolled over…
.
.
GDXJ – Look at how quickly that last daily cycle sold off in April. It sold off relentlessly & THAT is what I look for when I expect an ICL. GDXJ also closed above the 10sma & tagged the 50sma in April & dropped on day 3 or so ( see the 2 arrows).
.
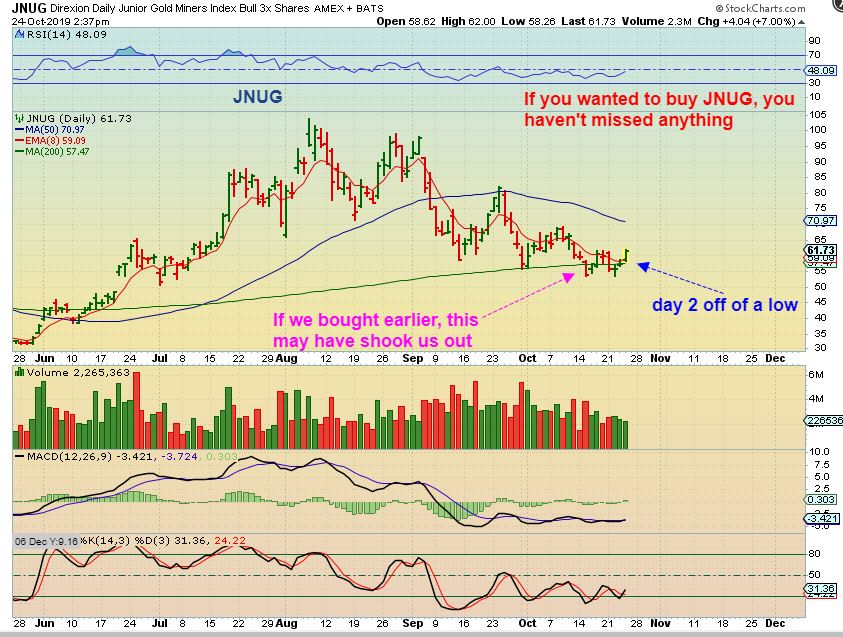
JNUG – I thought that it was interesting that JNUG is only on day 2 out of the lows. For those that buy or trade leverage, this could be bought near the lows & use a TIGHT STOP.
.
Let’s take a look at some individual miners again. I have been posting these in past reports to show their bullish set ups, but now some are breaking out.
.
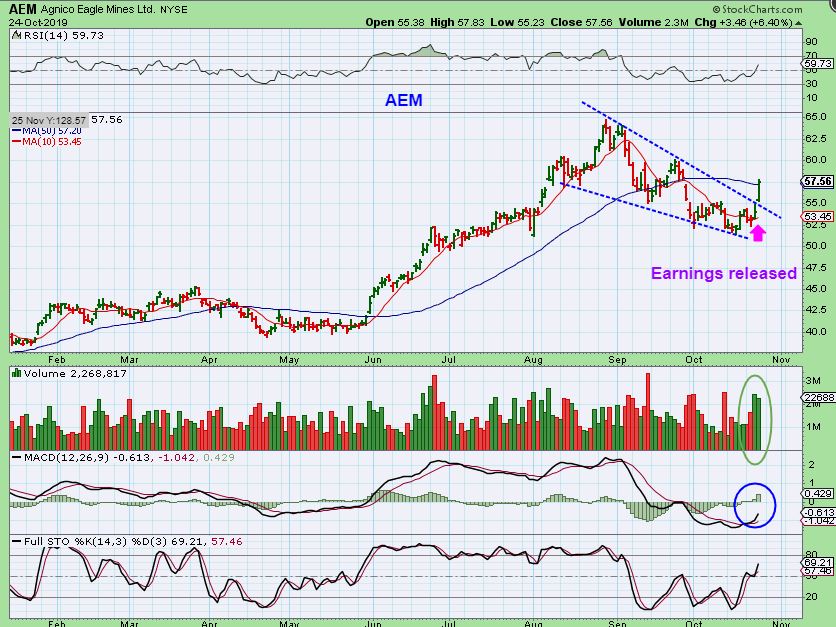
AEM – I posted AEM yesterday as a Miner breaking a down trend with an earnings release, and after earnings…
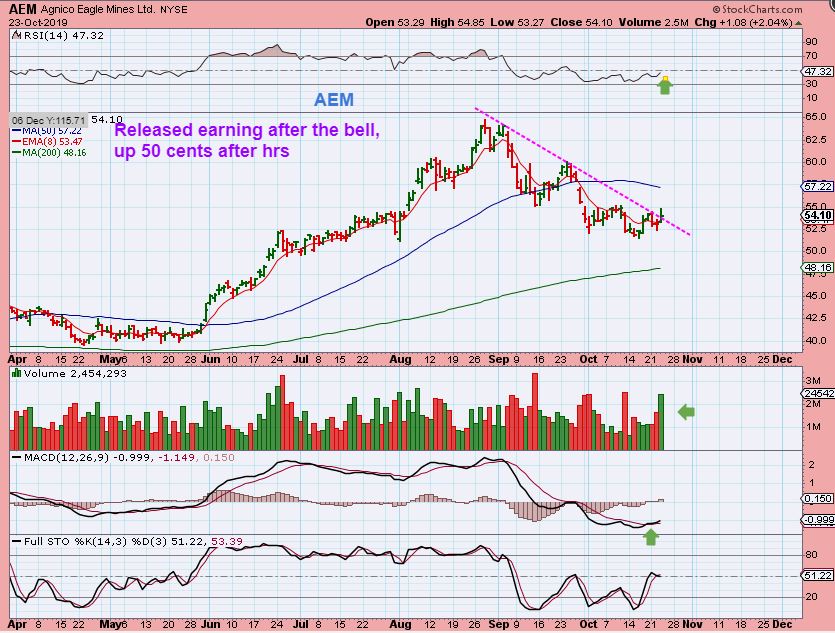
AEM – That is a Big pop with volume , and it pushed through the 50 sma.
.
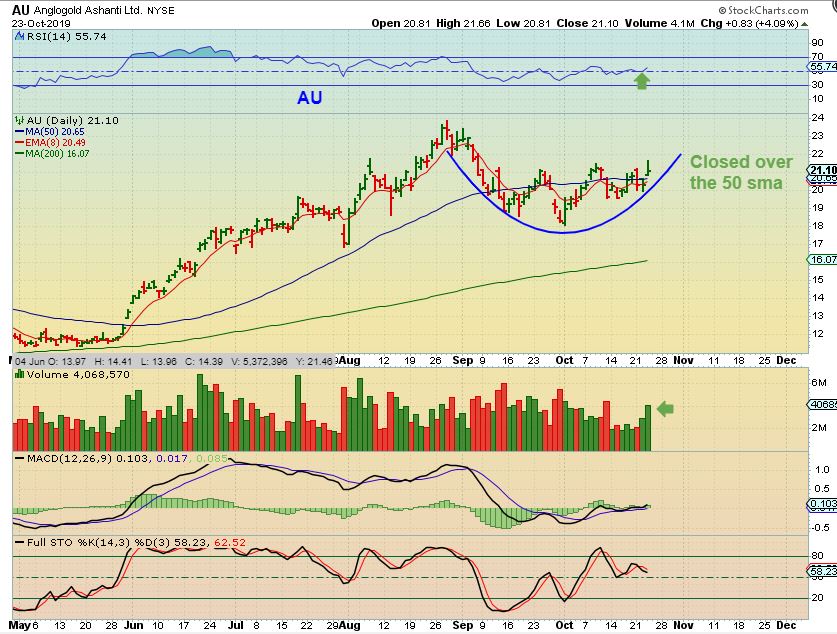
AU from yesterday– AU is already slowly forming a cup. It closed above the 50 sma Wednesday and the chart looks more bullish than bearish to me.
.
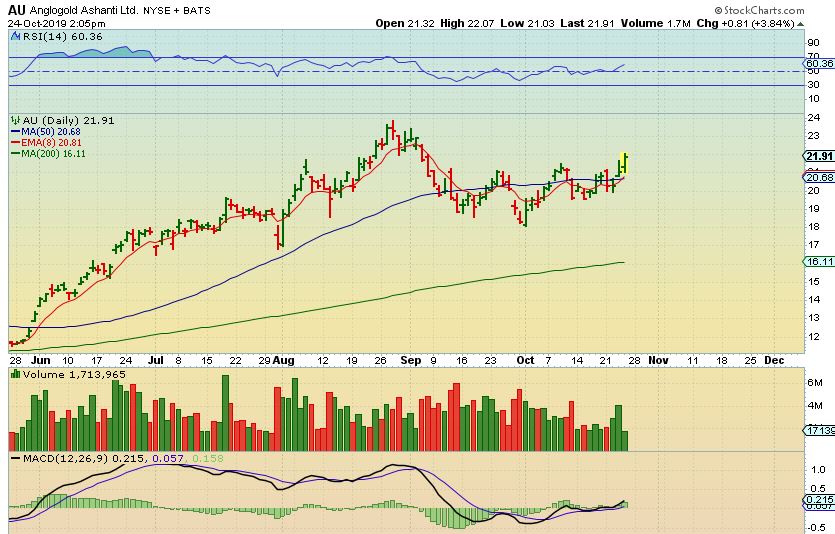
AU– AU broke out Thursday too, and it does not look like weak action at the end of a dcl or ICL , does it? This is Bullish.
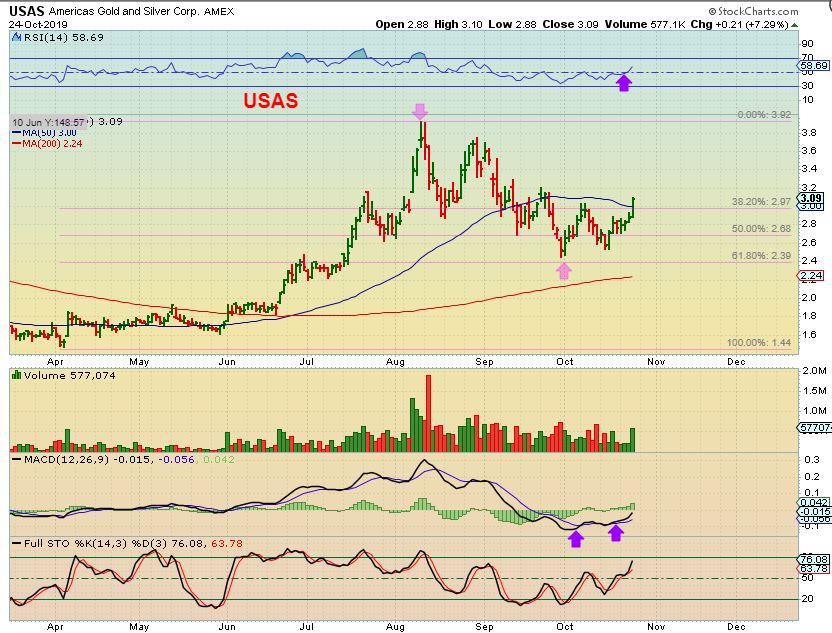
USAS – This was a Great run & also a fairly deep pull back (62%). Thursday it was pushing higher through the 50 sma. It has a higher low and now a higher high in October.
.
.
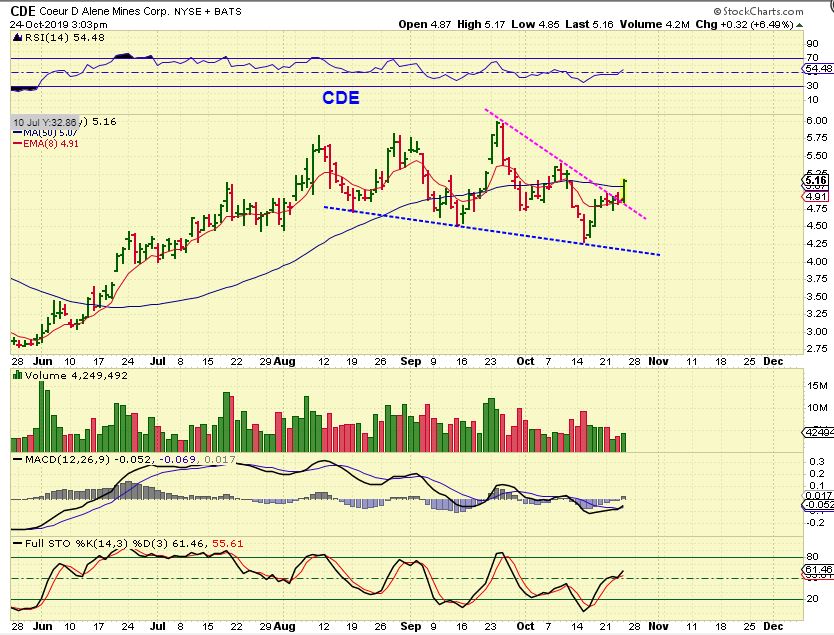
CDE – CDE broke the 50 sma too.
.
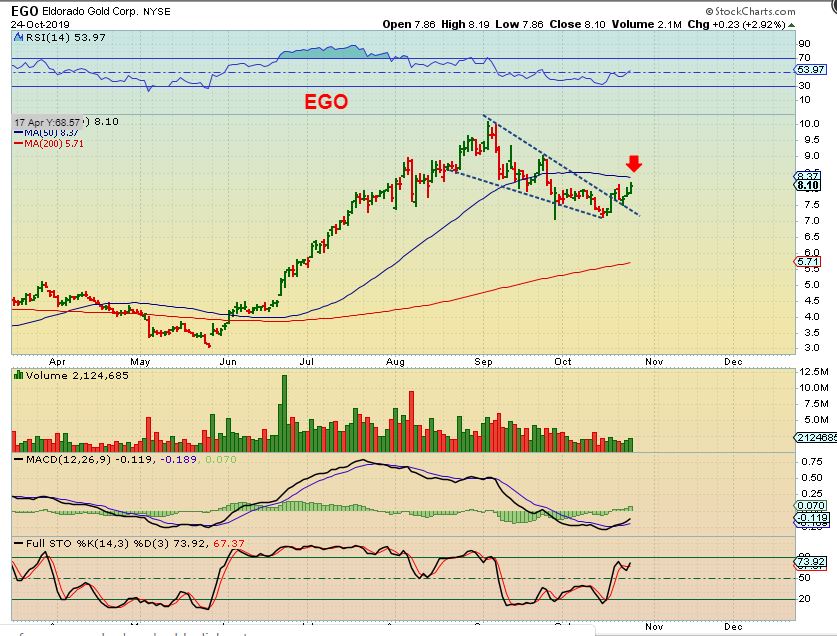
EGO – EGO broke a down trend & back tested it. It may break the 50 sma next, but I really put this chart here to point out that EGO ran up 200% on the last run. This was a nice pull back.
.
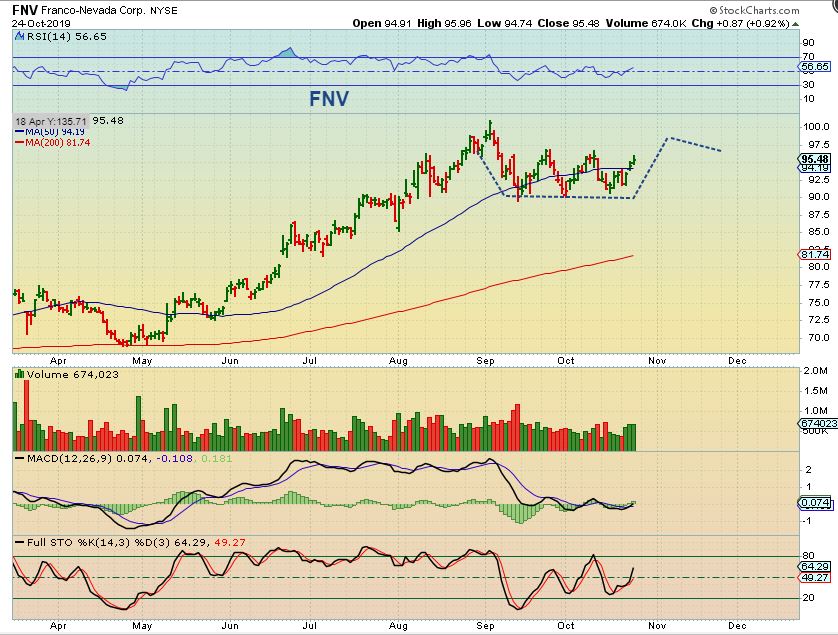
FNV – FNV has barely pulled back during this consolidation, and that is very encouraging & bullish for FNV. It may be forming a very nice pan. FNV ran from $70 – $100 ( Roughly 40%) .
.
.
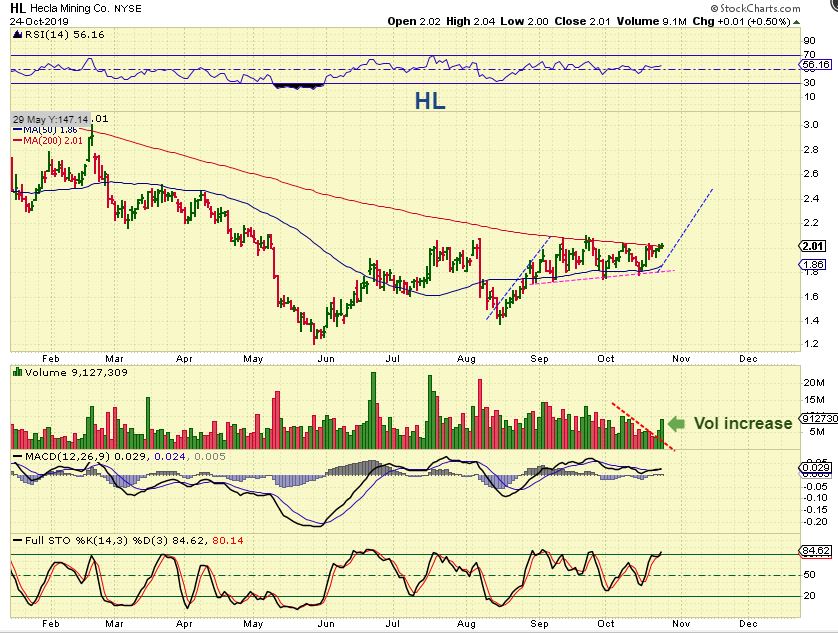
HL – I’m still watching HL for a break out from this tight range.
.
NG – NG was mentioned Oct 22, it is in a solid trading range and at the lows, and…
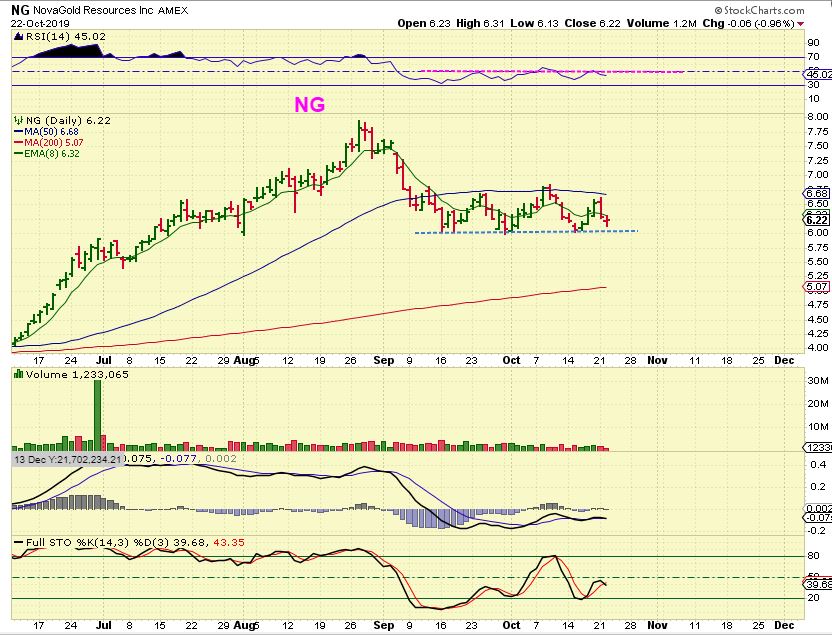
NG – It Popped sharply Thursday, so watch for a possible break out Friday if Gold is holding up.

.
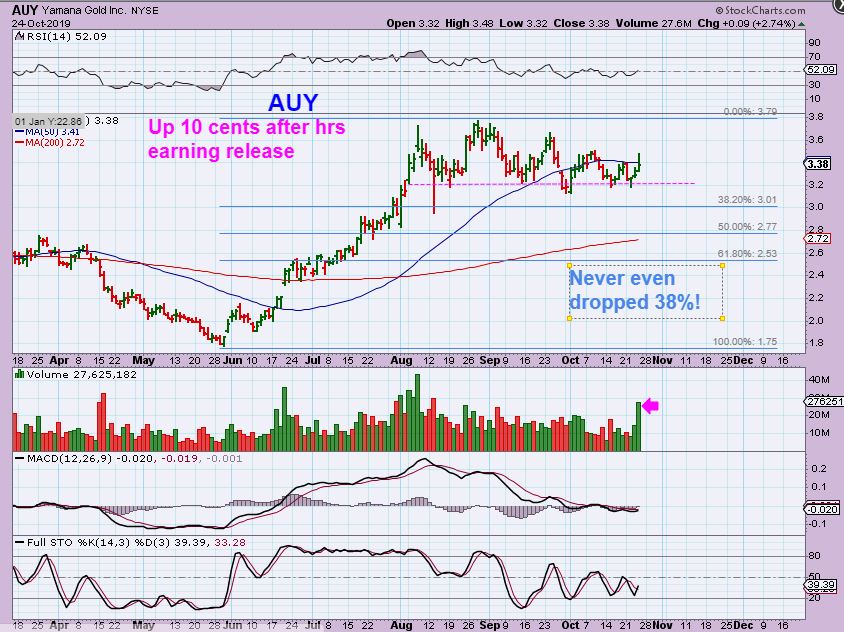
AUY – AUY barely dropped during this choppy consolidation. It released earnings Thursday night and moved a bit higher…
.
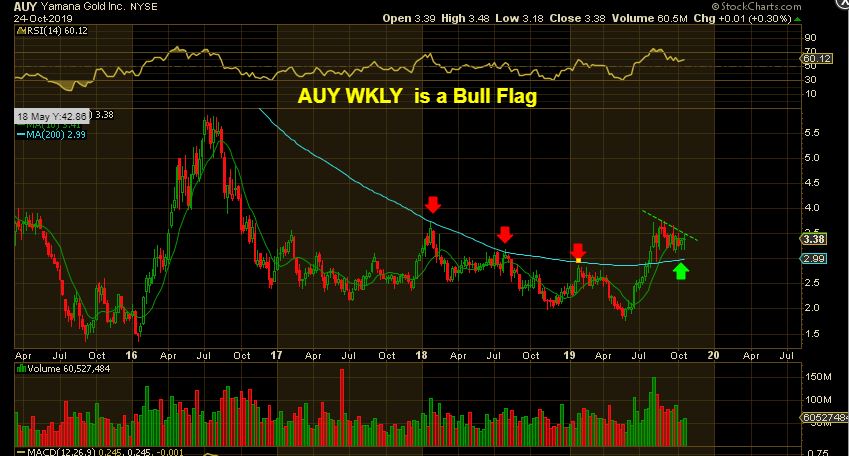
AUY WEEKLY – AUY just looks like a Bull Flag on the weekly chart.
.
As of Thursday we have seen Silver, GDX, & GDXJ break through their upper down trend lines. Several Miners that I have reported as breaking their down trend lines in the past have now also broken through the 50 sma, so we may be seeing leadership and the direction is upward. We have triangles or pennants that formed in Gold, Silver, and Miners. They are usually continuation patterns when set up the way they are. I would normally be expecting a deeper sell off to the ICL, and it could have come from a false break down of the pennants / triangles and then a rally, but currently Miners just look very bullish. With all of this, I would think that it is fairly low risk to enter a few trades of those showing such signs of strength.
I bought some starter positions on a few Miners on Thursday, and will raise stops and see how they play out from here. I bought HMY & USAS as Miners that I’d like to just hold as part of a core for the next run higher. I also usually trade leverage on the side. I will be putting buy set ups in future reports, maybe even more so after the fomc mtg.
.
We are 4 trading days from the Fed decision, and it is possible that the Precious Metals Sector is already starting to make their move. Only time will tell how this will play out, whether this is some sort of a continuation out of a very Mild ICL, or is this just a bounce- the start of a final daily cycle, but the recent signs in Miners does look very bullish. Enjoy your Friday trading & your weekend!
.
~ALEX
.

